
Abstract

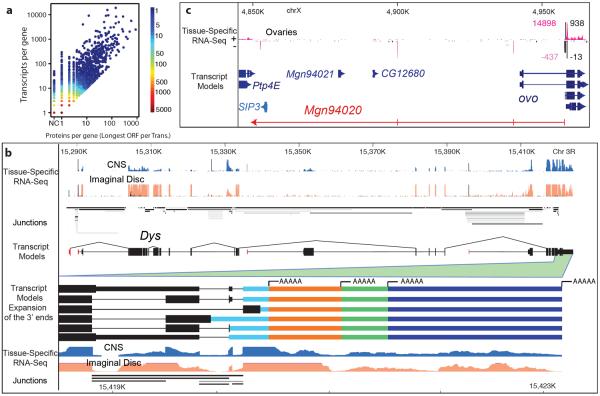
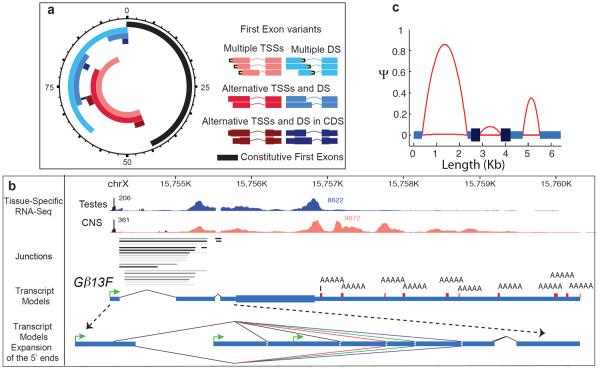
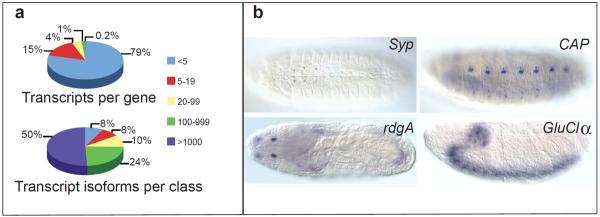
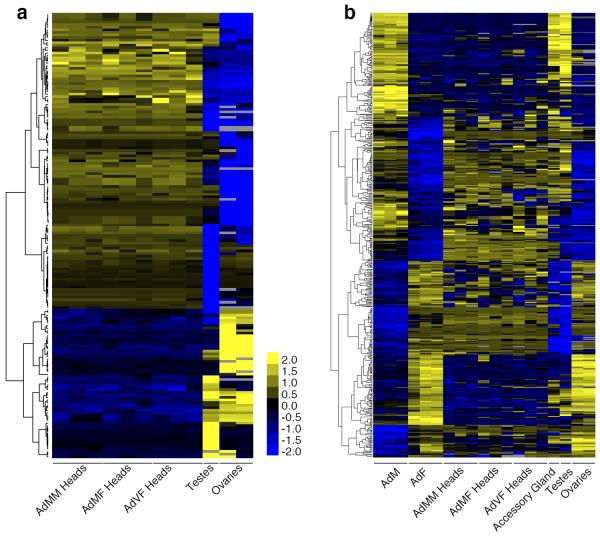
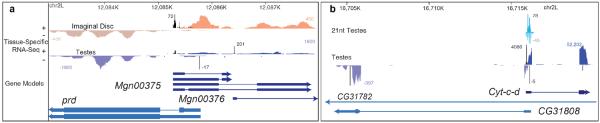
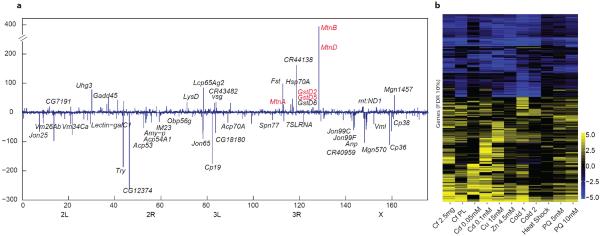
Animal transcriptomes are dynamic, with each cell type, tissue and organ system expressing an ensemble of transcript isoforms that give rise to substantial diversity. Here we have identified new genes, transcripts and proteins using poly(A)+ RNA sequencing from Drosophila melanogaster in cultured cell lines, dissected organ systems and under environmental perturbations. We found that a small set of mostly neural-specific genes has the potential to encode thousands of transcripts each through extensive alternative promoter usage and RNA splicing. The magnitudes of splicing changes are larger between tissues than between developmental stages, and most sex-specific splicing is gonad-specific. Gonads express hundreds of previously unknown coding and long non-coding RNAs (lncRNAs), some of which are antisense to protein-coding genes and produce short regulatory RNAs. Furthermore, previously identified pervasive intergenic transcription occurs primarily within newly identified introns. The fly transcriptome is substantially more complex than previously recognized, with this complexity arising from combinatorial usage of promoters, splice sites and polyadenylation sites.


Figures

Figure 1
Figure 1. Overview of the annotation
a, Scatterplot showing the per gene correlation between number of proteins and number of transcripts. The genes Dscam and para are omitted as extreme outliers both encoding >10,000 unique proteins. b, Dystrophin (Dys) produces 72 transcripts and encodes 32 proteins. Highlighted is alternative splicing and polyadenylation at the 3' end. Shown: CAGE (black), RNA-seq (tan, blue), splice junctions (shaded gray as a function of usage). c, An internal promoter of ovo is bidirectional in ovaries and produces a lncRNA (430bp, red) bridging two gene deserts. CAGE (black), RNA-seq (pink), counts are read-depth (minus-strand given as negative).
Figure 2
Figure 2. Splicing complexity across the gene body
a, Alternative first exons occur in two main configurations: multiple transcription start sites (TSS, pink) and multiple donor sites (DS, light blue). A subset of the genes in the multiple TSS category produce transcripts with different TSSs and shared DSs (red), and a subset of the genes in the DS category produce transcripts with a shared TSS and different DSs (blue). Some genes in the multiple TSS category directly affect the encoded protein (maroon), and similarly for DS (dark blue). Overlap of configurations is radially proportional (units indicate percentage of all spliced genes). b, Poly(A)+ testes (blue) and CNS (orange) stranded RNA-seq of Gβ13F showing complex processing and splicing of the 5'UTR. An expansion of the 5'UTR showing some of the complexity. Transcription of the gene initiates from one of three different promoters (green arrows) terminates at one of ten possible polyA+ addition sites (from adult head poly(A)+seq, red) and generates 235 transcripts. The first exon has two alternative splice acceptors that splice to one of eleven different donor sites. Only five donor sites are shown due to the proximity of splice sites. Four splice donors are represented by the single red line differing by 12, 5 and 19bp respectively. Three splice donors are represented by the single green line differing by 12 and 11bp. Two splice donors are represented by the single purple line differing by 7bp. These splice variants are combined with four proximal internal splices (Supplementary Fig. 3a) to generate the full complement of transcripts. c, Intron retention rates (ψ) across the gene body. The genome-wide mean lengths of exons and introns are connected by red parabolic arcs, which illustrate the upper and lower quartiles of intron retention (across all samples) for introns retained at or above 20 ψ in at least one sample.
Figure 3
Figure 3. Complex splicing patterns are largely limited to neural tissues
a, A small minority of genes (47, 0.2%) encode the majority of transcripts. b, In situ RNA staining of constitutive exons of four genes with highly complex splicing patterns in the embryo. Syncrip (Syp), Cap, Retinal degeneration A (rdgA) and GluClalpha show specific late embryonic neural expression in the ventral midline neurons; dorsal/lateral and ventral sensory complexes; Bolwig's organ or larval eye; and central nervous system respectively.
Figure 4
Figure 4. Sex-specific splicing is largely tissue-specific splicing
a, Clusters of tissue-specific splicing events. The scale bar indicates z-scores of ψ. b, Sex-specific splicing events in whole animals are primarily testes- or ovary-specific splicing events.
Figure 5
Figure 5. Examples of antisense transcription
a, 5'/5' bidirectional antisense transcription at the prd locus. Short RNA sequencing does not reveal substantial siRNA (i.e. 21 nt-dominant small RNA) signal in this region (data not shown). b, A 5'/5' antisense region that produces substantial small RNA signal on both strands.
Figure 6
Figure 6. Effects of environmental perturbations on the Drosophila transcriptome
Adults were treated with caffeine (Cf), Cd, Cu, Zn, cold, heat, and paraquat (PQ). a, A genome-wide map of genes that are up or down regulated as a function of Cd treatment. Labeled genes are those that showed a 20-fold (<10% FDR) change in response (linear scale). Genes highlighted in red are those identified in larvae. Some genes are omitted for readability, the complete figure and list of omitted genes are given in Supplementary Fig. 8a. b, Heat map showing the fold change of genes with an FDR<10% (differential expression) in at least one sample (log2 scale).

Comment in

References

    1. Mortazavi A, Williams BA, McCue K, Schaeffer L, Wold B. Mapping and quantifying mammalian transcriptomes by RNA-Seq. Nat Methods. 2008;5:621–628. - PubMed
    1. Nagalakshmi U, et al. The transcriptional landscape of the yeast genome defined by RNA sequencing. Science. 2008;320:1344–1349. - PMC - PubMed
    1. Takahashi H, Kato S, Murata M, Carninci P. CAGE (cap analysis of gene expression): a protocol for the detection of promoter and transcriptional networks. Methods Mol Biol. 2012;786:181–200. doi:10.1007/978-1-61779-292-2_11. - PMC - PubMed
    1. Mangone M, et al. The landscape of C. elegans 3'UTRs. Science. 2010;329:432–435. - PMC - PubMed
    1. Jan CH, Friedman RC, Ruby JG, Bartel DP. Formation, regulation and evolution of Caenorhabditis elegans 3'UTRs. Nature. 2011;469:97–101. - PMC - PubMed

Publication types

MeSH terms