. 2014 Apr 3;508(7494):123-7.
doi: 10.1038/nature13158. Epub 2014 Mar 19.

Maternal retinoids control type 3 innate lymphoid cells and set the offspring immunity

Affiliations

Maternal retinoids control type 3 innate lymphoid cells and set the offspring immunity

Serge A van de Pavert et al. Nature. .

Abstract

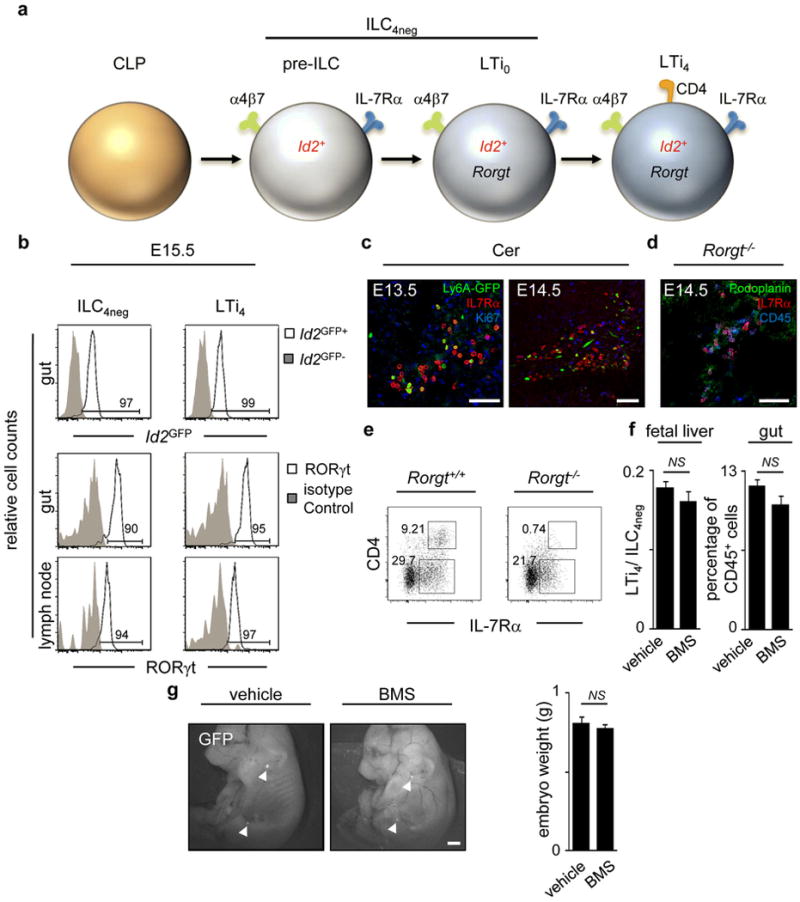
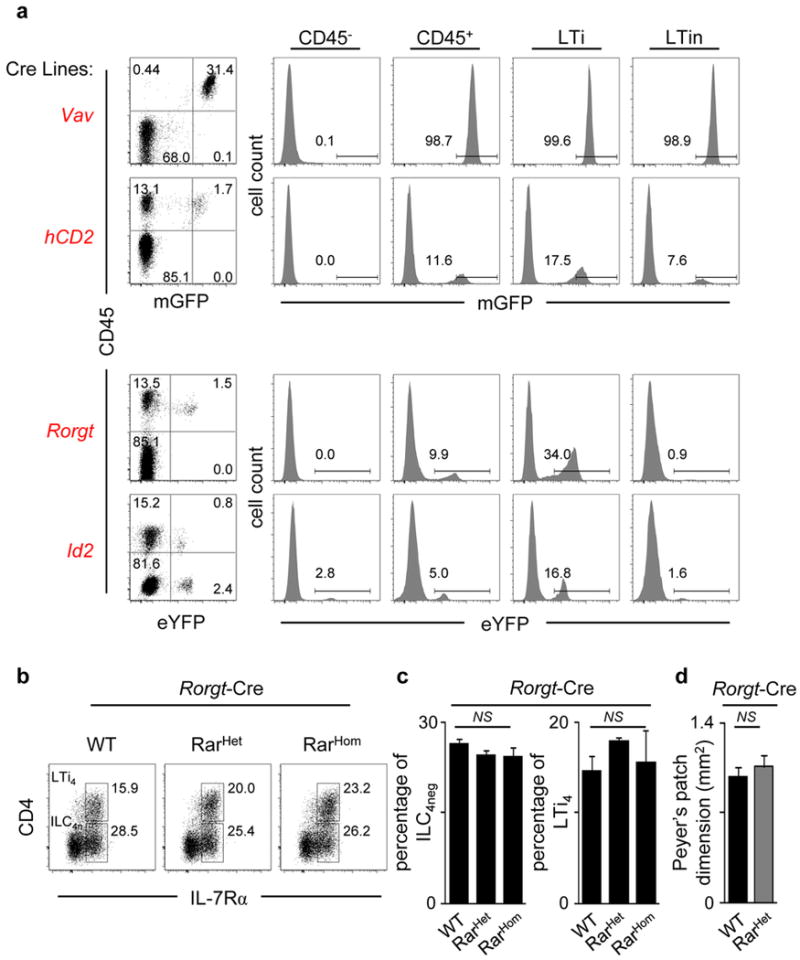
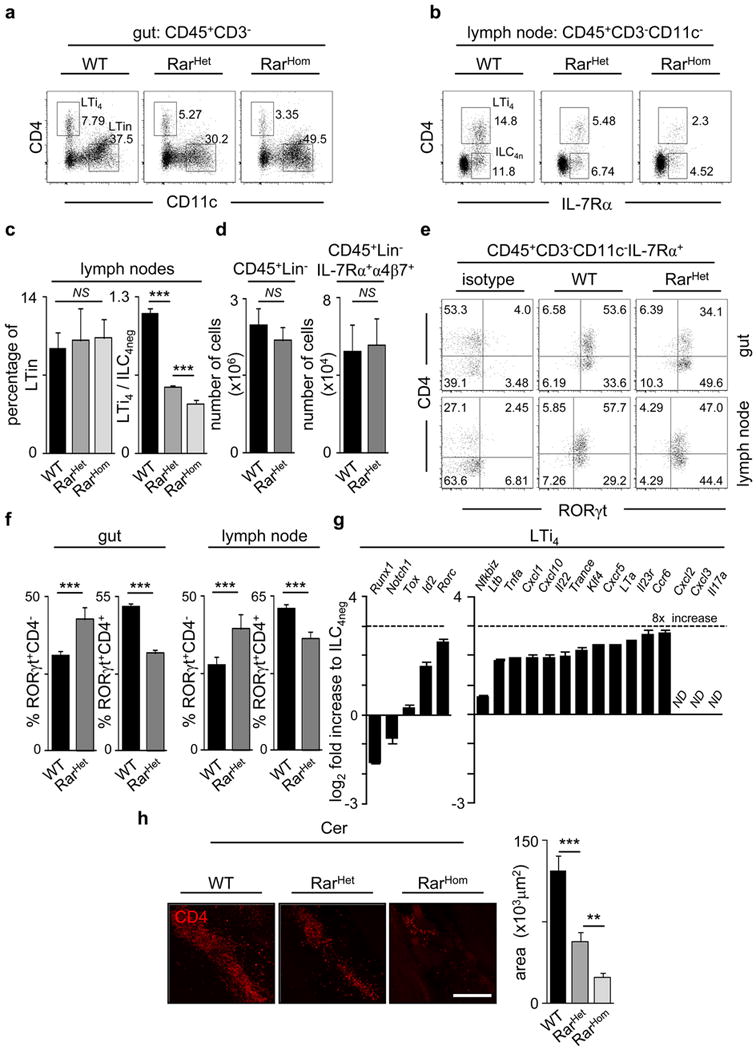
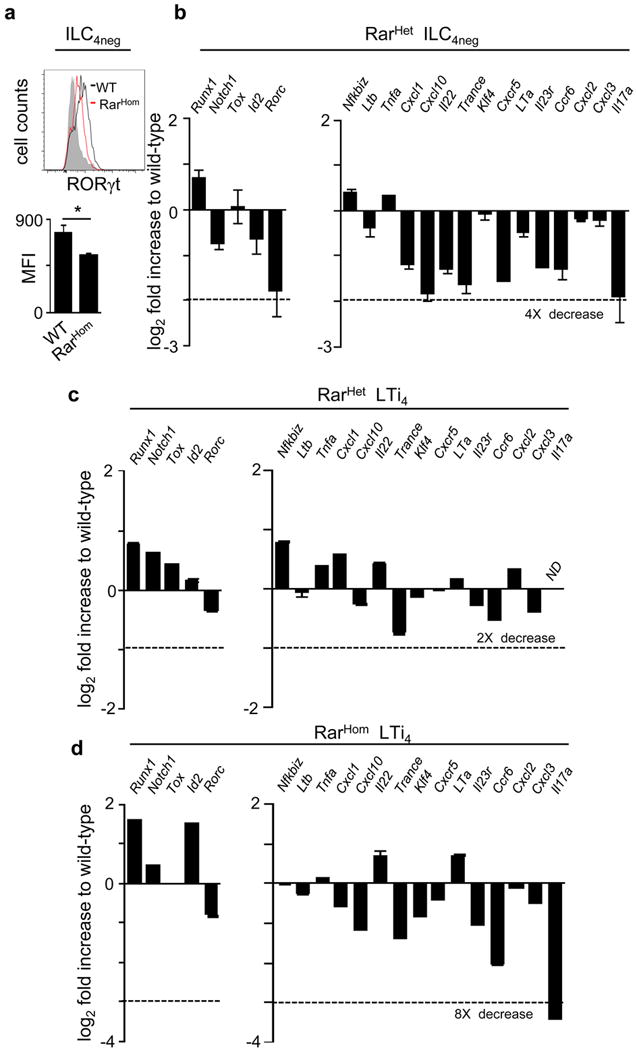
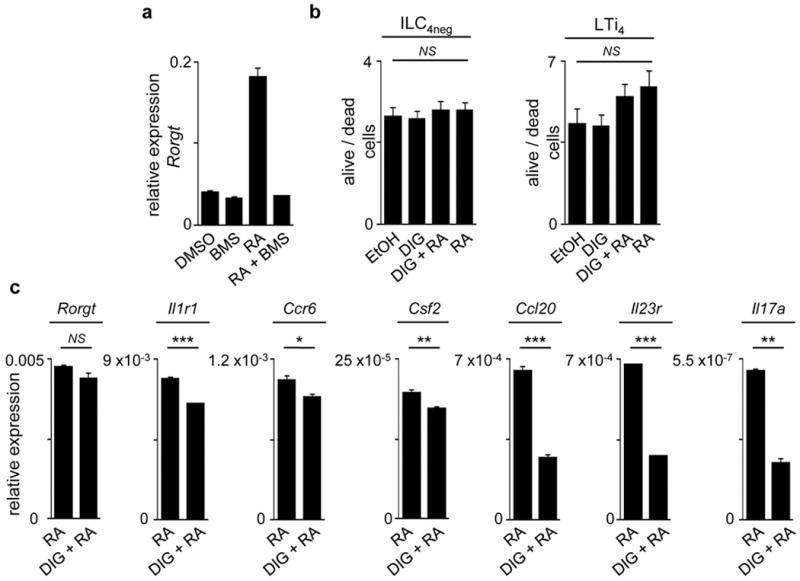
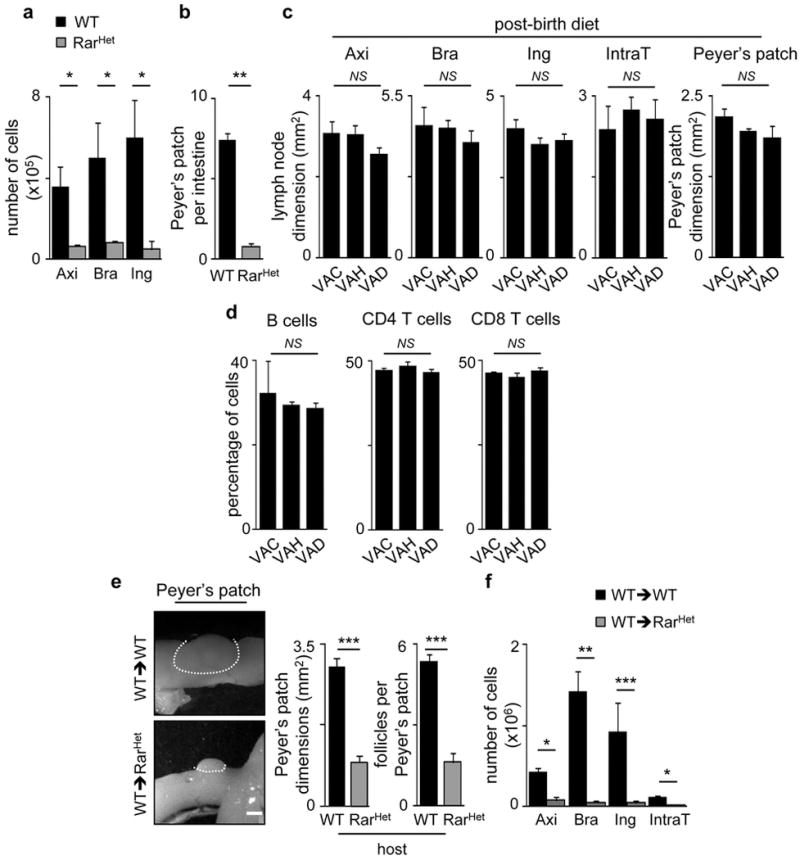
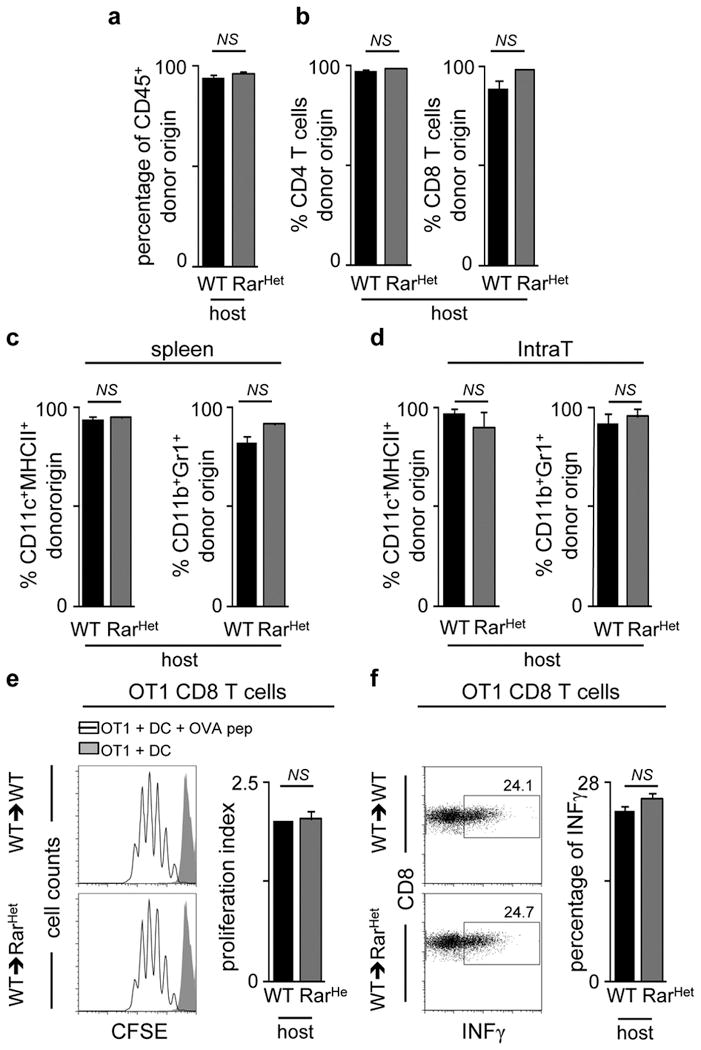
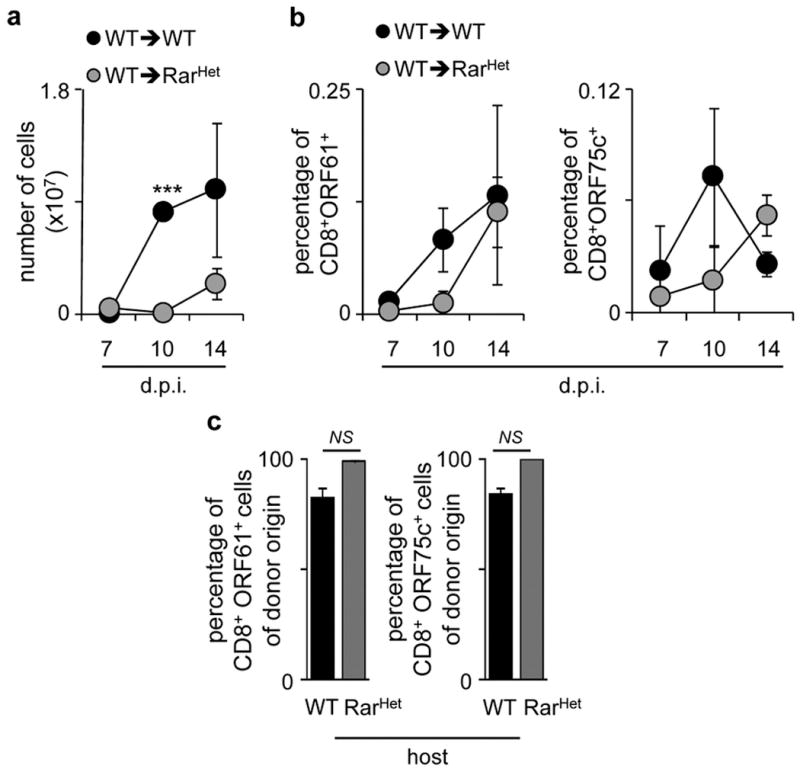
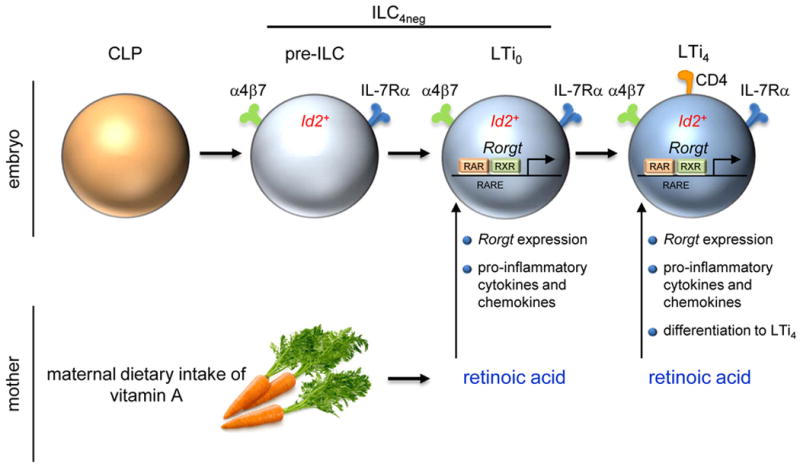
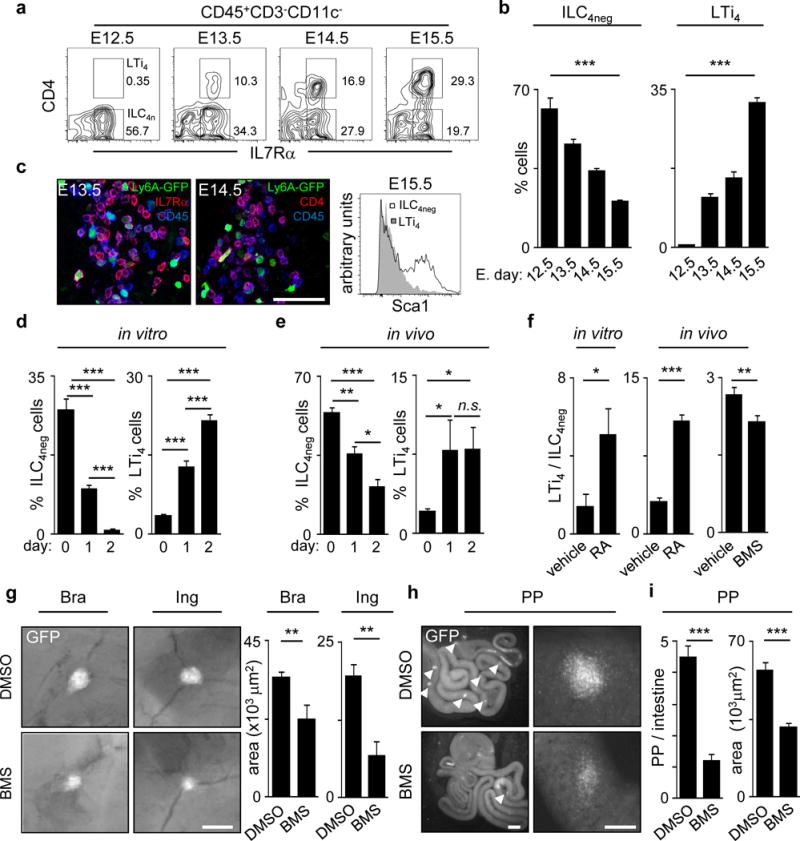
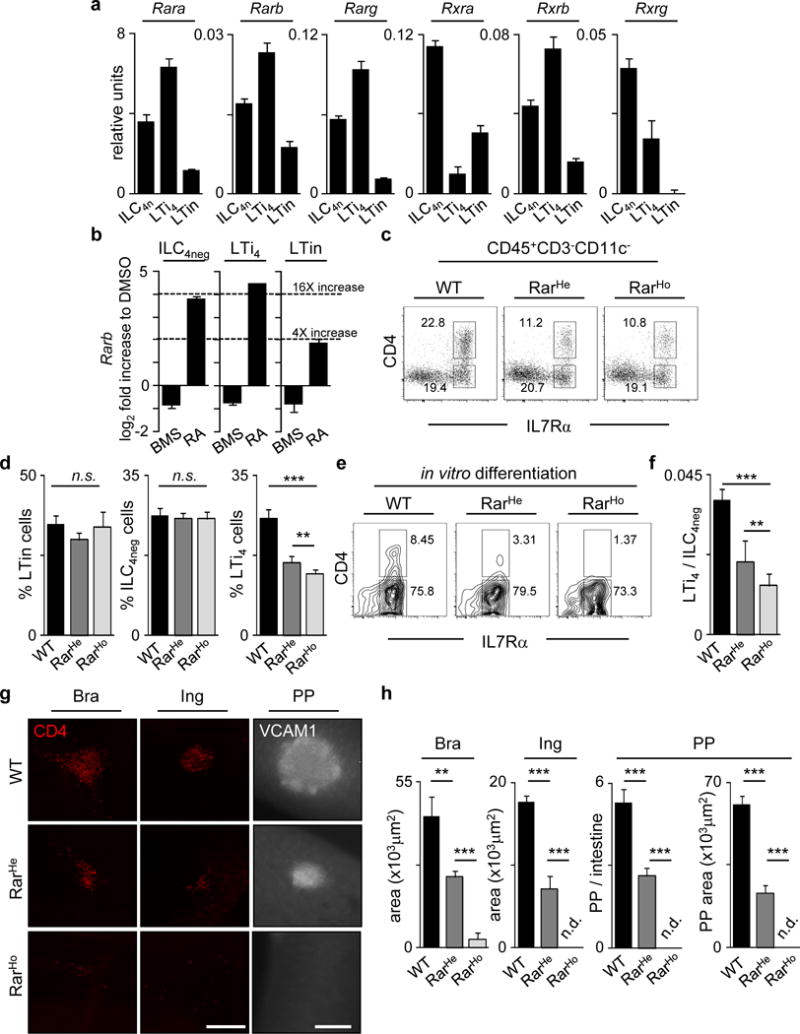
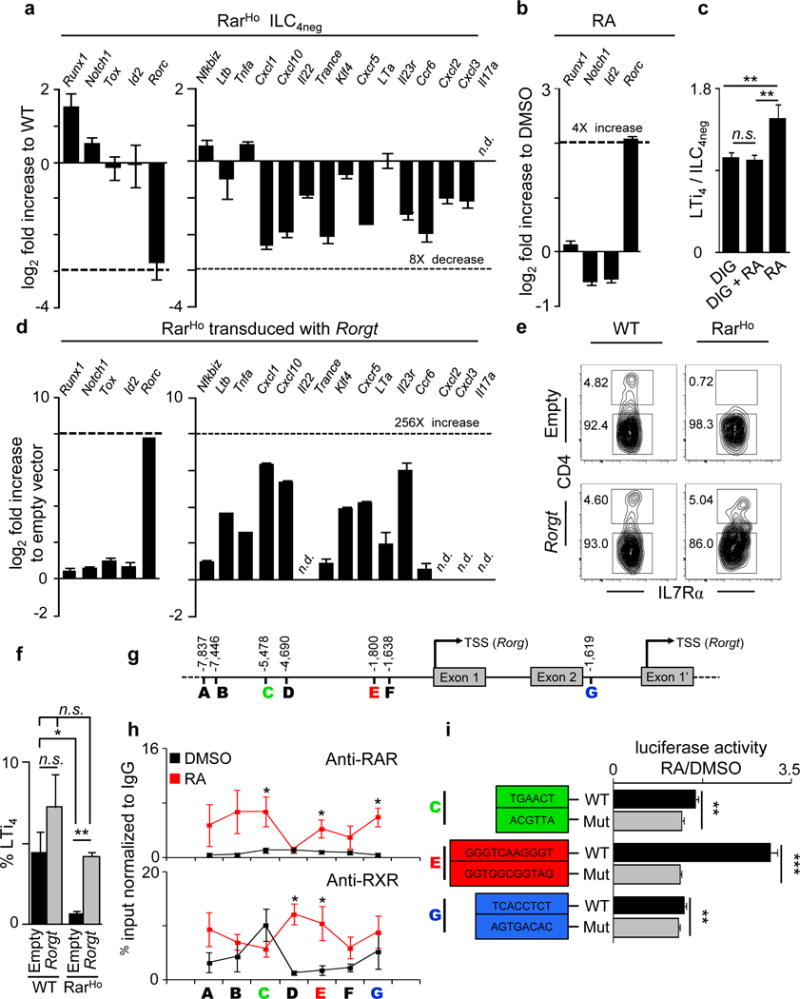
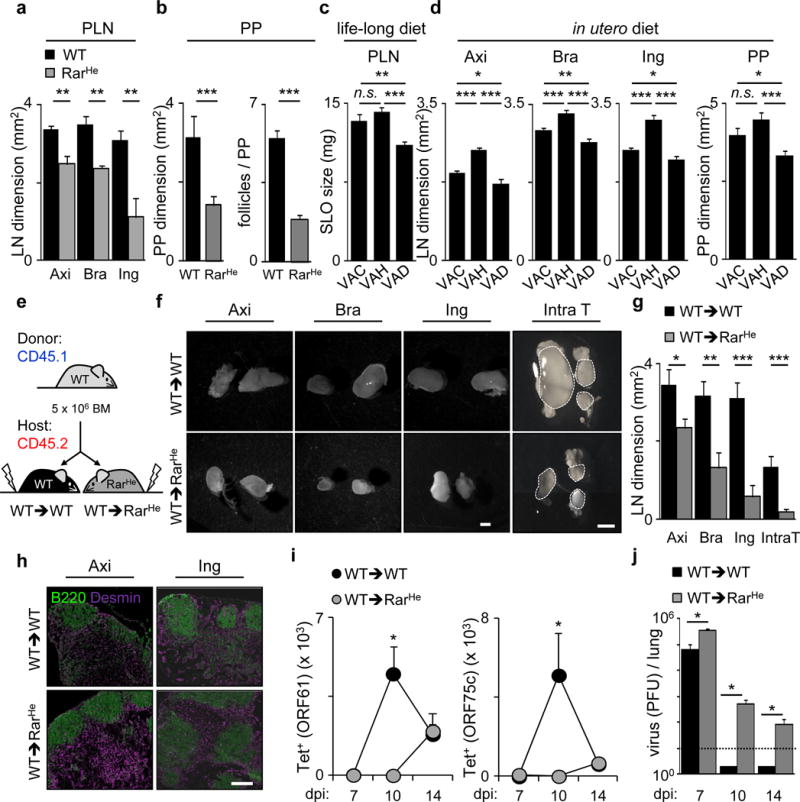
The impact of nutritional status during fetal life on the overall health of adults has been recognized; however, dietary effects on the developing immune system are largely unknown. Development of secondary lymphoid organs occurs during embryogenesis and is considered to be developmentally programmed. Secondary lymphoid organ formation depends on a subset of type 3 innate lymphoid cells (ILC3) named lymphoid tissue inducer (LTi) cells. Here we show that mouse fetal ILC3s are controlled by cell-autonomous retinoic acid (RA) signalling in utero, which pre-sets the immune fitness in adulthood. We found that embryonic lymphoid organs contain ILC progenitors that differentiate locally into mature LTi cells. Local LTi cell differentiation was controlled by maternal retinoid intake and fetal RA signalling acting in a haematopoietic cell-autonomous manner. RA controlled LTi cell maturation upstream of the transcription factor RORγt. Accordingly, enforced expression of Rorgt restored maturation of LTi cells with impaired RA signalling, whereas RA receptors directly regulated the Rorgt locus. Finally, we established that maternal levels of dietary retinoids control the size of secondary lymphoid organs and the efficiency of immune responses in the adult offspring. Our results reveal a molecular link between maternal nutrients and the formation of immune structures required for resistance to infection in the offspring.


Conflict of interest statement

Author information The authors declare no competing financial interests.

Figures

Extended Data Figure 1
Extended Data Figure 1. Foetal ILCs
a, ILC subsets in foetal gut and LNs. b, E15.5 intestines and LN cells were purified from Id2GFP and WT mice. Id2GFP and RORγt expression are shown in ILC4neg (CD3IL7Rα+α4β7+ID2+c-Kit+CD11cCD4) and LTi4 (CD3IL7Rα+α4β7+ID2+c-Kit+CD11cRORγt+CD4+) cells. c, E13.5 and E14.5 Ly6A-GFP anlagen LN were stained with GFP, IL7Rα and Ki67 antibodies and analysed by confocal microscopy. d, E14.5 Rorgt−/− mesenteric LNs were stained with podoplanin, IL7Rα and CD45 antibodies and analysed by confocal microscopy. e, Percentage of E16.5 ILC4neg and LTi4 cells gated in CD45+CD3CD11c determined by flow cytometry in Rorgt+/+ and Rorgt−/− intestines. Data are representative of three independent experiments. f, Left: Pregnant mice received RAR antagonist BMS493 or the vehicle DMSO from E10.5 until E13.5. The ratio LTi4/ILC4neg cells in the foetal liver was determined at E13.5; n=8. Right: Pregnant mice received BMS493 or the vehicle DMSO. Frequency of colonising haematopoietic cells was determined in E17.5 intestines by flow cytometry; n=4. g, Pregnant hCD2-GFP mice were administered BMS493 or DMSO from E10.5 until E13.5. Embryos were analysed at E17.5; n=13. Arrowheads show anlagen LNs. Scale bars: 50μm (c,d); 500μm (g). Error bars show s.e.. Two tailed t-test p values are indicated. *P<0.05; **P<0.01; ***P<0.001. n.s., not significant.
Extended Data Figure 2
Extended Data Figure 2. Analysis of haematopoietic cell Cre mouse lines
a, Vav-iCre and hCD2-Cre mice were crossed with ROSA26-Tomato-mGFP mice. Rorgt-Cre and Id2-CreERT2 mice were crossed with ROSA26-eYFP mice. E15.5 intestines were analysed by flow cytometry. Left: Results show the percentage of mGFP or eYFP positive cells in gut cell suspensions. Right: Percentage of mGFP or eYFP positive cells in non-haematopoietic (CD45), haematopoietic (CD45+), LTi and LTin cells. Results are representative of three independent experiments. b, Percentage of enteric E15.5 pre-LTi and LTi4 cells determined by flow cytometry in WT, Rorgt-Cre RarHet and Rorgt-Cre RarHom littermates. c, Frequencies of enteric ILC4neg and LTi4 cells in WT, Rorgt-Cre RarHet and Rorgt-Cre RarHom littermates. WT n=5; Rorgt-Cre RarHet n= 5; Rorgt-Cre RarHom n=4. d, PP area at 6–7 weeks of age. WT n=3; Rorgt-Cre RarHet n= 4. Two tailed t-test p values are indicated. *P<0.05; **P<0.01; ***P<0.001. n.s., not significant.
Extended Data Figure 3
Extended Data Figure 3. Analysis of Vav-iCre/ROSA26-RARα403 mice
a, E15.5 intestines from WT, Vav-iCre RarHet and RarHom mice were analysed by flow cytometry. Representative analysis of six independent experiments is shown. b, E15.5 regions of cervical, brachial and inguinal LN from WT, Vav-iCre RarHet and RarHom mice were analysed by flow cytometry. Representative analysis of two independent experiments. c, LTin cell percentage and LTi4/ILC4neg cell ratios are shown in E15.5 LNs; n=4. d, E15.5 foetal livers from WT and Vav-iCre RarHet mice were analysed by flow cytometry. Results show number of CD45+Lin (n=4) and CD45LinIL7Rα+α4β7+ progenitors (n=3). e, Percentage of CD45+CD3CD11cIL7Rα+RORγt+CD4 (RORγt+CD4) and CD45+CD3CD11cIL7Rα+RORγt+CD4+ (RORγt+CD4+) cells determined by flow cytometry in RARHet and WT littermate controls in E15.5 guts and LNs. f, Frequencies of RORγt+CD4 and RORγt+CD4+ cells in mice described in (e) WT n=9; RarHet n=3. g, ILC4neg cells were purified from E15.5 WT intestines by flow cytometry and cultured for 6 days. LTi4 cells raised in vitro were purified by flow cytometry and quantitative RT-PCR analysis performed. Results show Log2 fold increase in comparison to their cultured ILC4neg cell counterparts. Results were normalised to Hprt1 and Gapdh. h. Left: E15.5 embryos were whole mount stained for CD4 (red) and imaged by confocal microscopy. Cervical (Cer) LNs are shown. Right: Cervical LN dimensions are shown. WT n=5; RarHet n=7; RarHom n=6. Scale bar: 50μm. Two tailed t-test p values are indicated. *P<0.05; **P<0.01; ***P<0.001. n.s., not significant.
Extended Data Figure 4
Extended Data Figure 4. Gene expression patterns in ILC4neg and LTi4 cells
a, E15.5 intestines from RarHom and WT littermate controls were brought to suspension and analysed by flow cytometry. Upper panel: RORγt expression. Lower panel: mean fluorescence intensity of RORγt expression in ILC4neg cells; n=3. b, Pre-LTi cells were purified from E15.5 RarHet and WT littermate control intestines and lymph nodes. Quantitative RT-PCR analysis was performed. Results show Log2 fold increase to WT. Results were normalised to Hprt1 and Gapdh. Results from three independent measurements are shown. c,d, LTi4 cells were purified from E15.5 RarHet (c), RarHom (d) and WT littermate control intestines and lymph nodes. Quantitative RT-PCR analysis was performed. Results show Log2 fold increase to WT. Results were normalised to Hprt1 and Gapdh. Data from three independent measurements are shown. Two tailed t-test p values are indicated. *P<0.05; **P<0.01; ***P<0.001. n.s., not significant.
Extended Data Figure 5
Extended Data Figure 5. Treatment of ILC4neg and LTi4 cells with digoxin
a, WT ILC4neg cell were FACS purified starved overnight and stimulated with DMSO, BMS493 (100nM), RA (100nM) and RA+BMS493 (100nM each) for 16 hours. Results show quantitative RT-PCR analysis normalised to Gapdh; n=3. b, E13.5 LN cell suspensions were cultured with vehicle (ethanol), digoxin, digoxin+RA and RA alone for 24H. Alive/dead cell ratios were determined by flow cytometry and DAPI staining; n=4. c, ILC4neg cells were isolated from WT E15.5 embryos starved overnight and stimulated for 6 hours in the presence of RA (100nM) or DIG (10μM) + RA (100nM). Results show quantitative RT-PCR analysis of Rorgt and RORγt downstream targets normalised to Gapdh. Representative of three independent experiments. Error bars show s.e.. Two tailed t-test p values are indicated. *P<0.05; **P<0.01; ***P<0.001. n.s., not significant.
Extended Data Figure 6
Extended Data Figure 6. Analysis of SLOs from adult mice with variable RA signalling levels
a, Axillary (Axi), brachial (Bra) and inguinal (Ing) LNs from adult RarHet and WT littermate controls were analysed. Results show LN cell numbers; n=6. b, Results show PP number per intestine from adult RarHet and WT littermate controls; n=6. c. Six-week old WT females received VAC, VAH or VAD (n=3) diet for 7 weeks. Axillary (Axi), brachial (Bra), inguinal (Ing), intrathoracic (IntraT) LNs and Peyer’s patches (PP) dimensions were analysed; n=3. d. Percentage of CD45+CD19+ B cells; CD4+ and CD8+ T cells in inguinal LNs; n=3. e,f, Two week-old CD45.2 RarHet and WT littermate controls were lethally irradiated and transplanted with WT CD45.1 bone marrow cells. Chimeric mice were analysed 8 weeks after reconstitution. e, Results show PP dimensions and follicle number/PP; n=6. f, Results show number of cells in axillary (Axi), brachial (Bra) inguinal (Ing) and intrathoracic (Intra T) LNs; n=6. Scale bar: 1mm. Error bars show s.e.. Two tailed t-test p values are indicated. *P<0.05; **P<0.01; ***P<0.001. n.s., not significant.
Extended Data Figure 7
Extended Data Figure 7. Analysis of WT→WT and WT→RarHet bone marrow chimeras
Two week-old CD45.2 RarHet and WT littermate controls were lethally irradiated and transplanted with WT CD45.1 bone marrow cells. Chimeric mice were analysed 8 weeks after reconstitution. a, Reconstitution of donor CD45.1 cells in WT→WT and WT→RarHet chimeras in the spleen (n=4). b, Reconstitution of donor CD45.1 CD4 and CD8 T cells in WT→WT and WT→RarHet chimeras in the spleen. WT→WT n=4; WT→RarHet n=11. c, Reconstitution of donor CD45.1 CD11c+MHCII+ and CD11b+Gr1+ myeloid cells in WT→WT and WT→RarHet chimeras in the spleen; n=3. d, Reconstitution of donor CD45.1 CD11c+MHCII+ and CD11b+Gr1+ cells in WT→WT and WT→RarHet chimeras in intrathoracic LNs; n=3. e, Dendritic cells (DCs) were purified from WT→WT and WT→RarHet chimeras. DCs were loaded with OVA peptide (10−5 μM) and co-cultured for 3 days with CFSE-labelled monoclonal OT1 CD8 T cells. OT1 CD8 T cell proliferation was analysed by CFSE dilution. Proliferation index is shown. WT n=4; RarHet n=6. f, Dendritic cells (DCs) were purified from WT→WT and WT→RarHet chimeras. DCs were loaded with OVA peptide (10−5 μM) and co-cultured for 3 days with OT1 CD8 T cells. Percentage of IFNγ producing OT1 CD8 T cells is shown; n=4. Error bars show s.e.. Two tailed t-test p values are indicated. *P<0.05; **P<0.01; ***P<0.001. n.s., not significant.
Extended Data Figure 8
Extended Data Figure 8. Infection of WT→RarHet or WT→WT chimeras with Murid herpesvirus-4
a, Intrathoracic lymph node cellularity in WT→WT and WT→RarHet chimeras at different days post infection (dpi). WT n=5; RarHet n=3. b, Percentage of CD8+ORF61+ (left) and ORF75c+ (right) T cells in intrathoracic lymph nodes at different days post infection (dpi). WT n=5; RarHet n=3. c. Percentage of donor CD45.1 CD8+ORF61+ (left) and CD8+ORF75c+ (right) T cells in WT→WT and WT→RarHet chimeras after infection with Murid herpesvirus-4. WT n=6; RarHet n=12. Error bars show s.e.. Two tailed t-test p values are indicated. *P<0.05; **P<0.01; ***P<0.001. n.s., not significant.
Extended Data Figure 9
Extended Data Figure 9. Impact of maternal retinoids in ILC3s
Maternal dietary intake of vitamin A is catabolised into bioactive retinoic acid (RA). RA signals control type 3 innate lymphoid cells (ILC3) in the embryo. Foetal ILC3s include ILC4neg and LTi4 cells. LTi4 cells are Id2+RORγt+, while enteric ILC4neg cells contain a minor subset of Id2+RORγt cells (pre-ILCs). RA signalling operates in a cell-autonomous fashion, via direct regulation of Rorgt, programming innate pro-inflammatory cytokines and chemokines and differentiation of LTi4 cells.
Figure 1
Figure 1. Maternal RA controls LTi differentiation
a, Enteric foetal ILC4neg and LTi4 cells. b, E12.5 n=8; E13.5 n=3; E14.5 n=6; E15.5 n=3. c, Left: Sca1-GFP LNs. Right: E15.5 gut cells. d,e, Cultured or transplanted E12.5 guts. d, d0 n=4; d1 n=6; d2 n=6. e, d0 n=7; d1 n=3; d2 n=5. f, Left: E13.5 LN cells; n=7. Centre: RA was provided to females. E13.5 LN cells; n=8. Right: Females received BMS493; n=8. g–i, hCD2-GFP females received BMS493. E17.5 SLOs. g, Brachial and inguinal LNs; n=6. h, Arrowheads: PP. i, Dimensions; DMSO n=8; BMS n=22. Area; DMSO n=30; BMS n=25. Scale bar: 50μm (c), 200μm (g, h right), 1mm (h left). Error bars show s.e.. *P<0.05; **P<0.01; ***P<0.001.
Figure 2
Figure 2. Cell-autonomous RA controls LTi cells and SLO development
a, RT-PCR of enteric cells. Represents 3 independent experiments. b, DMSO, BMS493 or RA stimulation. Represents 3 independent experiments. c, E15.5. enteric ILC subsets. d, LTin n=4. ILC4neg n=5. LTi4 n=5. e, E15.5 ILC4neg cells cultured for 6 days. f, ILC4neg cell cultures at day 6; n=5. g, E15.5. CD4 (red); VCAM1 (grey). Scale bars: 200μm. h, SLO size; n=6. Error bars show s.e.. *P<0.05; **P<0.01; ***P<0.001.
Figure 3
Figure 3. RA controls LTi cells via RORγt
a, E15.5 ILC4neg cells. Represents 3 experiments. b, E15.5 ILC4neg cells stimulated with RA. Represents 3 experiments. c, E13.5 LN cells stimulated with RA and digoxin; n=16. d-f, ILC4neg cells transduced with pMig.Rorgt-IRES-GFP virus (day 6). d, Represents 3 experiments. e, Cytometry analysis. f, Emergent LTi4 cells. WT n=5; RarHo n=3. g, RARE sites. h, E15.5 ILC4neg cells stimulated with RA. ChIP analysis of 5 biological replicates. i, Luciferase activity of RARE WT and mutated sites. C n=6; E n=9; G n=6. Error bars show s.e.. *P<0.05; **P<0.01; ***P<0.001. n.d.: not detected.
Figure 4
Figure 4. Retinoid levels in utero determine the offspring immunity
a, Adult axillary, brachial and inguinal LNs. n=6. b, WT n=26; RarHe n=23. c, Females received diets that were maintained in the offspring. VAC n=10; VAH n=8; VAD n=18. d, Females received variable diets. Their offspring received VAC diet. LN: VAC n=18; VAH n=24; VAD n=25. PP: VAC n=20; VAH n=40; VAD n=63. e, Transplantation scheme. f, Chimeric LNs. Scale bar: 1mm. g, Chimeric LNs. n=6. h, Chimeric LNs. Scale bar: 200μm. i, Chimeras infected with Murid herpesvirus-4. Tetramer positive CD8 T cells in intrathoracic LNs. j, Virus titers (PFU/lung). dpi7: WT→WT n=3; WT→RarHet n=3. dpi10: WT→WT n=4; WT→RarHet n=3. dpi14: WT→WT n=8; WT→RarHet n=5. Dash line: detection limit. Error bars show s.e.. *P<0.05; **P<0.01; ***P<0.001.

Comment in

  • Immunology: A is for immunity.
    Eberl G. Eberl G. Nature. 2014 Apr 3;508(7494):47-8. doi: 10.1038/nature13216. Epub 2014 Mar 19. Nature. 2014. PMID: 24670655 No abstract available.
  • Development: we are what mum eats!
    Bird L. Bird L. Nat Rev Immunol. 2014 May;14(5):284-5. doi: 10.1038/nri3672. Epub 2014 Apr 22. Nat Rev Immunol. 2014. PMID: 24751954 No abstract available.

References

    1. Gluckman PD, Hanson MA. Living with the past: evolution, development, and patterns of disease. Science. 2004;305:1733–1736. - PubMed
    1. van de Pavert SA, Mebius RE. New insights into the development of lymphoid tissues. Nat Rev Immunol. 2010;10:664–674. - PubMed
    1. Randall TD, Carragher DM, Rangel-Moreno J. Development of secondary lymphoid organs. Annu Rev Immunol. 2008;26:627–650. - PMC - PubMed
    1. Mebius RE, Rennert P, Weissman IL. Developing lymph nodes collect CD4+CD3- LTbeta+ cells that can differentiate to APC, NK cells, and follicular cells but not T or B cells. Immunity. 1997;7:493–504. - PubMed
    1. Eberl G, et al. An essential function for the nuclear receptor RORgamma(t) in the generation of fetal lymphoid tissue inducer cells. Nat Immunol. 2004;5:64–73. - PubMed

Publication types

MeSH terms