

Discovering pair-wise genetic interactions: an information theory-based approach
- PMID: 24670935
- PMCID: PMC3966778
- DOI: 10.1371/journal.pone.0092310
Discovering pair-wise genetic interactions: an information theory-based approach
Abstract
Phenotypic variation, including that which underlies health and disease in humans, results in part from multiple interactions among both genetic variation and environmental factors. While diseases or phenotypes caused by single gene variants can be identified by established association methods and family-based approaches, complex phenotypic traits resulting from multi-gene interactions remain very difficult to characterize. Here we describe a new method based on information theory, and demonstrate how it improves on previous approaches to identifying genetic interactions, including both synthetic and modifier kinds of interactions. We apply our measure, called interaction distance, to previously analyzed data sets of yeast sporulation efficiency, lipid related mouse data and several human disease models to characterize the method. We show how the interaction distance can reveal novel gene interaction candidates in experimental and simulated data sets, and outperforms other measures in several circumstances. The method also allows us to optimize case/control sample composition for clinical studies.
Conflict of interest statement
Figures
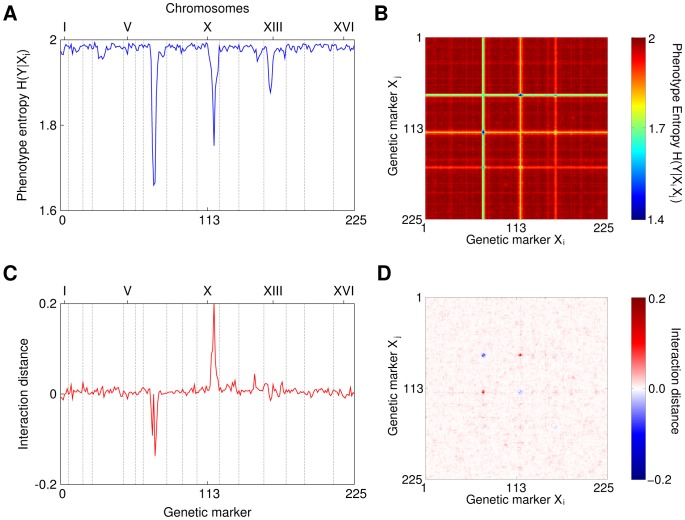
 . B) A heat map of conditional entropy
  of the phenotype given two markers. Notice stripes caused by the markers with strongest single effects that make detection of pairs with small effect difficult, especially for a large number of markers. C) Interaction distance between marker 7.9, which is the marker with the strongest marginal effect, and every other marker. The “negative peak” shows that neighborhood markers contain redundant information. Most values fluctuates around zero since they do not interact with 7.9. D) A heat map of interaction distance for all pairs of markers and the phenotype,
  . Note that there are no stripes anymore.
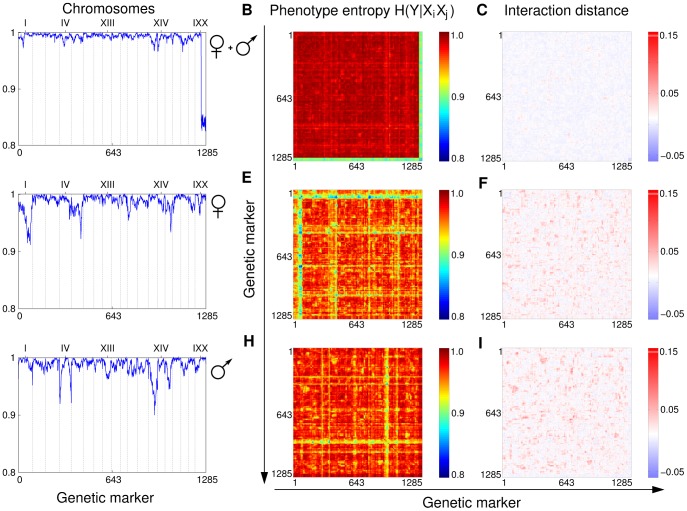
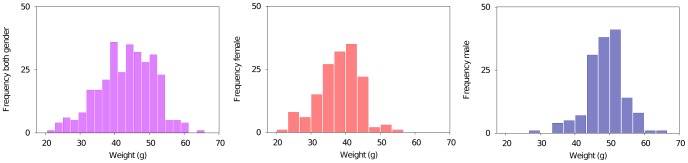
 , (B) shows
  and (C) shows the interaction distance. The strongest effect on the phenotype in this case comes from markers located on the Y chromosome present only in males. This is expected since the weight is strongly correlated with the sex. Rows (D–F) and (G–I) show data for female and male subpopulations respectively. A comparison of (D) and (G) reveals sex specific QTLs affecting the phenotype. Panels (B), (E) and (H) exhibit the characteristic stripe pattern, which masks the more subtle synthetic and modifying interactions. Finally, (C), (F) and (I) plot the ID scores for all pairs of markers. The red spots in panels (C, F, I) and blue/yellow spots in panels (B, E, H) point out potentially interesting pairs, which are a subject of further investigation.
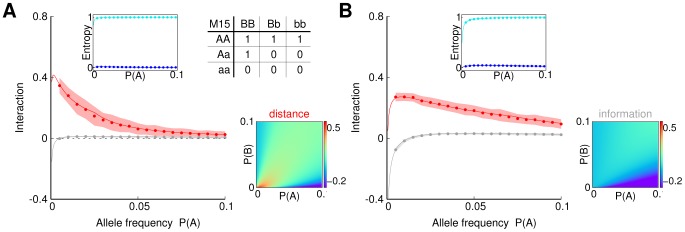
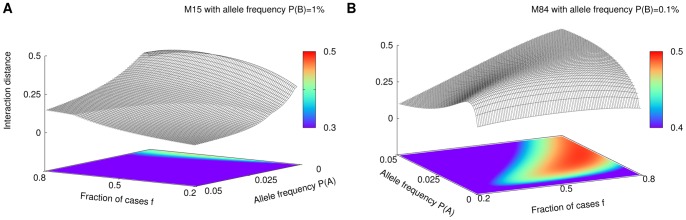
 = 1% in panel (A) and 2.5% in panel (B) Lower sub-panels show the effect of changing the value of
  . More precisely, the lower sub-panel on the left shows expected values of the interaction distance, and on the right – of the interaction information as functions of different values of
  and
and  .
.
References
-
- Drees BL, Thorsson V, Carter GW, Rives AW, Raymond MZ, et al. (2005) Derivation of genetic interaction networks from quantitative phenotype data. Genome Biol 6: R38. Available: http://genomebiology.com/2005/6/4/R38. Accessed 19 July 2013. - PMC - PubMed
-
- Carter GW, Prinz S, Neou C, Shelby JP, Marzolf B, et al. (2007) Prediction of phenotype and gene expression for combinations of mutations. Mol Syst Biol 3: 96. Available: http://onlinelibrary.wiley.com/doi/10.1038/msb4100137/full. Accessed 19 July 2013. - DOI - PMC - PubMed
-
- Carter GW, Dudley AM (2011) Systems Genetics and Complex Traits. In: Meyers RA, editor. Encyclopedia of Complexity and Systems Science. Springer. 9105–9124.
Publication types
MeSH terms
Substances
LinkOut - more resources
Full Text Sources
Other Literature Sources
Molecular Biology Databases
