

Foraging responses of black-legged kittiwakes to prolonged food-shortages around colonies on the Bering Sea shelf
- PMID: 24671108
- PMCID: PMC3966792
- DOI: 10.1371/journal.pone.0092520
Foraging responses of black-legged kittiwakes to prolonged food-shortages around colonies on the Bering Sea shelf
Abstract
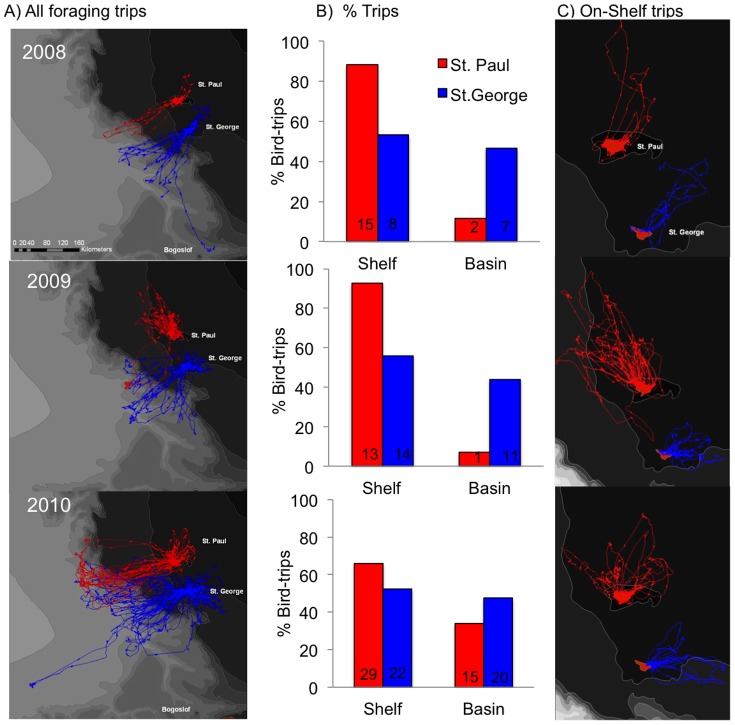
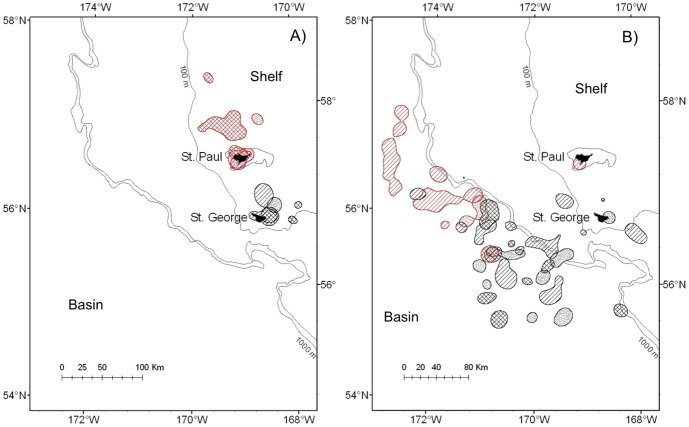
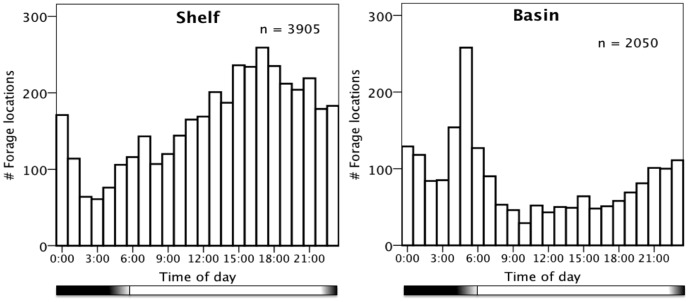
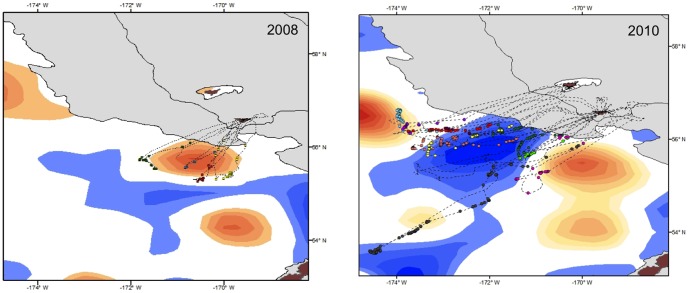
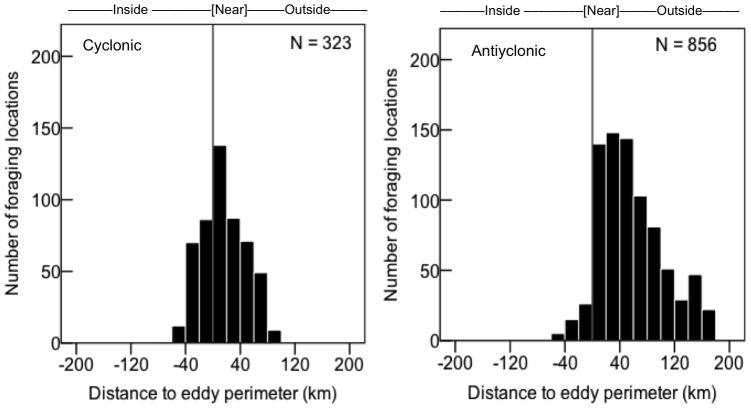
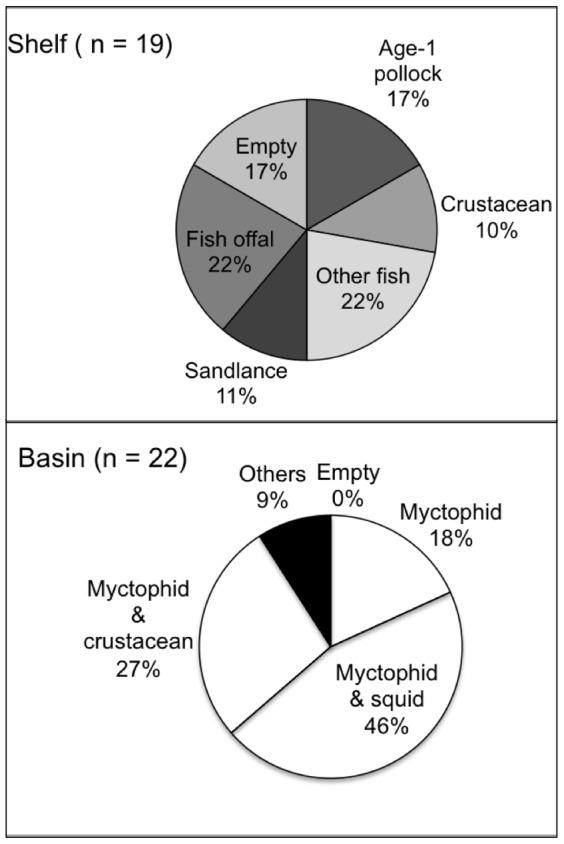
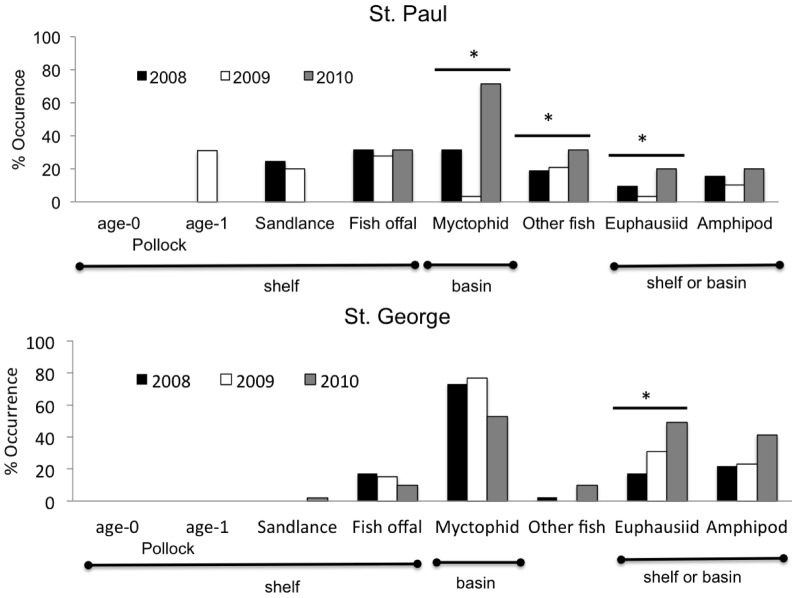
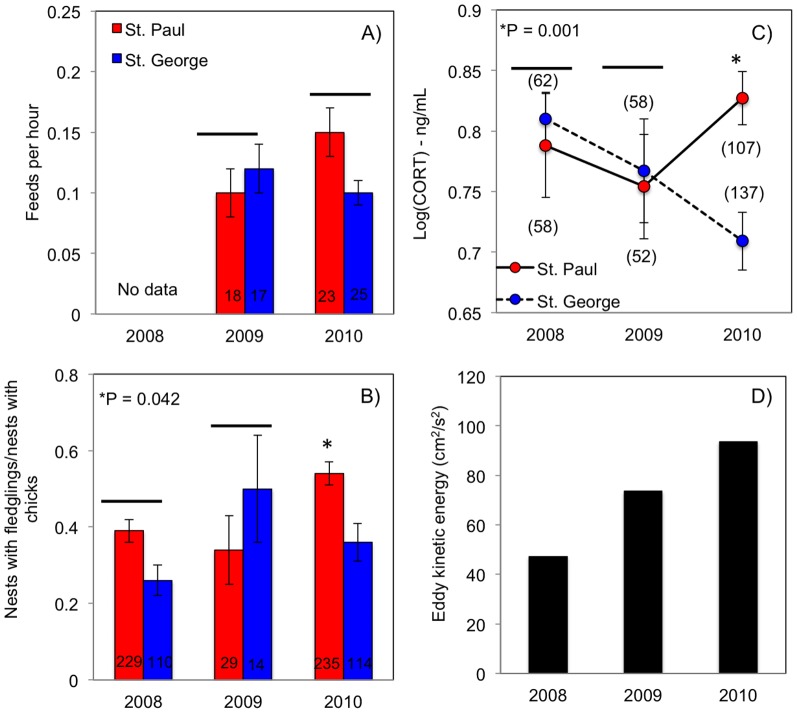
We hypothesized that changes in southeastern Bering Sea foraging conditions for black-legged kittiwakes (Rissa tridactyla) have caused shifts in habitat use with direct implications for population trends. To test this, we compared at-sea distribution, breeding performance, and nutritional stress of kittiwakes in three years (2008-2010) at two sites in the Pribilof Islands, where the population has either declined (St. Paul) or remained stable (St. George). Foraging conditions were assessed from changes in (1) bird diets, (2) the biomass and distribution of juvenile pollock (Theragra chalcogramma) in 2008 and 2009, and (3) eddy kinetic energy (EKE; considered to be a proxy for oceanic prey availability). In years when biomass of juvenile pollock was low and patchily distributed in shelf regions, kittiwake diets included little or no neritic prey and a much higher occurrence of oceanic prey (e.g. myctophids). Birds from both islands foraged on the nearby shelves, or made substantially longer-distance trips overnight to the basin. Here, feeding was more nocturnal and crepuscular than on the shelf, and often occurred near anticyclonic, or inside cyclonic eddies. As expected from colony location, birds from St. Paul used neritic waters more frequently, whereas birds from St. George typically foraged in oceanic waters. Despite these distinctive foraging patterns, there were no significant differences between colonies in chick feeding rates or fledging success. High EKE in 2010 coincided with a 63% increase in use of the basin by birds from St. Paul compared with 2008 when EKE was low. Nonetheless, adult nutritional stress, which was relatively high across years at both colonies, peaked in birds from St. Paul in 2010. Diminishing food resources in nearby shelf habitats may have contributed to kittiwake population declines at St Paul, possibly driven by increased adult mortality or breeding desertion due to high foraging effort and nutritional stress.
Conflict of interest statement
Figures

References
-
- Ainley DA, Ford RG, Brown ED, Suryan RM, Irons DB (2003) Prey resources, competition, and geographic structure of kittiwake colonies in Prince William Sound. Ecology 84: 709–723.
-
- Ashmole NP (1963) The regulation of numbers of tropical oceanic birds. Ibis 103: 458–473.
-
- Atwood E, Duffy-Anderson JT, Horne JK, Ladd C (2010) Influence of mesoscale eddies on ichthyoplankton assemblages in the Gulf of Alaska. Fish Oceanogr 19: 493–507.
-
- Beamish RJ, Leask KD, Ivanov OA, Balanov AA, Orlov AM, et al. (1999) The ecology, distribution, and abundance of midwater fishes of the Subarctic Pacific gyres. Prog Oceanogr 43: 399–442.
-
- Benoit-Bird KJ, Kuletz K, Heppell S, Jones N, Hoover B (2011) Active acoustic examination of the diving behavior of murres foraging on patch prey. Mar Ecol Prog Ser 443: 217–235.
Publication types
MeSH terms
LinkOut - more resources
Full Text Sources
Other Literature Sources
Research Materials
