. 2014 Mar 26;9(3):e93103.
doi: 10.1371/journal.pone.0093103. eCollection 2014.

A novel oncolytic herpes simplex virus type 2 has potent anti-tumor activity

Affiliations

A novel oncolytic herpes simplex virus type 2 has potent anti-tumor activity

Qian Zhao et al. PLoS One. .

Abstract

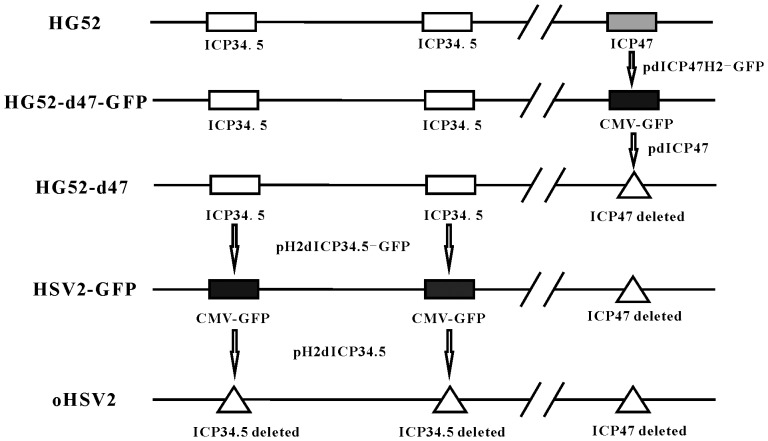
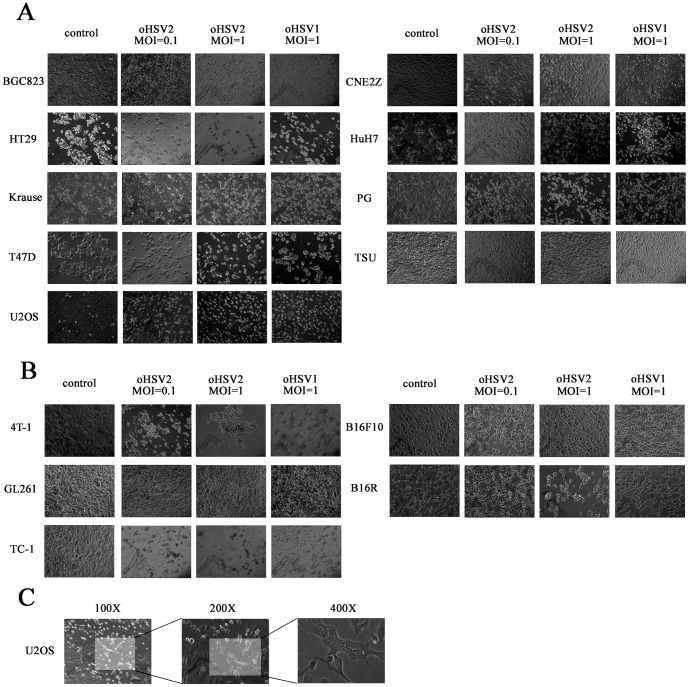
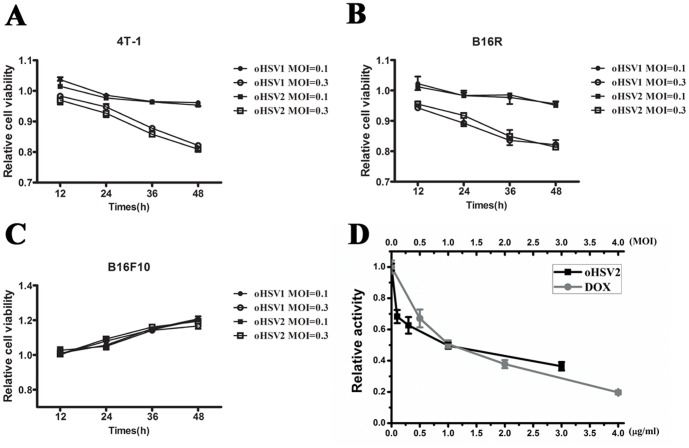
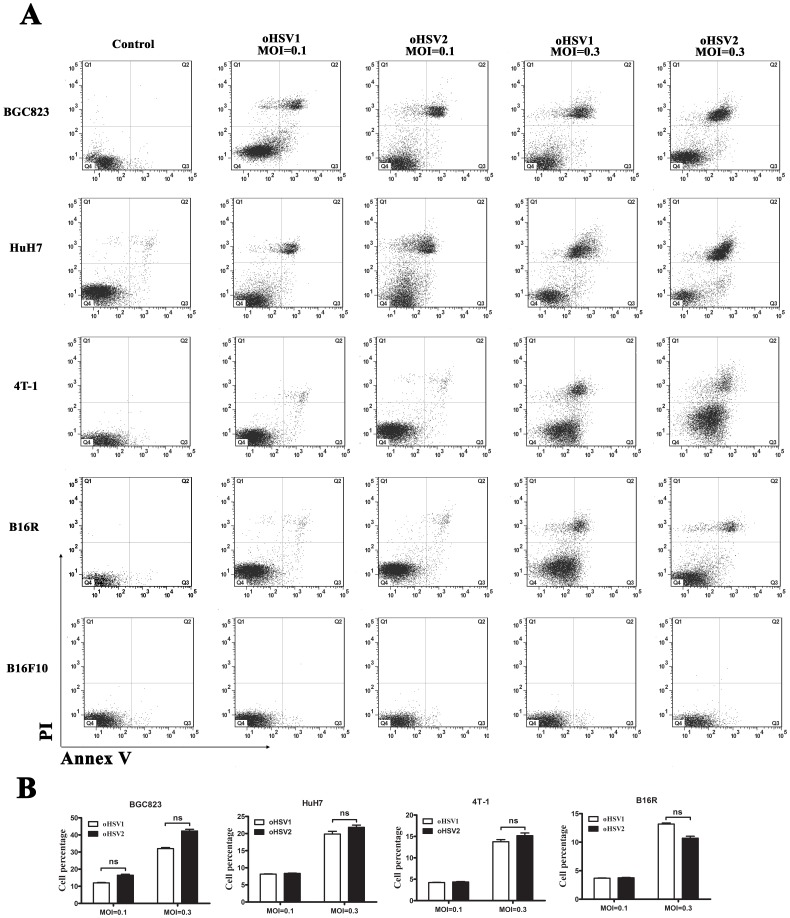
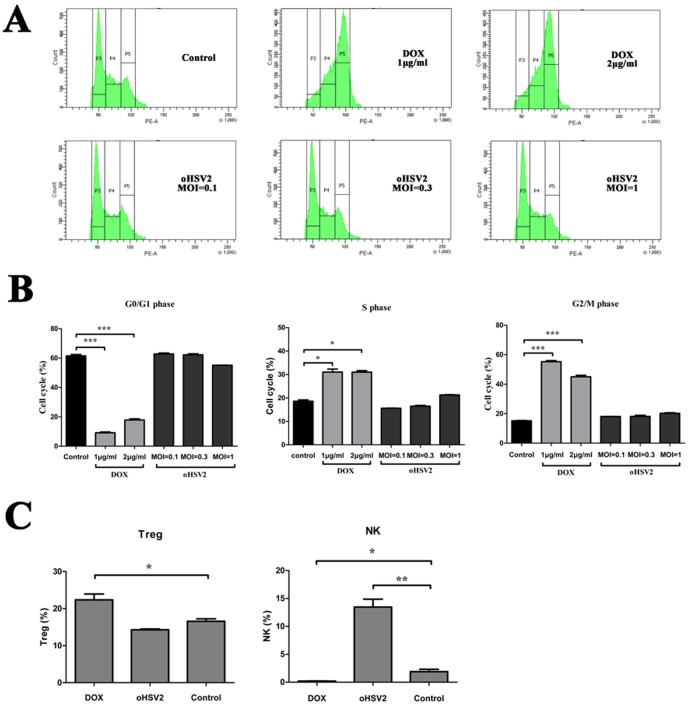
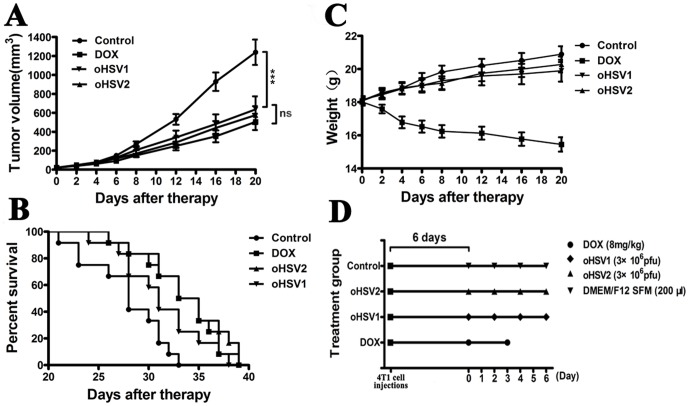
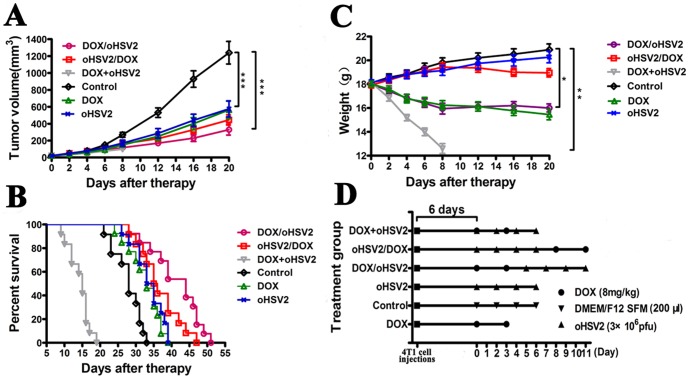
Oncolytic viruses are promising treatments for many kinds of solid tumors. In this study, we constructed a novel oncolytic herpes simplex virus type 2: oHSV2. We investigated the cytopathic effects of oHSV2 in vitro and tested its antitumor efficacy in a 4T1 breast cancer model. We compared its effect on the cell cycle and its immunologic impact with the traditional chemotherapeutic agent doxorubicin. In vitro data showed that oHSV2 infected most of the human and murine tumor cell lines and was highly oncolytic. oHSV2 infected and killed 4T1 tumor cells independent of their cell cycle phase, whereas doxorubicin mainly blocked cells that were in S and G2/M phase. In vivo study showed that both oHSV2 and doxorubicin had an antitumor effect, though the former was less toxic. oHSV2 treatment alone not only slowed down the growth of tumors without causing weight loss but also induced an elevation of NK cells and mild decrease of Tregs in spleen. In addition, combination therapy of doxorubicin followed by oHSV2 increased survival with weight loss than oHSV2 alone. The data showed that the oncolytic activity of oHSV2 was similar to oHSV1 in cell lines examined and in vivo. Therefore, we concluded that our virus is a safe and effective therapeutic agent for 4T1 breast cancer and that the sequential use of doxorubicin followed by oHSV2 could improve antitumor activity without enhancing doxorubicin's toxicity.


Conflict of interest statement

Competing Interests: The authors have declared that no competing interests exist.

Figures

Figure 1
Figure 1. Schematic of the construction of oncolytic HSV2-GFP and HSV2.
The two oncolytic HSV2 vectors were developed from the HG52 strain. Modifications include deletion of the ICP47 and ICP34.5 genes and insertion of a GFP expression cassette.
Figure 2
Figure 2. Oncolytic spectrum of oHSV2.
A) oHSV2 and oHSV1 were used to infect human tumor cells, including BGC823, HT29, Krause, T47D, U2OS, CNE2Z, HuH7, PG and TSU, at the indicated MOIs and times. B) oHSV2 and oHSV1 were used to infect mouse tumor cells, including 4T1, GL261, TC-1, B16F10 and B16R, at the indicated MOIs and times. A and B were observed with an inverted phase contrast microscope at 100× objective magnification. C) U2OS cells were infected by oHSV2 at MOI = 1, and typical syncytia were observed at 100×, 200× and 400× objective magnification.
Figure 3
Figure 3. The cell viability of cancer cells was examined.
A) The 4T-1 cells were treated with oHSV1 or oHSV2 at the indicated MOIs for the indicated times. B) The B16R cells were treated with oHSV1 or oHSV2 at the indicated MOIs for the indicated times. C) The B16F10 cells were treated with oHSV1 or oHSV2 at the indicated MOIs for the indicated times. D) The 4T-1 cells were treated with oHSV2 of different MOIs for 24h. DOX was used as a positive control. Each value represents the mean ± SED of three independent samples.
Figure 4
Figure 4. In vitro comparison of oHSV2 with oHSV1.
Both oHSV1 and oHSV2 induces necrosis in cancer cells. A) Flow cytometry analysis of cancer cell lines after oHSV2 or oHSV1 infection at the indicated MOIs for 24 h. B) The necrosis rates of the cancer cell lines were measured after oHSV2 or oHSV1 infection. Each value represents the mean ± SED of three independent samples. ns, no significant differences.
Figure 5
Figure 5. The oncolytic effect of oHSV2 on 4T1 tumor cells is independent of the cell cycle, but oHSV2 increases the NK ratio in vivo.
A) An cell cycle assay as described in the Methods section. Representative images of flow cytometry from the different groups are depicted. B) 4T1 cells were treated with oHSV2 or different doses of DOX for 24h. Cell cycle specificity analysis was performed using flow cytometry. C) The percentage of NK and Treg cells after oHSV2 or DOX treatment was assayed. Statistical analysis was performed using an unpaired Student’s t test: *, p<0.05; **, p<0.01; and ***, p<0.001.
Figure 6
Figure 6. Anticancer effect of DOX, oHSV1 and oHSV2 in 4T1 breast tumors.
The mice bearing 4T1 tumors were treated with DOX, oHSV1 or oHSV2 as described in the Materials and Methods section. A) The tumor volume was measured every 4 days following treatments. The data are presented as the mean ± SEM (n = 12), p<0.001. B) The median survival times for the 3 groups are illustrated in Kaplan–Meier survival curves (n = 12). Median survival: Control, 28 days; DOX, 34 days, p = 0.0034; oHSV2, 34 days, p = 0.0009; and oHSV1, 31 days, p = 0.0043. C) The weight of the mice was measured every 4 days following treatments. The data are presented as the mean ± SEM (n = 12). ***, p<0.001 and ns, no significant differences. D) Schematic of the experimental design. Each spot represents one treatment.
Figure 7
Figure 7. Anticancer effect of DOX coupled with oHSV2 in different treatment combinations in 4T1 breast tumors.
Mice bearing 4T1 tumors were treated as described in the Materials and Methods section. And the Control, oHSV2 and DOX groups were the same in Fig 6 and 7. A) The tumor volume of mice was measured every 4 days following treatments. The data are presented as the mean ± SEM (n = 12). B) The median survival times for the 3 groups are illustrated in Kaplan–Meier survival curves (n = 12). Median survival: DOX/oHSV2, 44 days, p<0.001; oHSV2/DOX, 35 days, p<0.001; and DOX+oHSV2, 15 days. C) The weight of mice was measured every 4 days following treatments. The data are presented as the mean ± SEM (n = 12), *, p<0.05; **, p<0.01; and ***, p<0.001. D) Schematic of the experimental design. Each spot represents one treatment.

Similar articles

Cited by

References

    1. Chernajovsky Y, Layward L, Lemoine N (2006) Fighting cancer with oncolytic viruses. BMJ 332(7534): 170–2 10.1136/bmj.332.7534.170 - DOI - PMC - PubMed
    1. Toda M, Rabkin SD, Kojima H, Martuza RL (1999) Herpes simplex virus as an in situ cancer vaccine for the induction of specific anti-tumor immunity. Hum Gene Ther 10: 385–93 10.1089/10430349950018832 - DOI - PubMed
    1. Davydova J, Gavrikova T, Brown EJ, Luo X, Curiel DT, et al. (2010) In vivo bioimaging tracks conditionally replicative adenoviral replication and provides an early indication of viral antitumor efficacy. Cancer Sci 101(2): 474–81 10.1111/j.1349-7006.2009.01407.x - DOI - PMC - PubMed
    1. Jennings VA, Ilett EJ, Scott KJ, West EJ, Vile R, et al. (2014) Lymphokine-activated killer and dendritic cell carriage enhances oncolytic reovirus therapy for ovarian cancer by overcoming antibody neutralization in ascites. Int J Cancer 134(5): 1091–101 10.1002/ijc.28450 - DOI - PMC - PubMed
    1. Huszthy PC, Immervoll H, Wang J, Goplen D, Miletic H, et al. (2010) Cellular effects of oncolytic viral therapy on the glioblastoma microenviroment. Gene Ther 17: 202–16 10.1038/gt.2009.130 - DOI - PubMed

Publication types