. 2014 Mar 26;9(3):e93009.
doi: 10.1371/journal.pone.0093009. eCollection 2014.

Gene and protein expression in response to different growth temperatures and oxygen availability in Burkholderia thailandensis

Affiliations

Gene and protein expression in response to different growth temperatures and oxygen availability in Burkholderia thailandensis

Clelia Peano et al. PLoS One. .

Abstract

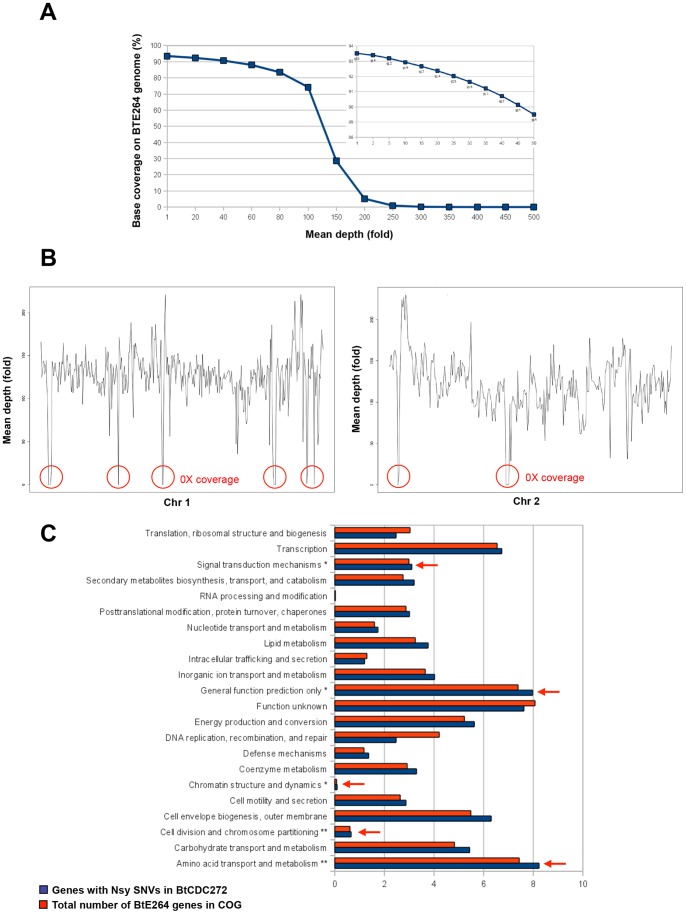
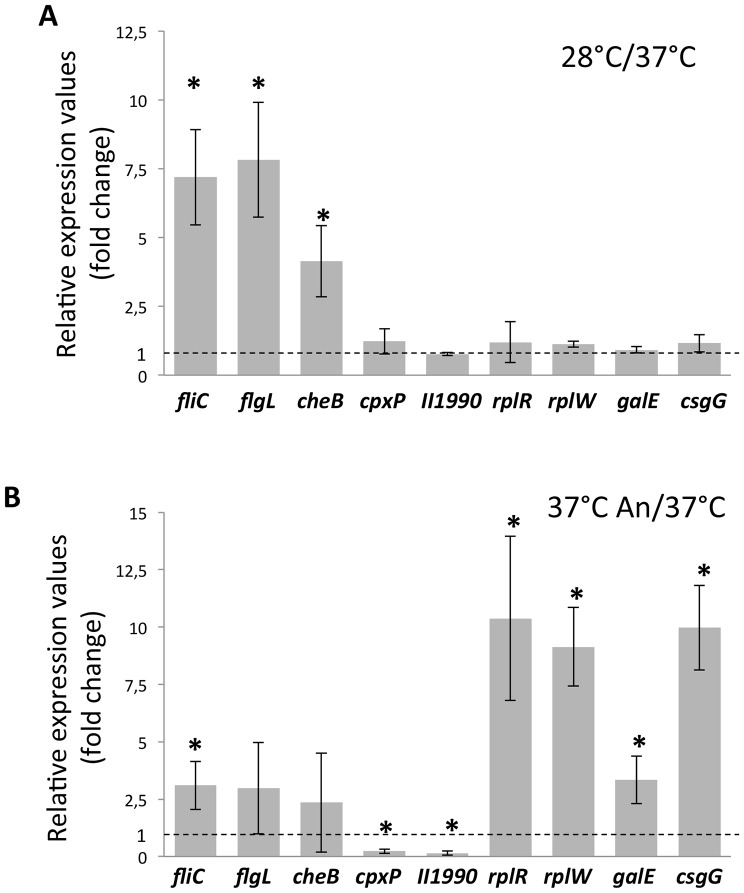
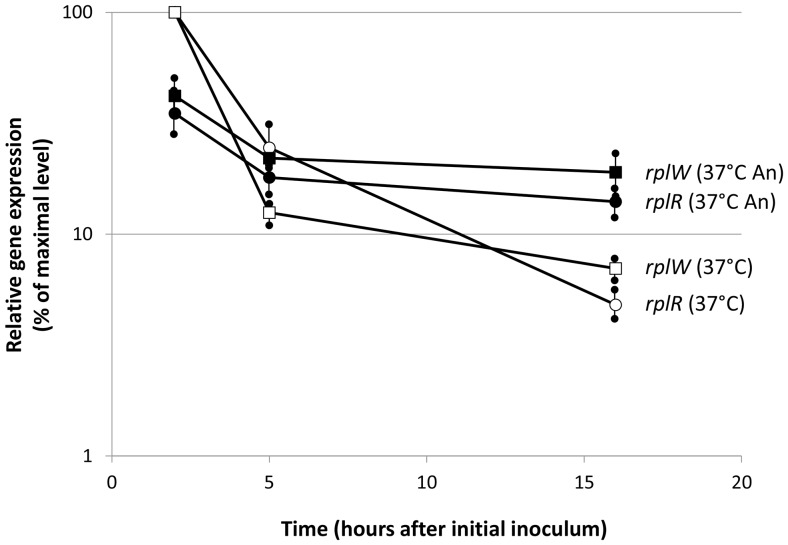
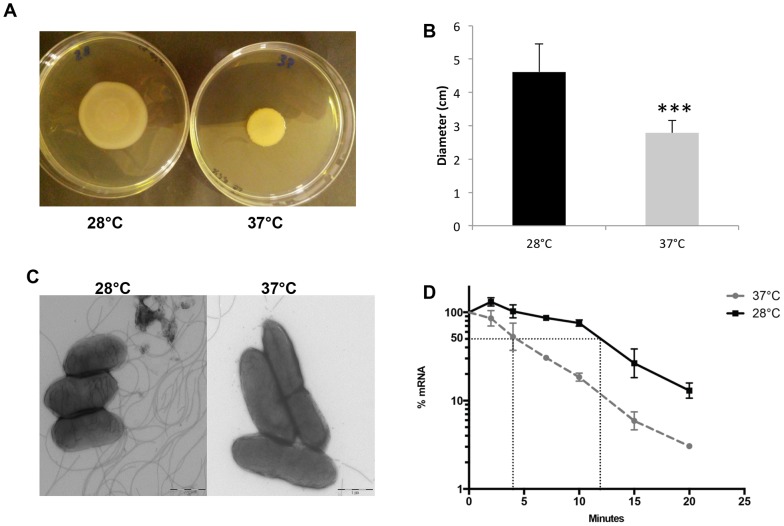
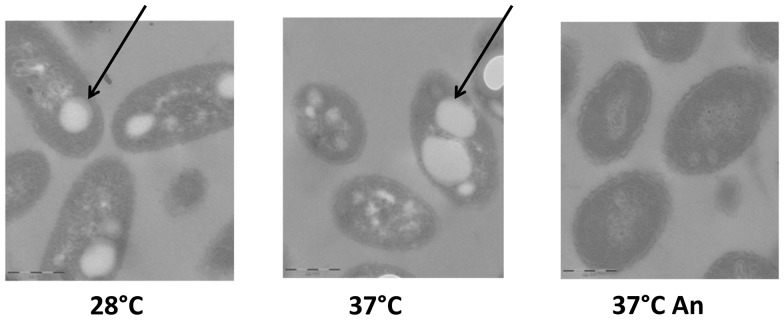
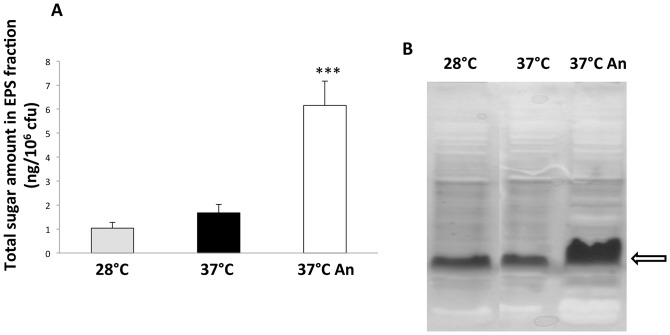
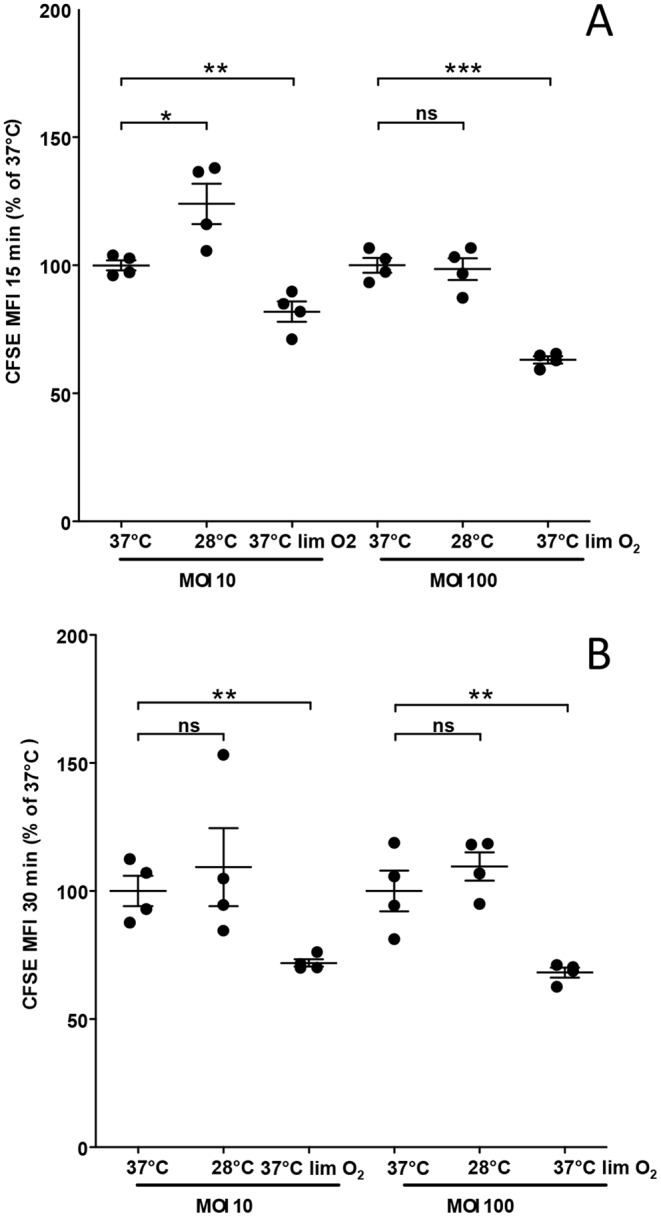
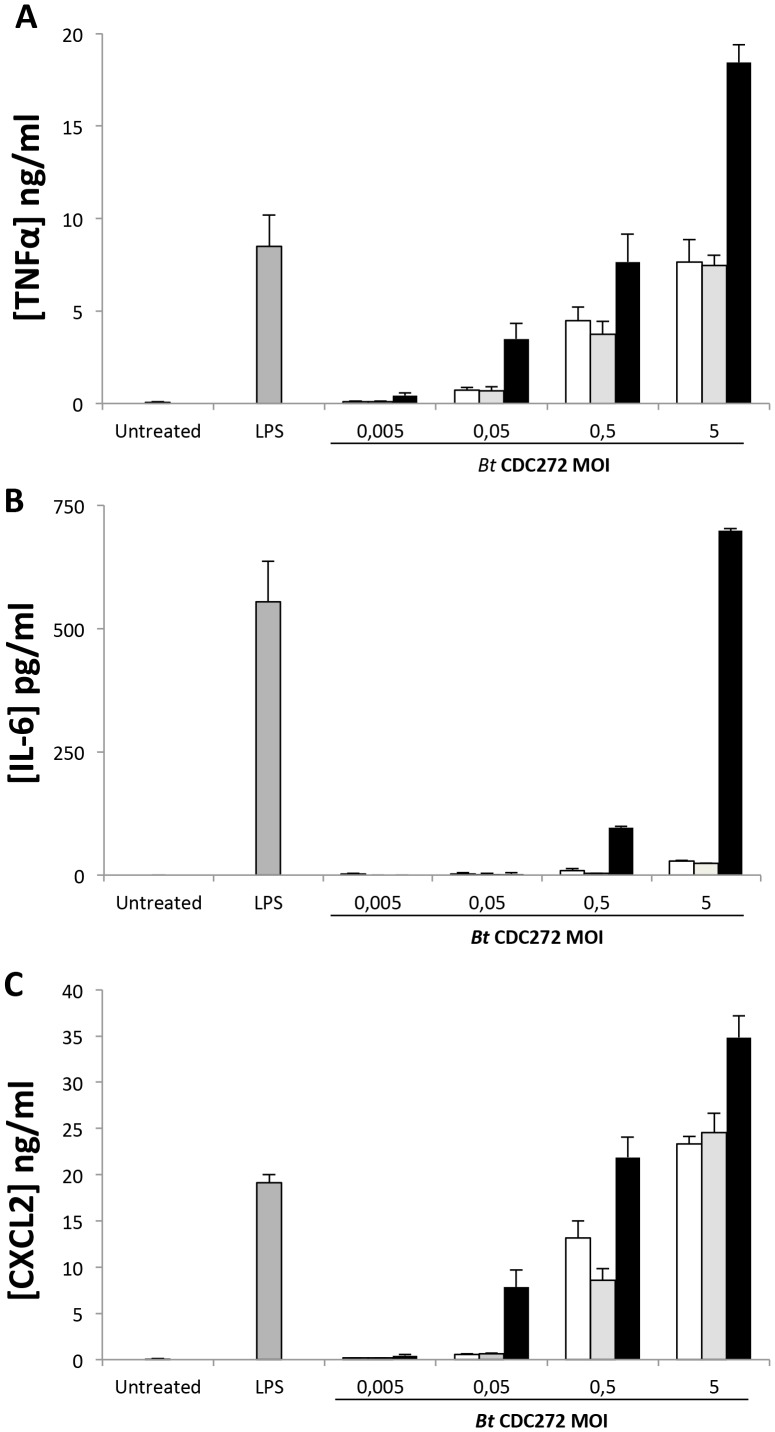
Burkholderia thailandensis, although normally avirulent for mammals, can infect macrophages in vitro and has occasionally been reported to cause pneumonia in humans. It is therefore used as a model organism for the human pathogen B. pseudomallei, to which it is closely related phylogenetically. We characterized the B. thailandensis clinical isolate CDC2721121 (BtCDC272) at the genome level and studied its response to environmental cues associated with human host colonization, namely, temperature and oxygen limitation. Effects of the different growth conditions on BtCDC272 were studied through whole genome transcription studies and analysis of proteins associated with the bacterial cell surface. We found that growth at 37°C, compared to 28°C, negatively affected cell motility and flagella production through a mechanism involving regulation of the flagellin-encoding fliC gene at the mRNA stability level. Growth in oxygen-limiting conditions, in contrast, stimulated various processes linked to virulence, such as lipopolysaccharide production and expression of genes encoding protein secretion systems. Consistent with these observations, BtCDC272 grown in oxygen limitation was more resistant to phagocytosis and strongly induced the production of inflammatory cytokines from murine macrophages. Our results suggest that, while temperature sensing is important for regulation of B. thailandensis cell motility, oxygen limitation has a deeper impact on its physiology and constitutes a crucial environmental signal for the production of virulence factors.


Conflict of interest statement

Competing Interests: The authors have declared that no competing interests exist.

Figures

Figure 1
Figure 1. Genome sequencing of B. thailandensis BtCDC272.
(a) Reference genome coverage. BtCDC272 reads were aligned against the BtE264 reference. Y-axis: percentage nucleotide coverage of the BtE264 genome. X-axis: number of reads covering each nucleotide. The inset graph indicates range from 1 to 50X coverage; ca. 90% of the BtE264 genome was sequenced with a 50X read depth. (b) Sequence coverage gaps in BtE264 are associated with GIs and nGis. Shown are coverage maps of BtE264 chromosome 1 (left) and chromosome 2 (right). Graph: median fold-coverage of BtCDC272 sequence reads using a 10-kb moving window. Red circles evidence the regions with a median 0X coverage within the entire 10 Kb moving window. The x-axis shows the BtE264 genome co-ordinates (bp). (c) Functional enrichment of Bt genes with nonsynonymous SNPs (Nsy SNPs). COG functional categories are indicated on the y-axis, and the percentage of genes in each COG category is shown on the x-axis. Dark blue columns represent BtCDC272 genes with Nsy SNPs relative to BtE264, and red columns indicate all BtE264 genes with COG annotations. COG categories exhibiting a significant enrichment of genes with Nsy SNPs are highlighted by asterisks (*P<0.05 or **P<0.01, binomial test; after Bonferroni correction).
Figure 2
Figure 2. Validation of RNAseq results by qRT-PCR experiments.
Genes tested are indicated in the graph; “II1990” refers to the BTH_II1990 gene. ΔCt between the gene of interest and the 16S gene was arbitrarily set at 1 (dashed line) for expression levels in BtCDC272 grown at 37°C in aerobic conditions, to which expression levels at either 28°C (Panel A) or at 37°C in anoxic conditions (Panel B) were compared. The Relative expression values indicated in the graph are the average of at least four experiments (two repeats, each performed on duplicate samples, from two independent RNA extractions), and standard deviations are shown. The asterisks denote significant differences relative to BtCDC272 grown at 37°C in aerobic conditions (p<0.05; Tukey multigroup analysis).
Figure 3
Figure 3. Time-course expression of ribosomal protein-encoding genes in different growth conditions.
Samples were taken at 2, 5 and 16 hours from the initial inoculum at OD600 = 0.1 (see Figure S1A for comparison) and relative amounts of rplR (circles) and rplW (squares) transcripts were determined by qRT-PCR in cultures grown either aerobically (open symbols) and in oxygen limitation (closed symbols). Maximal gene expression corresponded to ΔCt values for rplR = 6.8 and for rplW = 5.5 and was set to 100%. qRT-PCR was repeated three times (with replicate samples for each experiment) on RNA obtained from a single extraction. Standard deviations are shown.
Figure 4
Figure 4. Temperature-dependence of cellular motility and fliC gene regulation.
Motility assays on LB soft 0.4% agar plates as from a typical experiment (A) and quantitative estimate from an average of six independent experiments (B). Statistical analysis (two-tailed Student’s t test) of the results provided a p value<0.0001 (indicated by the three asterisks in the figure). C: TEM observation of cells from BtCDC272 overnight cultures grown either at 28°C or 37°C. The 1 μm scale bar is shown in the right bottom corner of each panel. D: RNA stability assays on the transcript of the fliC gene, as determined using qRT-PCR. The horizontal dashed line indicates 50% of residual amount of mRNA after rifampicin addition; the vertical dashed lines define the half-life values. Values are the average of four experiments (two repeats, each performed on duplicate samples, from two independent experiments) and standard deviations are shown.
Figure 5
Figure 5. TEM observation of ultrathin sections of paraffin-embedded BtCDC272 grown in different conditions.
Arrows point to PHA granules. The 1 μm scale bar is shown in the left bottom corner of each panel.
Figure 6
Figure 6. EPS/LPS determination.
A) Quantitative determination of cell surface-associated polysaccharides using the phenol/sulfuric acid method. Values are the average of six measurements (two repeats for three independent cultures) and standard deviations are shown. Statistical analysis (two-tailed Student’s t test) of the results provided a p value<0.0001 (indicated by the three asterisks in the figure). B) PAGE analysis of cell surface-associated polysaccharides. The main band detected by silver staining, is indicated by the arrow. PAGE analysis of cell surface-associated polysaccharides from three independent BtCDC272 cultures gave very similar results.
Figure 7
Figure 7. In vitro phagocytosis of BtCDC272 grown in different conditions by neutrophils in whole blood.
In vitro phagocytosis of BtCDC (10 and 100 M.O.I) by human neutrophils of two donors was determined by FACS analysis at 15 min. Data are expressed as the percentage of control MFI. The mean value ± SEM is shown. *p≤0.05; **p≤0.01; ***p≤0.001; two-tailed Student’s t test. 0. Results for each donor, expressed as MFI, are shown in Figure S3.
Figure 8
Figure 8. Cytokine production by mouse macrophage cell line RAW264.7 exposed to BtCDC272 grown in different conditions and at different M.O.I.
Confluent monolayers of cells were incubated with bacteria cultured at the indicated conditions. Bacteria were added at MOI of 0.005, 0.05, 0.5 or 5 for 4 hours to confluent monolayers of RAW264.7 cells. LPS (100 ng/ml from E. coli Serotype 055:B5; Sigma-Aldrich) was used as positive control of macrophage activation. Murine CXCL2, TNF-α and IL-6 levels were measured in cell supernatants by ELISA Results are mean± SEM of two independent experiments.

References

    1. Coenye T, Vandamme P (2003) Diversity and significance of Burkholderia species occupying diverse ecological niches. Environ Microbiol 5: 719–729. - PubMed
    1. Mahenthiralingam E, Urban TA, Goldberg JB (2005) The multifarious, multireplicon Burkholderia cepacia complex. Nat Rev Microbiol 3: 144–156. - PubMed
    1. White NJ (2003) Melioidosis. Lancet 361: 1715–1722. - PubMed
    1. Smith MD, Angus BJ, Wuthiekanun V, White NJ (1997) Arabinose assimilation defines a nonvirulent biotype of Burkholderia pseudomallei . Infect Immun 65: 4319–4321. - PMC - PubMed
    1. Brett PJ, DeShazer D, Woods DE (1998) Burkholderia thailandensis sp. nov., a Burkholderia pseudomallei-like species. Int J Syst Bacteriol 48 Pt 1: 317–320. - PubMed

Publication types

MeSH terms