. 2014 Mar 26;9(3):e93154.
doi: 10.1371/journal.pone.0093154. eCollection 2014.

Combining EEG and MEG for the reconstruction of epileptic activity using a calibrated realistic volume conductor model

Affiliations

Combining EEG and MEG for the reconstruction of epileptic activity using a calibrated realistic volume conductor model

Ümit Aydin et al. PLoS One. .

Abstract

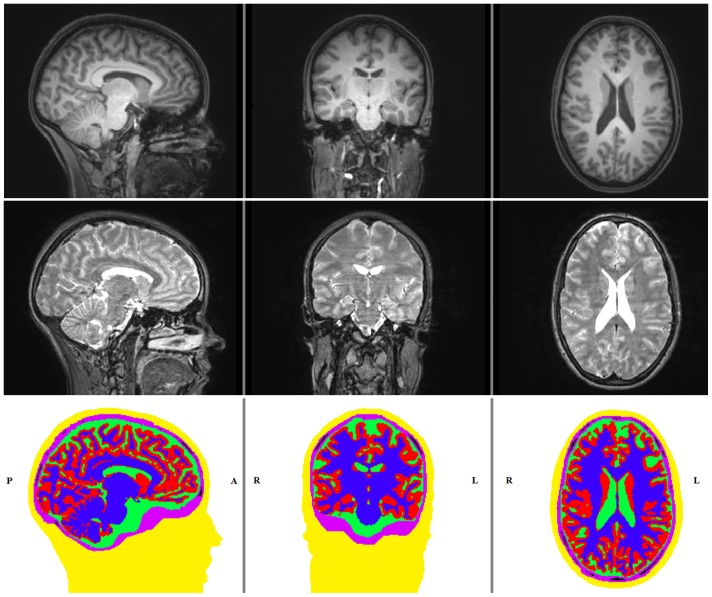
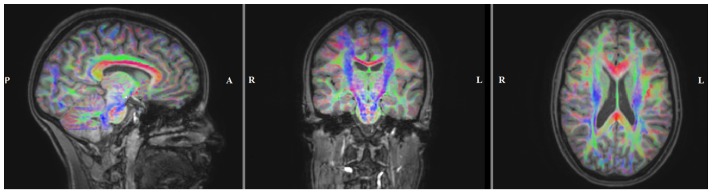
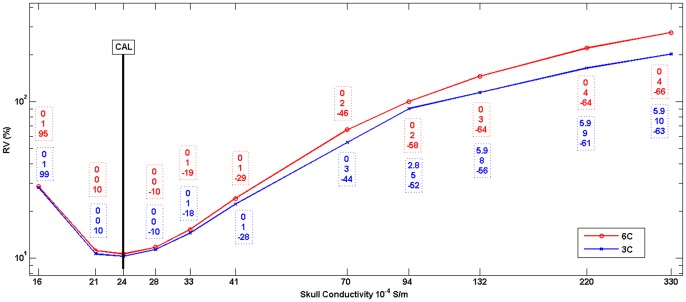
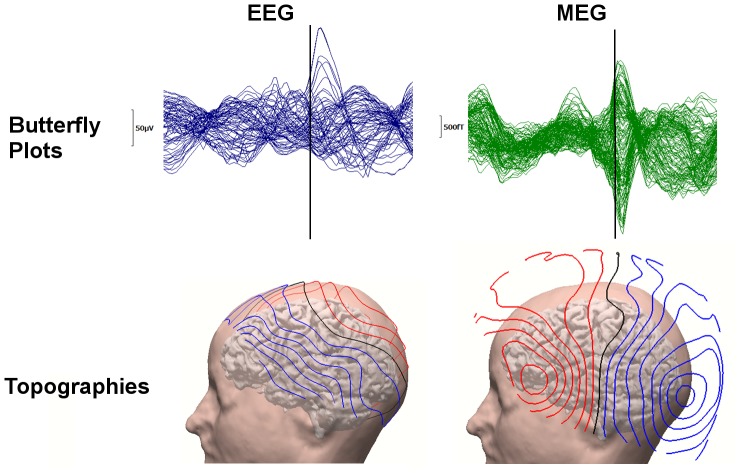
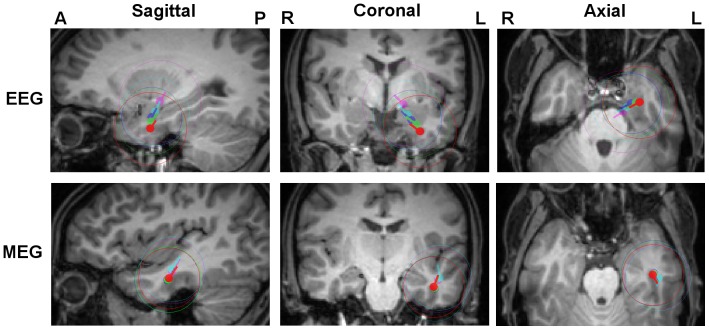
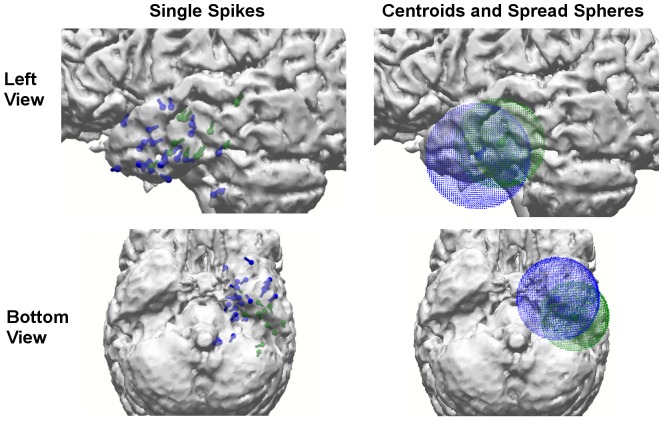
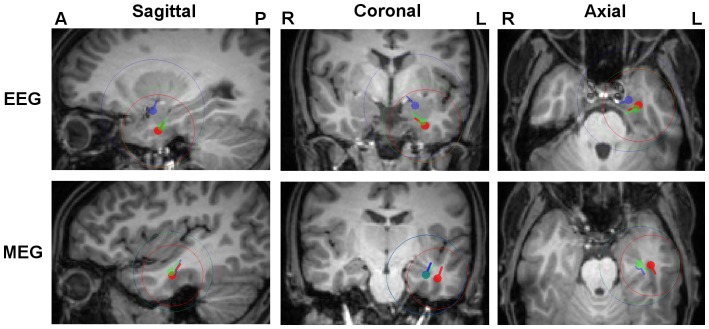
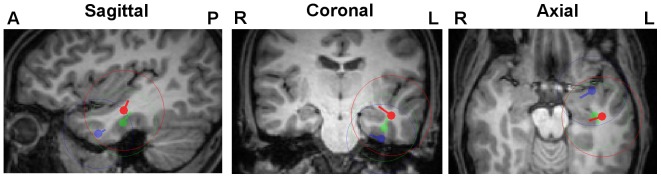
To increase the reliability for the non-invasive determination of the irritative zone in presurgical epilepsy diagnosis, we introduce here a new experimental and methodological source analysis pipeline that combines the complementary information in EEG and MEG, and apply it to data from a patient, suffering from refractory focal epilepsy. Skull conductivity parameters in a six compartment finite element head model with brain anisotropy, constructed from individual MRI data, are estimated in a calibration procedure using somatosensory evoked potential (SEP) and field (SEF) data. These data are measured in a single run before acquisition of further runs of spontaneous epileptic activity. Our results show that even for single interictal spikes, volume conduction effects dominate over noise and need to be taken into account for accurate source analysis. While cerebrospinal fluid and brain anisotropy influence both modalities, only EEG is sensitive to skull conductivity and conductivity calibration significantly reduces the difference in especially depth localization of both modalities, emphasizing its importance for combining EEG and MEG source analysis. On the other hand, localization differences which are due to the distinct sensitivity profiles of EEG and MEG persist. In case of a moderate error in skull conductivity, combined source analysis results can still profit from the different sensitivity profiles of EEG and MEG to accurately determine location, orientation and strength of the underlying sources. On the other side, significant errors in skull modeling are reflected in EEG reconstruction errors and could reduce the goodness of fit to combined datasets. For combined EEG and MEG source analysis, we therefore recommend calibrating skull conductivity using additionally acquired SEP/SEF data.


Conflict of interest statement

Competing Interests: The authors have declared that no competing interests exist.

Figures

Figure 1
Figure 1. T1-w, T2-w MRI and the segmented image.
Sagittal (left column), coronal (middle column) and axial (right column) slices of T1w-MRI (top row), T2w-MRI (middle row) and the 6 compartment segmentation result showing the head tissues skin (yellow), skull compacta (purple), skull spongiosa (black), CSF (green), gray matter (red) and white matter (blue) (bottom row).
Figure 2
Figure 2. Diffusion directions obtained from DTI.
Sagittal (left), coronal (middle) and axial (right) slice of the color coded fractional anisotropy (FA) map computed from the registered diffusion tensors and plotted on the registered T1w-MRI. The color indicates the main fiber orientation: red is left-right, green is anterior-posterior and blue is superior-inferior.
Figure 3
Figure 3. Skull conductivity calibration graph.
RV (in %) obtained from Algorithm 2 in step 2.d. for different skull conductivity parameters for 6C (red) and 3C (blue) head models. The differences to the calibrated head models 6C_Cal and 3C_Cal (indicated by the black bar, see also Table 1) in source reconstruction are indicated by boxes with dashed frames: Difference in source location x (top row, in mm), orientation o2 (middle row, in degree) and strength m2 (bottom row, in %).
Figure 4
Figure 4. The waveform and topography of an example epileptic spike.
FT9 spike: 71 channel EEG (left column) and 129 channel MEG (right column) butterfly plots (upper row, time-point −13 ms marked with a black line) and corresponding topographies from left view at time-point −13 ms plotted on individual brain and skin (bottom row).
Figure 5
Figure 5. Influence of skull conductivity on EEG and MEG localizations.
FT9 centroids and spread spheres plotted on T1w-MRI for head models 6C_Cal (red), 6C_41 (green), 6C_70 (blue), 6C_132 (cyan) and 6C_330 (magenta). The centroid locations of 6C_Cal were used for the selection of MRI slices and all results were projected on these slices.
Figure 6
Figure 6. Single spike localizations and corresponding centroid and spread sphere.
FT9 spike SDDS reconstructions for EEG (blue) and MEG (green) using the calibrated head model 6C_Cal at time-point −13 ms: SDDS dipole reconstruction results of all single spikes that passed step 2 of Algorithm 1 (left) and corresponding cluster centroids and spread spheres (right).
Figure 7
Figure 7. Comparison of 3 and 6 compartment head models.
FT9 centroids and spread spheres plotted on T1w-MRI for head models 6C_Cal (red), 3C_Cal (green) and 3C_100 (blue). The centroid locations of 6C_Cal were used for the selection of MRI slices and all results were projected on these slices.
Figure 8
Figure 8. Differences of EEG, MEG and combined EEG/MEG localizations.
FT9 centroids and spread spheres plotted on T1w-MRI for combined EEG/MEG (red), MEG (green) and EEG (blue) using head model 6C_Cal. The centroid location of the combined reconstruction was used for the selection of MRI slices and all results were projected on these slices.

References

    1. Lüders HO, Najm I, Nair D, Widdess-Walsh P, Bingman W (2006) The epileptogenic zone: general principles. Epileptic Disord Int Epilepsy J Videotape 8 Suppl 2: S1–9. - PubMed
    1. Degen R, Ebner A, Lahl R, Bartling S, Pannek HW, et al. (2003) MRI and EEG findings in surgically treated patients with partial seizures due to neuronal migration disorders, their relations to each other and to surgery outcome. Acta Neurol Scand 108: 309–318. - PubMed
    1. Janszky J, Jokeit H, Schulz R, Hoppe M, Ebner A (2000) EEG predicts surgical outcome in lesional frontal lobe epilepsy. Neurology 54: 1470–1476. - PubMed
    1. Lee SK, Lee SY, Kim K-K, Hong K-S, Lee D-S, et al. (2005) Surgical outcome and prognostic factors of cryptogenic neocortical epilepsy. Ann Neurol 58: 525–532 10.1002/ana.20569 - DOI - PubMed
    1. Jerbi K, Baillet S, Mosher JC, Nolte G, Garnero L, et al. (2004) Localization of realistic cortical activity in MEG using current multipoles. Neuroimage 22(2): 779–793. - PubMed

Publication types