. 2014 Mar 26;9(3):e92870.
doi: 10.1371/journal.pone.0092870. eCollection 2014.

Redistribution of flexibility in stabilizing antibody fragment mutants follows Le Châtelier's principle

Affiliations

Redistribution of flexibility in stabilizing antibody fragment mutants follows Le Châtelier's principle

Tong Li et al. PLoS One. .

Abstract

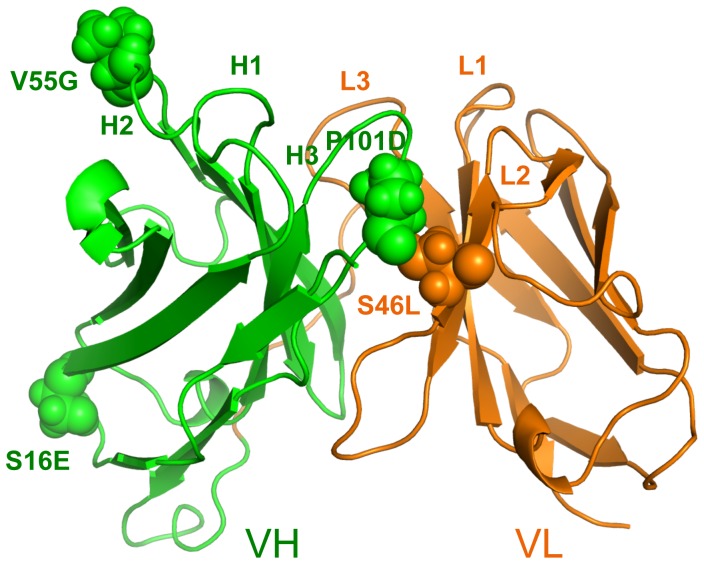
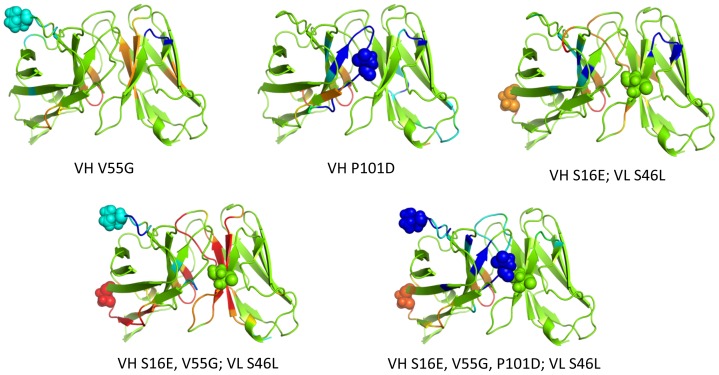
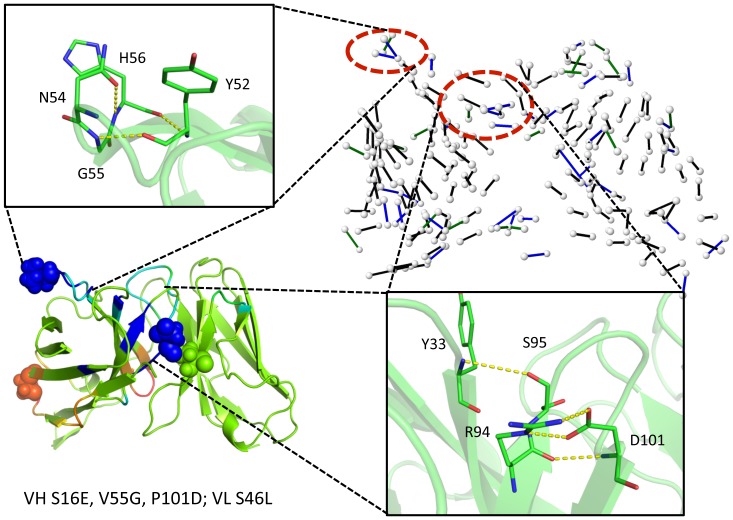
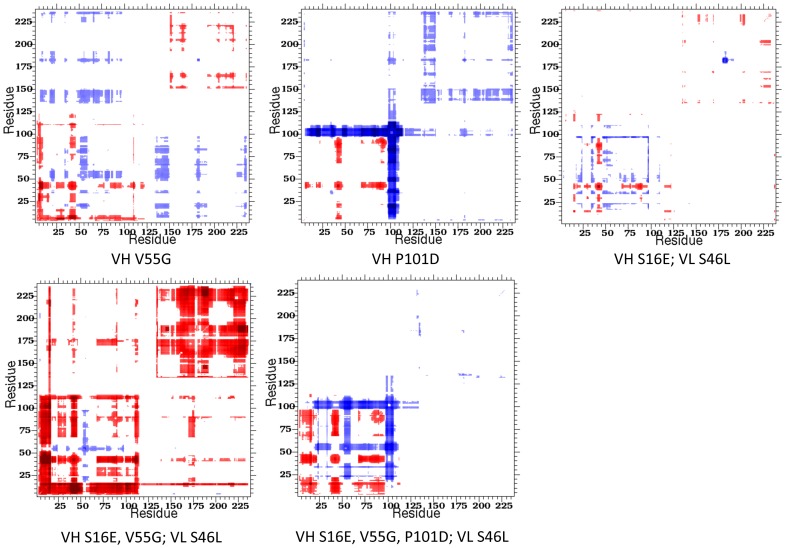
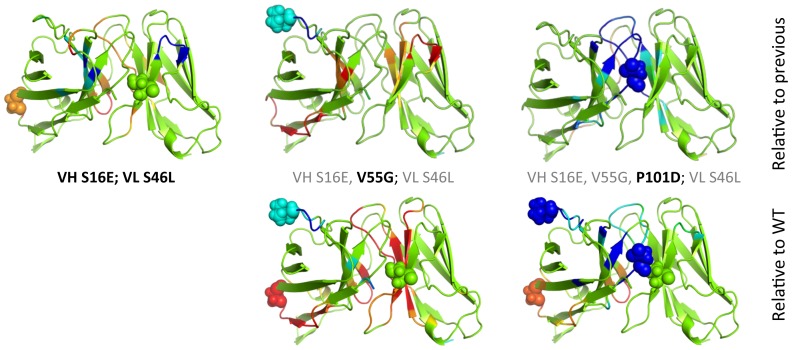
Le Châtelier's principle is the cornerstone of our understanding of chemical equilibria. When a system at equilibrium undergoes a change in concentration or thermodynamic state (i.e., temperature, pressure, etc.), La Châtelier's principle states that an equilibrium shift will occur to offset the perturbation and a new equilibrium is established. We demonstrate that the effects of stabilizing mutations on the rigidity ⇔ flexibility equilibrium within the native state ensemble manifest themselves through enthalpy-entropy compensation as the protein structure adjusts to restore the global balance between the two. Specifically, we characterize the effects of mutation to single chain fragments of the anti-lymphotoxin-β receptor antibody using a computational Distance Constraint Model. Statistically significant changes in the distribution of both rigidity and flexibility within the molecular structure is typically observed, where the local perturbations often lead to distal shifts in flexibility and rigidity profiles. Nevertheless, the net gain or loss in flexibility of individual mutants can be skewed. Despite all mutants being exclusively stabilizing in this dataset, increased flexibility is slightly more common than increased rigidity. Mechanistically the redistribution of flexibility is largely controlled by changes in the H-bond network. For example, a stabilizing mutation can induce an increase in rigidity locally due to the formation of new H-bonds, and simultaneously break H-bonds elsewhere leading to increased flexibility distant from the mutation site via Le Châtelier. Increased flexibility within the VH β4/β5 loop is a noteworthy illustration of this long-range effect.


Conflict of interest statement

Competing Interests: Note that a grant from MedImmune LLC provided support for Dr. Tong Li to work on this project in Dennis Livesay’s lab. Coauthors Malgorzata Tracka, Shahid Uddin and Jose Casas-Finet are all MedImmune employees. This does not alter the authors’ adherence to all the PLOS ONE policies on sharing data and materials.

Figures

Figure 1
Figure 1. Mutation positions are shown within the anti-lymphotoxin-β receptor (LTβR) antibody single chain Fv fragment (scFv) structure.
The wild type structure is shown with VH and VL domains respectively colored green and orange. The complementarity determining regions are labeled and the mutation positions are shown in spacefill with the each mutation labeled adjacently.
Figure 2
Figure 2. Molecular dynamics trajectories.
(A) Root mean square deviations (Cα) are provided for each of the molecular dynamics trajectories. All of the simulations appear well equilibrated, except the quadruple mutant exhibits a continuous change in the orientation between the two domains across the interface. This observation is particularly interesting because the quadruple mutant is the most stable of the five mutants. The slippage along the domain interface is indicated in panel (B), where different colors represent snapshots occurring at: 10 ns (red), 40 ns (blue), and 70 ns (green).
Figure 3
Figure 3. Per residue characteristics.
(A) Residue root mean square fluctuations (RMSF) are provided for the six molecular dynamics trajectories. The increased fluctuations within the double and quadruple mutant trivially reflect the VH/VL global rearrangements at the dimer interface. Note that the linker region, indicated by the short tick marks along the x-axis, is ignored because the fluctuations therein obfuscate the rest. The dashed vertical lines indicate where mutations occur. (B) The average flexibility index is provided for each case. Reported values correspond to the appropriate weighted average (defined in methods) over 10 representative structures sampled from the MD trajectory. Changes in flexibility relative to the wild type are both structurally local (as observed at the two highlighted mutant locations) and remote from the mutation site. (C) Differences in H-bond between wild type and each mutant. The total H-bond counts (donor and acceptor) are averaged across the MD simulation for each residue. Note that there is no wild type (black) series in panel (C) because the reported values are differences.
Figure 4
Figure 4. The effects of the number of representative structures on the QSFR results are considered.
In panel (A), the accuracy of the Tm predictions are plotted versus number of representative structures used, where accuracy is described the Pearson correlation between the predicted and experimental sets. In panels (B) and (C), the similarity between the backbone flexibility index and cooperativity correlation plots, respectively, are compared for each pair of representative structures with the same sequence. These values are collapsed across the six proteins and their distributions are compared using box plots. The medians and first/third quartiles are very consistent, indicating that mechanical predictions are robust.
Figure 5
Figure 5. Changes in rigidity within the mutant structures relative to wild type are indicated by color: green = no change; cyan and blue = moderate and large rigidity increases; and orange and red = moderate and large increases in flexibility.
In each case, the color represents a certain z-score range for differences that are defined within Figure S6.
Figure 6
Figure 6. Statistically significant changes in rigidity (p<0.01) are tabulated based on the distance between them and the closest constituent mutation.
Note that the average distance in the increased rigidity response (A) is significantly less than increased flexibility (B), 13.6 Å vs. 17.9 Å, respectively.
Figure 7
Figure 7. Regions that exhibit large increases in rigidity within the quadruple mutant are identified.
The effects of the quadruple mutation (VH S16E, V55G, P101D; VL S46L) on protein flexibility are displayed in the lower left panel. The hydrogen bond network (HBN) is displayed in the upper right panel. Color indicates H-bond frequency across the full MD trajectory, black>90% occupancy, 90%≥blue>70%, and 70%≥green>50% (H-bonds with less than 50% occupancy are not shown). The two red circles emphasize two regions in the HBN with increased number of hydrogen bonds relative to the wild type, leading to an increase in rigidity. That is, the new hydrogen bonds highlighted in yellow dashed lines locally rigidify the corresponding regions, which correspond to complementary determining regions H2 and H3.
Figure 8
Figure 8. Cooperativity correlation difference plots highlight differences in pairwise mechanical couplings between the wild type and each mutant.
Red indicates increased correlated flexibility within the mutant structure, whereas blue indicates increased correlated rigidity. White indicates no change. Notice in most mutants (i.e., triple mutant), changes in cooperativity correlation occur throughout the Fv structure, whereas they are primarily isolated to the VH domain in the quadruple mutant.
Figure 9
Figure 9. Using the same coloring scheme as Figure 5, rigidity/flexibility changes that occur as additional mutations are added are described.
The top row compares, from left to right, the double mutant to the wild type, the triple mutant to the double, and the quadruple to the double, which corresponds to the fewest number of per residue changes. The bottom row re-plots the corresponding structures from Figure 5 , which are relative to wild type, so the per residue effects can be compared to the global changes.

References

    1. Fleming PJ, Rose GD (2005) Do all backbone polar groups in proteins form hydrogen bonds? Protein Sci 14: 1911–1917. - PMC - PubMed
    1. Livesay DR (2010) Protein dynamics: dancing on an ever-changing free energy stage. Curr Opin Pharmacol 10: 706–708. - PMC - PubMed
    1. Tokuriki N, Tawfik DS (2009) Stability effects of mutations and protein evolvability. Curr Opin Struct Biol 19: 596–604. - PubMed
    1. Verma D, Jacobs DJ, Livesay DR (2012) Changes in lysozyme flexibility upon mutation are frequent, large and long-ranged. PLoS Comput Biol 8: e1002409. - PMC - PubMed
    1. Yutani K, Ogasahara K, Sugino Y (1985) Effect of amino acid substitutions on conformational stability of a protein. Adv Biophys 20: 13–29. - PubMed

Publication types