. 2014 Jun 15;111(12):2445-64.
doi: 10.1152/jn.00731.2013. Epub 2014 Mar 26.

Sensory convergence in the parieto-insular vestibular cortex

Affiliations

Sensory convergence in the parieto-insular vestibular cortex

Michael E Shinder et al. J Neurophysiol. .

Abstract

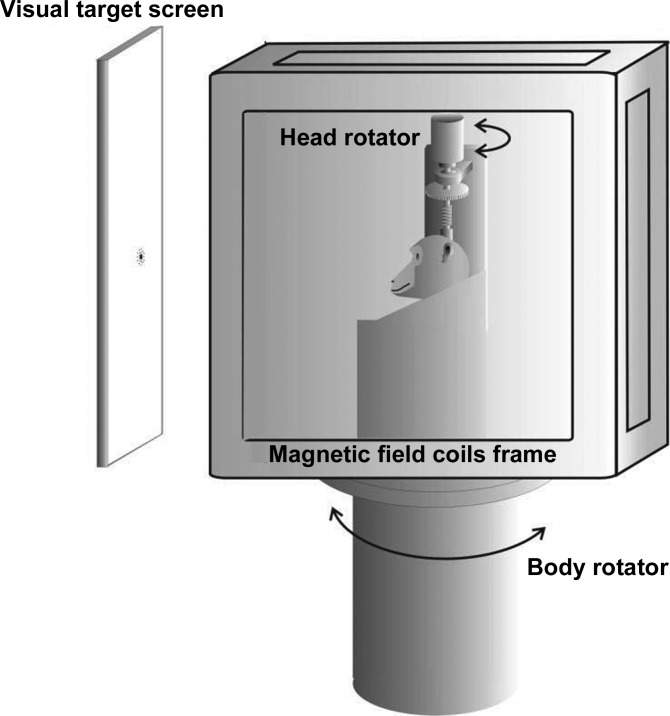
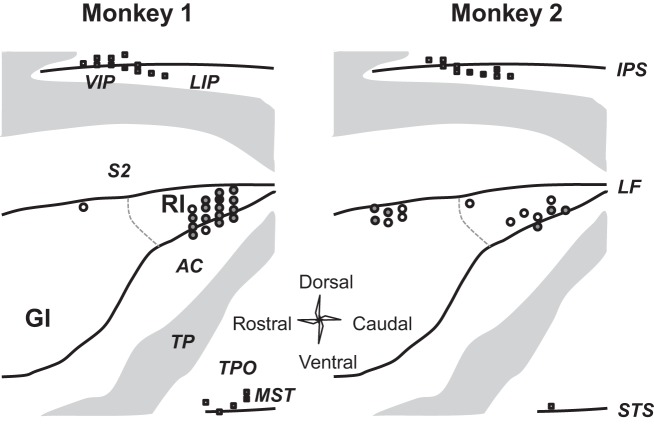
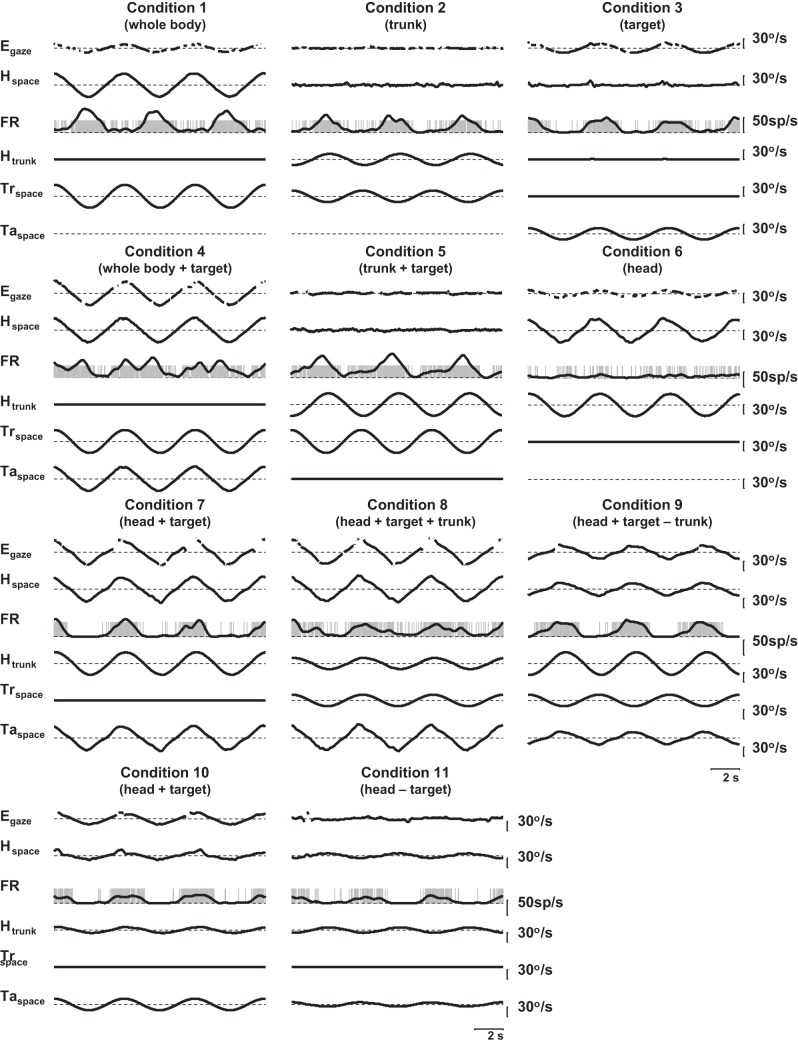
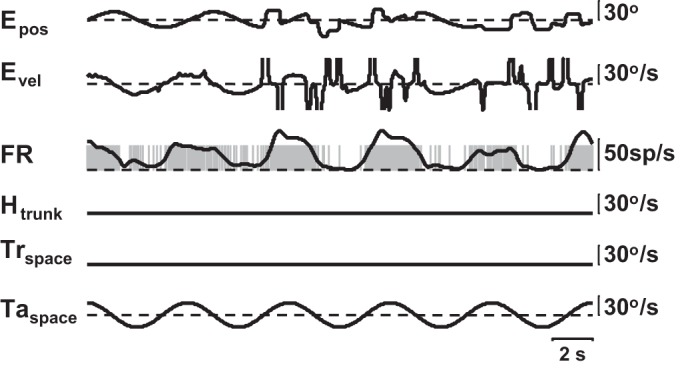
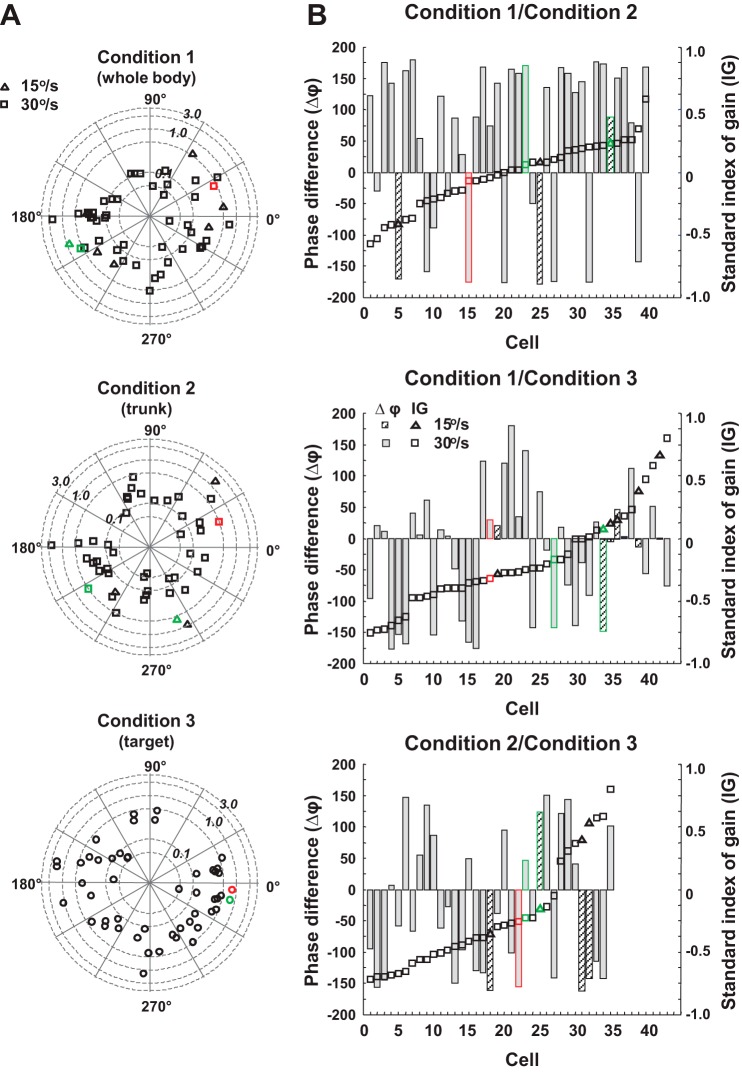
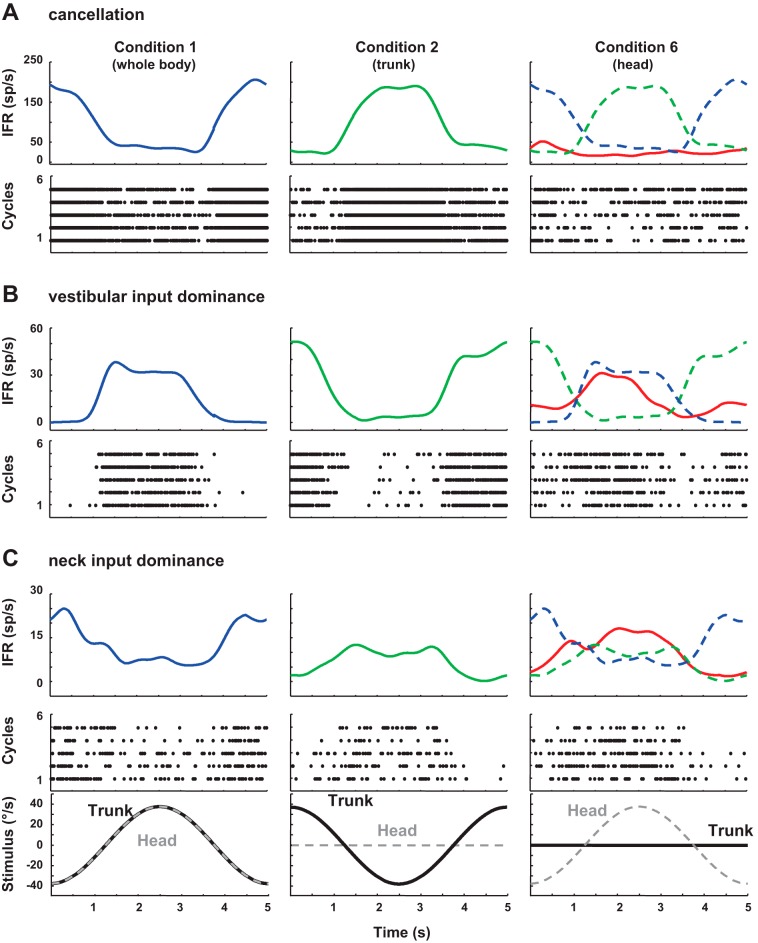
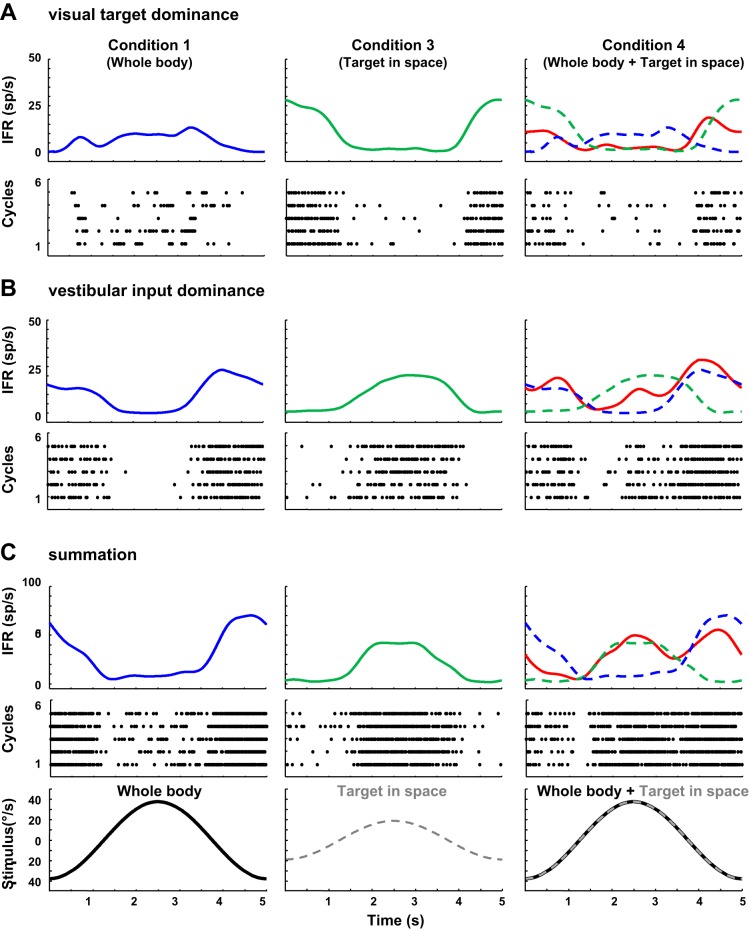
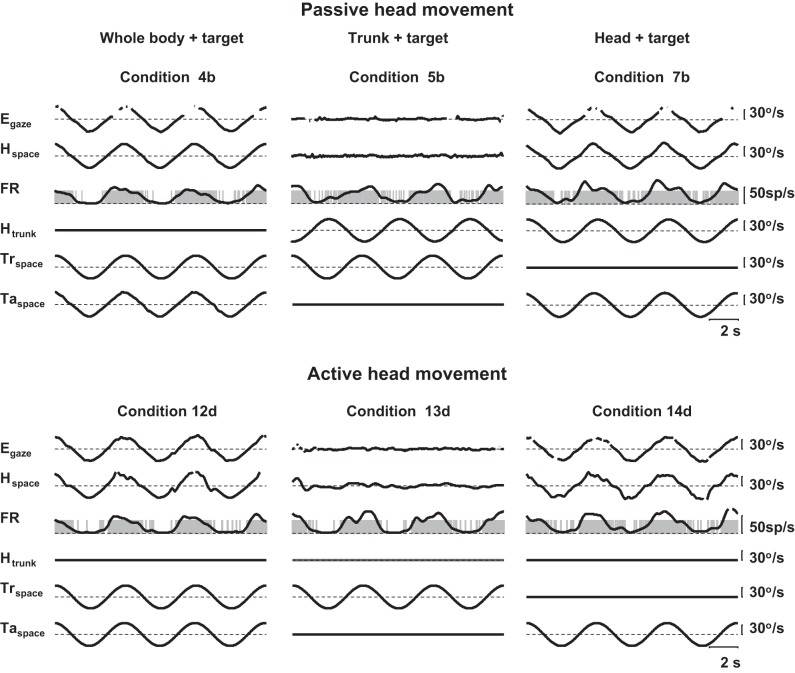
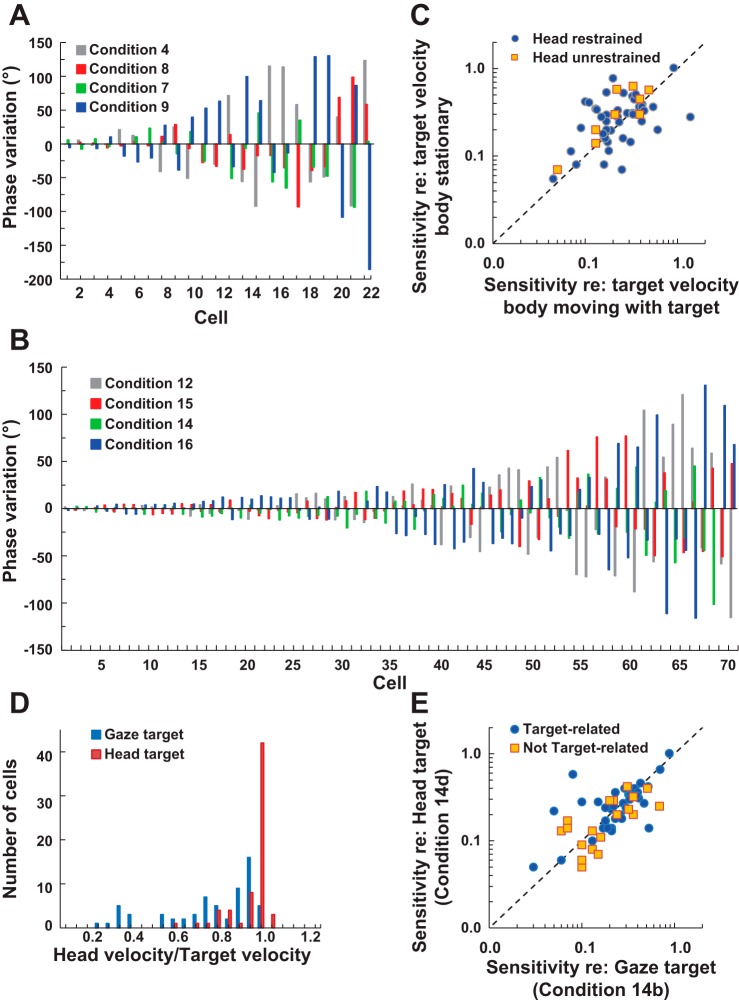
Vestibular signals are pervasive throughout the central nervous system, including the cortex, where they likely play different roles than they do in the better studied brainstem. Little is known about the parieto-insular vestibular cortex (PIVC), an area of the cortex with prominent vestibular inputs. Neural activity was recorded in the PIVC of rhesus macaques during combinations of head, body, and visual target rotations. Activity of many PIVC neurons was correlated with the motion of the head in space (vestibular), the twist of the neck (proprioceptive), and the motion of a visual target, but was not associated with eye movement. PIVC neurons responded most commonly to more than one stimulus, and responses to combined movements could often be approximated by a combination of the individual sensitivities to head, neck, and target motion. The pattern of visual, vestibular, and somatic sensitivities on PIVC neurons displayed a continuous range, with some cells strongly responding to one or two of the stimulus modalities while other cells responded to any type of motion equivalently. The PIVC contains multisensory convergence of self-motion cues with external visual object motion information, such that neurons do not represent a specific transformation of any one sensory input. Instead, the PIVC neuron population may define the movement of head, body, and external visual objects in space and relative to one another. This comparison of self and external movement is consistent with insular cortex functions related to monitoring and explains many disparate findings of previous studies.

Keywords: insula; multisensory; self-motion; sensory integration; spatial orientation.


Figures

Fig. 1.
Fig. 1.
Schematic representation of the experimental apparatus with independently controllable head rotation, trunk rotation, and visual target.
Fig. 2.
Fig. 2.
Location of recorded neurons on surface diagram of unfolded cortex. The recording locations in each of the 2 monkeys are presented in separate maps. The posterior insular cortex is displayed as if the lateral fissure had been opened up and flattened out. The gray regions represent gyri normally on the outer surface of the brain. The sulci (LF, lateral fissure; IPS, intraparietal; STS, superior temporal) and cortical regions (GI, granular insular; RI, retroinsular; AC, auditory; LIP, lateral intraparietal; MST, medial superior temporal; S2, secondary somatosensory; TP, temporoparietal; TPO, temporoparietal occipital; VIP, ventral intraparietal) are labeled separately. The 74 neurons recorded in the insular cortex and presented in subsequent analyses are denoted by circles. The neurons in the VIP and MST were presented previously (Shinder and Newlands 2005). Open circles, 1 cell found at that site; shaded circles, 2 to 5 cells found; solid circles, 6 or more cells. Squares have a similar fill and color scheme and represent motion-responsive neurons found in neighboring brain regions. These neurons are not analyzed here.
Fig. 3.
Fig. 3.
Traces from 1 neuron tested with the 11 conditions used with the head-controlled protocols. The condition numbers correspond to the conditions listed in Table 1. Egaze, eye in space velocity (with saccades removed); Hspace, head velocity in space. FR, spike raster and Kaiser Window filtered representation of the firing rate are both shown. Htrunk, head-on-neck rotator velocity. Trspace, trunk (chair rotator) velocity. Taspace, gaze target velocity in space.
Fig. 4.
Fig. 4.
Traces from another neuron tested with the 11 conditions used with the head-controlled protocols. The condition numbers correspond to the conditions listed in Table 1. Labels as in Fig. 3.
Fig. 5.
Fig. 5.
Response of parieto-insular vestibular cortex (PIVC) neuron to a target in an episode where behavior is poor. Epos, eye position. Evel, eye velocity (saccades not removed, but cutoff in the figure). Other labels are as in Fig. 3.
Fig. 6.
Fig. 6.
A: polar plots representing the gain (radius) and phase [relative to right head, trunk (neck twist), or target velocity] of the responses for responsive PIVC neurons to unisensory stimuli. B: histograms represent the relationship between head, neck, and visual head-controlled stimuli for neurons having sensitivity to at least 2 of the stimuli. The cells are aligned by standard index of gain. Symbols distinguish between conditions with 15°/s velocity and 30°/s velocity. Shaded bars represent phase differences at 30°/s and hashed bars 15°/s. Triangles represent the standard index of gain at 15°/s, and squares represent 30°/s. For condition 3, only 15°/s velocity was tested, symbol used is a circle. Standard index of gain for the three graphs are (gain of condition 1 - gain of condition 2)/(gain of condition 1 + gain of condition 2), (gain of condition 1 - gain of condition 3)/(gain of condition 1 + gain of condition 3), and (gain of condition 2 - gain of condition 3)/(gain of condition 2 + gain of condition 3). Phase differences are condition 1 phase re:trunk - condition 2 phase re:trunk, condition 1 phase re:trunk - condition 3 phase re:target, and condition 2 phase re:trunk - condition 3 phase re:target, respectively. The data from the example neuron in Fig. 3 are highlighted in red, and the data from the example neuron in Fig. 4 are highlighted in green.
Fig. 7.
Fig. 7.
Examples of 3 neurons (A, B, and C) where the responses to vestibular, neck, and combined stimulation are compared. IFR, instantaneous firing rate. Top: averaged IFR over 5 cycles filtered with Kaiser Window. Bottom: spike raster, each dot represents 1 spike. The lowest panel in C applies to A and B as well; trunk velocity is black, and head velocity is gray. Left: trunk velocity and head velocity are the same. Middle: trunk is moving with the head held stationary. Right: for condition 6, there is no trunk movement; the head is moving, but the trunk is not.
Fig. 8.
Fig. 8.
Three examples of cells with the visual, vestibular, and combined sensitivity. Panels as in Fig. 7. Black line is visual stimulus, and dashed line is rotational stimulus.
Fig. 9.
Fig. 9.
Example neuron recorded during active and passive rotations of the head. Labels as in Fig. 3. Conditions as in Table 1.
Fig. 10.
Fig. 10.
A: comparison of phase of neuronal response re:target (and head) for 4 of the head-controlled stimuli. For the y-axis, 0° is the mean phase of the responses for that particular neuron across the 3 or 4 conditions tested. The neurons are arranged in order of ascending variance in the phase of the response. Those neurons to the left have very consistent response phases across the stimuli; those to the right have very inconsistent responses across the stimuli. B: as in A, except responses under head-free conditions are compared. C: for neurons that had consistent (within 50°) phase relationships across the conditions tested, the sensitivity of the neurons to conditions 4 and 7 (head controlled) and conditions 12 and 14 (head free) are compared. D: histograms comparing the proportion of pursuit of the target that is done with the head for the head-free task of target pursuit ± 30°/s while the trunk is stationary. Condition 14b (gaze target) is compared with condition 14d (head target). E: sensitivity of neurons during pursuit of a gaze target compared with during pursuit of an eye target. Neurons that are classified as target related based on their position in B are identified separately from the other cells.

References

    1. Abreu AM, Macaluso E, Azevedo RT, Cesari P, Urgesi C, Aglioti SM. Action anticipation beyond the action observation network: a functional magnetic resonance imaging study in expert basketball players. Eur J Neurosci 35: 1646–1654, 2012 - PubMed
    1. Akbarian S, Berndl K, Grusser OJ, Guldin W, Pause M, Schreiter U. Responses of single neurons in the parietoinsular vestibular cortex of primates. Ann NY Acad Sci 545: 187–202, 1988 - PubMed
    1. Akbarian S, Grusser OJ, Guldin WO. Corticofugal connections between the cerebral cortex and brainstem vestibular nuclei in the Macaque monkey. J Comp Neurol 339: 421–437, 1994 - PubMed
    1. Alitto HJ, Usrey WM. Corticothalamic feedback and sensory processing. Curr Opin Neurobiol 13: 440–445, 2003 - PubMed
    1. Antal A, Baudewig J, Paulus W, Dechent P. The posterior cingulate cortex and planum temporale/parietal operculum are activated by coherent visual motion. Vis Neurosci 25: 17–26, 2008 - PubMed

Publication types

LinkOut - more resources