. 2014 Jun;24(6):974-88.
doi: 10.1101/gr.169417.113. Epub 2014 Mar 26.

Three-dimensional modeling of the P. falciparum genome during the erythrocytic cycle reveals a strong connection between genome architecture and gene expression

Affiliations

Three-dimensional modeling of the P. falciparum genome during the erythrocytic cycle reveals a strong connection between genome architecture and gene expression

Ferhat Ay et al. Genome Res. 2014 Jun.

Abstract

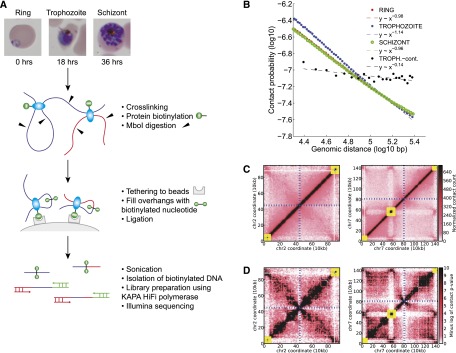
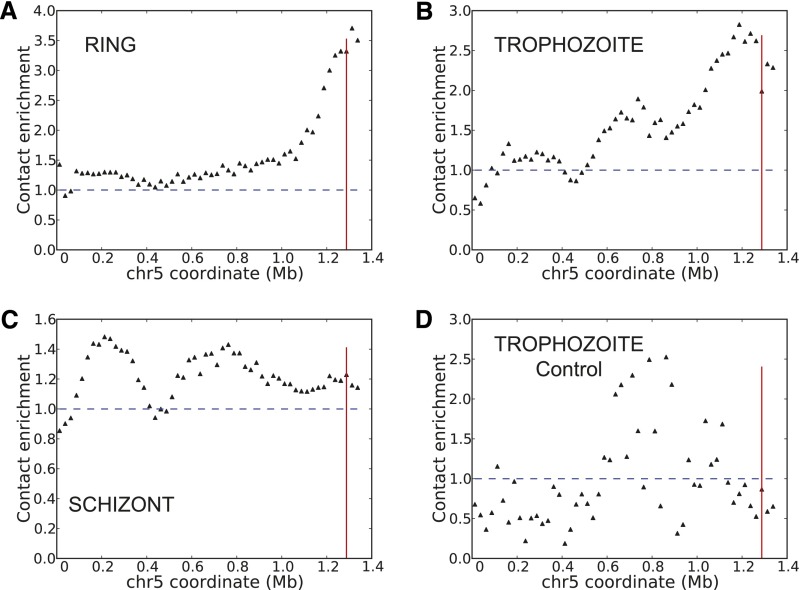
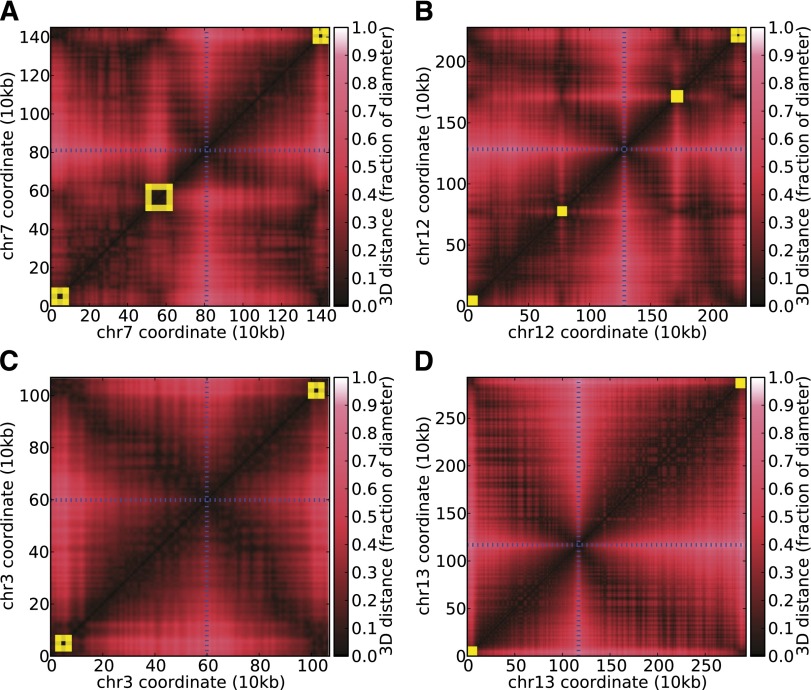
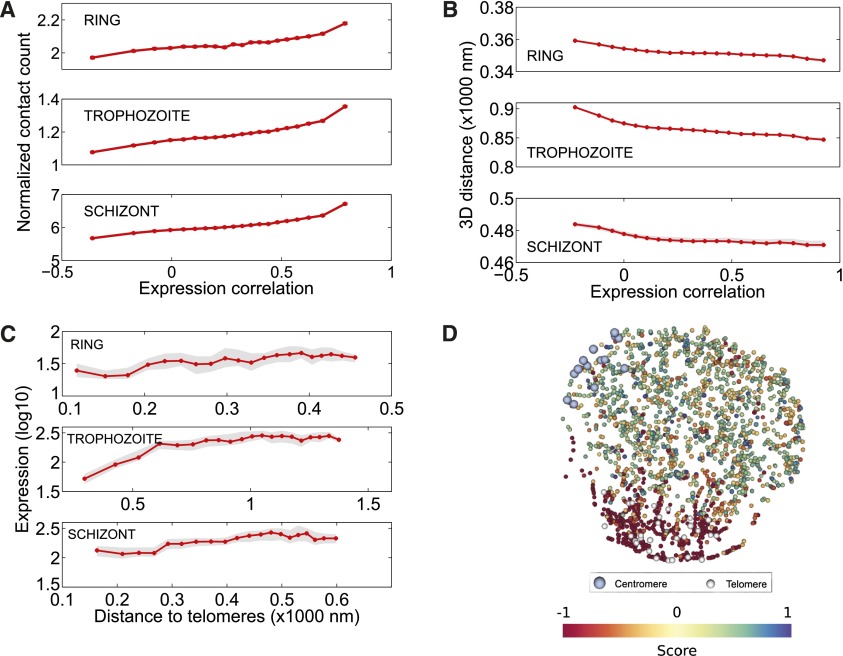
The development of the human malaria parasite Plasmodium falciparum is controlled by coordinated changes in gene expression throughout its complex life cycle, but the corresponding regulatory mechanisms are incompletely understood. To study the relationship between genome architecture and gene regulation in Plasmodium, we assayed the genome architecture of P. falciparum at three time points during its erythrocytic (asexual) cycle. Using chromosome conformation capture coupled with next-generation sequencing technology (Hi-C), we obtained high-resolution chromosomal contact maps, which we then used to construct a consensus three-dimensional genome structure for each time point. We observed strong clustering of centromeres, telomeres, ribosomal DNA, and virulence genes, resulting in a complex architecture that cannot be explained by a simple volume exclusion model. Internal virulence gene clusters exhibit domain-like structures in contact maps, suggesting that they play an important role in the genome architecture. Midway during the erythrocytic cycle, at the highly transcriptionally active trophozoite stage, the genome adopts a more open chromatin structure with increased chromosomal intermingling. In addition, we observed reduced expression of genes located in spatial proximity to the repressive subtelomeric center, and colocalization of distinct groups of parasite-specific genes with coordinated expression profiles. Overall, our results are indicative of a strong association between the P. falciparum spatial genome organization and gene expression. Understanding the molecular processes involved in genome conformation dynamics could contribute to the discovery of novel antimalarial strategies.


Figures

Figure 1.
Figure 1.
Tethered conformation capture of the Plasmodium falciparum genome. (A) Experimental protocol. (B) Contact probability as a function of genomic distance, with log-linear fits for the three erythrocytic stages, as well as an experimental control. (C) Normalized contact count matrices at 10-kb resolution for chromosome 2 and chromosome 7 in the schizont stage. (D) Contact P-values (negative log10 scale) for chromosome 2 and chromosome 7 in the schizont stage. In C and D, yellow boxes denote clusters of VRSM genes, and blue dashed lines indicate the centromere location.
Figure 2.
Figure 2.
3D modeling and validation with DNA FISH. (A) 3D structures of all three stages. The nuclear radii used to model ring, trophozoite, and schizont stages were 350, 850, and 425 nm, respectively. Centromeres and telomeres are indicated with light-blue and white spheres, respectively. Midpoints of VRSM gene clusters are shown with green spheres. (B) Validation of colocalization between a pair of interchromosomal loci with VRSM genes (chr7: 550,000–560,000 that harbors internal VRSM genes and chr8: 40,000–50,000 that harbors subtelomeric VRSM genes) by DNA FISH (left) and by the three-dimensional model for the corresponding stage (right). The location of the loci in the 3D model is shown with light-blue spheres and indicated by black arrows. (C) Validation same as in B for a pair of interchromosomal loci that harbor no VRSM genes (chr7: 810,000–820,000 and chr11: 820,000–830,000).
Figure 3.
Figure 3.
Colocalization of highly transcribed rDNA units. Virtual 4C plots generated at 25-kb resolution using as bait the A-type rDNA unit on chromosome 7 from cross-linked Hi-C libraries of ring (A), trophozoite (B), schizont stages (C), and from the trophozoite control library (D). Vertical red line indicates the midpoint of the A-type rDNA unit on chromosome 5. Normalized contact counts from 50 kb upstream of and downstream from the 25-kb bin containing the rDNA unit are used, omitting the rDNA-containing window itself to exclude repetitive DNA. For each window w on chromosome 5, the contact enrichment is calculated by dividing the contact count between the bait and w to the average interchromosomal contact count for the bait locus.
Figure 4.
Figure 4.
Volume exclusion modeling. Observed/expected contact frequency matrices illustrate, for each locus, either the depletion (blue) or enrichment (red) of interaction frequencies compared with what would be expected given their genomic distances. (A) Observed/expected contact frequency matrices derived from S. cerevisiae chr 7 from volume exclusion modeling (left) and Hi-C data (right). (B) Observed/expected matrices from volume exclusion modeling (left) and Hi-C data (right) for P. falciparum chr 7 during the trophozoite stage.
Figure 5.
Figure 5.
Role of internal VRSM gene clusters in shaping genome architecture. (A–D) Heatmaps of scaled pairwise Euclidean distances derived from the 3D model at 10-kb resolution for two chromosomes that harbor internal VRSM gene clusters (A,B) and two chromosomes that do not (C,D). Yellow boxes indicate locations of VRSM clusters.
Figure 6.
Figure 6.
Relationship between 3D architecture and gene expression. (A) Correlation between expression profiles of pairs of interchromosomal genes as a function of number of contacts linking the two genes. To generate this plot, all interchromosomal gene pairs are first sorted in increasing order of their expression correlation and then binned into 20 equal width quantiles (fifth, 10th, …, 100th). For each bin, the average expression correlation between gene pairs (x-axis) and the average normalized contact count linking the genes in each pair together with its standard error (y-axis) are computed and plotted. Interchromosomal gene pairs that have contact counts within the top 20% for each stage have more highly correlated expression profiles than the remaining gene pairs (Wilcoxon rank-sum test, P-values 2.48 × 10−206 [ring], 0 [trophozoite], and 0 [schizont]). (B) Correlation between expression profiles of pairs of interchromosomal genes as a function of 3D distance between the genes. This plot is generated similarly to A but using 3D distances instead of contact counts (y-axis). In order to summarize results from multiple 3D structures per each stage, we plot the median value among 100 structures with a red line and shade the region corresponding to the interval between the fifth and 95th percentile with gray. Interchromosomal gene pairs closer than 20% of the nuclear diameter have more highly correlated expression profiles than genes that are far apart (Wilcoxon rank-sum test, P-values 7.17 × 10−221 [ring], 0 [trophozoite], and 1.57 × 10−88 [schizont]). (C) Gene expression as a function of distance to telomeres. To generate this plot all genes are first sorted by increasing distance to the centroid of telomeres (x-axis) and then binned similar to A into 20 equal width quantiles. The average log expression value (Bunnik et al. 2013) together with its standard error (y-axis) is plotted for genes in each bin. In order to summarize results from multiple 3D structures per each stage, we plot the median value among 100 structures with a red line and shade the region corresponding to the interval between fifth and 95th percentile with gray. Genes that lie within 20% of the nuclear diameter to the centroid of the telomeres showed significantly lower expression levels (Wilcoxon rank-sum test, P-values 1.54 × 10⁻¹² [ring], 1.69 × 10⁻³² [trophozoite], 3.37 × 10⁻²⁰ [schizont]). (D) First KCCA expression profile component score, corresponding to the projection of the gene expression profile onto the extracted KCCA profile for the trophozoite stage.

References

    1. Andrews S. 2010. FastQC: a quality control tool for high throughput sequence data. http://www.bioinformatics.babraham.ac.uk/projects/fastqc.
    1. Ay F, Bailey TL, Noble WS 2014. Statistical confidence estimation for Hi-C data reveals regulatory chromatin contacts. Genome Res (this issue). doi: 10.1101/gr.160374.113 - PMC - PubMed
    1. Bach FR, Jordan MI 2002. Kernel independent component analysis. J Mach Learn Res 3: 1–48
    1. Balaji S, Babu MM, Iyer LM, Aravind L 2005. Discovery of the principal specific transcription factors of Apicomplexa and their implication for the evolution of the AP2-integrase DNA binding domains. Nucleic Acids Res 33: 3994–4006 - PMC - PubMed
    1. Bannister LH, Margos G, Hopkins JM 2005. Making a home for Plasmodium post-genomics: ultrastructural organization of the blood stages. In Molecular approaches to malaria, pp. 24–49. ASM Press, Washington, DC

Publication types

MeSH terms

Associated data