. 2014 Apr 24;123(17):e58-67.
doi: 10.1182/blood-2013-02-483792. Epub 2014 Mar 26.

Redefinition of the human mast cell transcriptome by deep-CAGE sequencing

Affiliations

Redefinition of the human mast cell transcriptome by deep-CAGE sequencing

Efthymios Motakis et al. Blood. .

Abstract

Mast cells (MCs) mature exclusively in peripheral tissues, hampering research into their developmental and functional programs. Here, we employed deep cap analysis of gene expression on skin-derived MCs to generate the most comprehensive view of the human MC transcriptome ever reported. An advantage is that MCs were embedded in the FANTOM5 project, giving the opportunity to contrast their molecular signature against a multitude of human samples. We demonstrate that MCs possess a unique and surprising transcriptional landscape, combining hematopoietic genes with those exclusively active in MCs and genes not previously reported as expressed by MCs (several of them markers of unrelated tissues). We also found functional bone morphogenetic protein receptors transducing activatory signals in MCs. Conversely, several immune-related genes frequently studied in MCs were not expressed or were weakly expressed. Comparing MCs ex vivo with cultured counterparts revealed profound changes in the MC transcriptome in in vitro surroundings. We also determined the promoter usage of MC-expressed genes and identified associated motifs active in the lineage. Befitting their uniqueness, MCs had no close relative in the hematopoietic network (also only distantly related with basophils). This rich data set reveals that our knowledge of human MCs is still limited, but with this resource, novel functional programs of MCs may soon be discovered.


Figures

Figure 1
Figure 1
BMPR1 regulates MC effector functions and increases MC survival. (A) MCs were stimulated with BMP4 at 20 ng/mL for the times indicated and the expression of selected MC marker genes quantified by reverse-transcription quantitative polymerase chain reaction and normalized to β-actin. Data are shown in relation to cells kept in the absence of bone morphogenetic protein (BMP) for the same times. (B) Cultured MCs (last addition of SCF 5-7 days earlier) were washed and replated in fresh media with or without BMP4 (20 ng/mL) for 24 hours, after which time histamine release was elicited by FcεRI crosslinking with different concentrations of AER-37. IgER, immunoglobulin E receptor. (C) Cultured MCs were stimulated by AER-37 (0.1 μg/mL) for 2 hours, washed, and replated in fresh media with or without BMP4 (20 ng/mL) ± stem cell factor (SCF) (100 ng/mL) for 48 hours. After this time, cells were subjected to a second round of stimulation by AER-37. MCs are largely refractory to a second stimulation for prolonged times, but BMP accelerates this recovery. Although SCF alone also accelerates recovery, the effects from BMP and SCF are additive. (D) MCs after isolation were cultured in the presence or absence of the indicated factors for 10 days, and recovery of viable cells was assessed. The numbers indicate growth factor concentrations in ng/mL. All data in this figure are the mean ± standard error of the mean from 5-7 independent assays. *P < .05; **P < .01; ***P < .001.
Figure 2
Figure 2
MCs change their transcriptome in in vitro surroundings and upon FcεRI crosslinking. Comparison of the different MC samples by Venn diagrams (A,C) and protein class Gene Ontology analysis (B,D). (A) Venn diagram with the number of RefSeq genes expressed at lower level in ex vivo MCs (red/green-within-red areas) and at higher level in ex vivo MCs (cyan/green-within-cyan areas) as well as those nondifferentially regulated (purple/green-within-purple areas). The genes are specified in supplemental Table 3. The green areas denote the number of TF genes in each group. Five indicative TFs from the differentially regulated lists are also given. (B) Significant protein class terms (α = 5%) of the differentially regulated groups. Pronounced differences are highlighted in purple. (C) Venn diagram with the number of genes expressed at lower/higher level in stimulated as opposed to expanded MCs in analogy to panel A. The genes are specified in supplemental Table 4. (D) Significant protein class terms in stimulated vs expanded MCs in analogy with panel B.
Figure 3
Figure 3
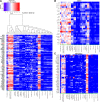
Clusters of MC-relevant genes. The hierarchical clustering of 49 FANTOM5 hematopoietic lineage samples using all data and following extraction of subclusters for (A) GATA1/GATA2 (tree shown in panel A is that same as in panels B and C), (B) MITF, and (C) MRGPRX2. The algorithm is described in the supplemental Methods. More detailed, higher-resolution versions are provided as supplemental Figures 3-5.
Figure 4
Figure 4
MCs in the hematopoietic network. (A) Principal component analysis of 49 blood samples of the FANTOM5 data set (H9 embryonic stem cells are included for further comparison) as described in supplemental Methods. The first 3 principal components (PCs) explain 82.3% of the total variance (see supplemental Methods). (B) Means of all pairwise Pearson correlation coefficients for each sample pair as described in supplemental Methods. The mean coefficients of MCs vs other blood samples that are >0.7 are depicted in red. (C) Venn diagram with the number of genes expressed at higher level (red/green-within-red areas), and at lower level in basophils vs ex vivo MCs (cyan/green-within-cyan areas) and nondifferentially expressed RefSeq genes (purple/green-within-purple areas). The genes are specified in supplemental Table 8. The green areas denote the number of TF genes in each group. Five indicative TFs are given for each cell. (D) Significant protein class terms (α = 5%) of the differentially expressed groups.

Comment in

Similar articles

Cited by

References

    1. Brown JM, Wilson TM, Metcalfe DD. The mast cell and allergic diseases: role in pathogenesis and implications for therapy. Clin Exp Allergy. 2008;38(1):4–18. - PubMed
    1. Galli SJ, Tsai M. IgE and mast cells in allergic disease. Nat Med. 2012;18(5):693–704. - PMC - PubMed
    1. Navi D, Saegusa J, Liu FT. Mast cells and immunological skin diseases. Clin Rev Allergy Immunol. 2007;33(1-2):144–155. - PubMed
    1. Sayed BA, Christy A, Quirion MR, Brown MA. The master switch: the role of mast cells in autoimmunity and tolerance. Annu Rev Immunol. 2008;26:705–739. - PubMed
    1. Kneilling M, Röcken M. Mast cells: novel clinical perspectives from recent insights. Exp Dermatol. 2009;18(5):488–496. - PubMed

Publication types

Substances