. 2014 Apr 1;217(Pt 7):1094-107.
doi: 10.1242/jeb.092866.

Biophysics of directional hearing in the American alligator (Alligator mississippiensis)

Affiliations

Biophysics of directional hearing in the American alligator (Alligator mississippiensis)

Hilary S Bierman et al. J Exp Biol. .

Abstract

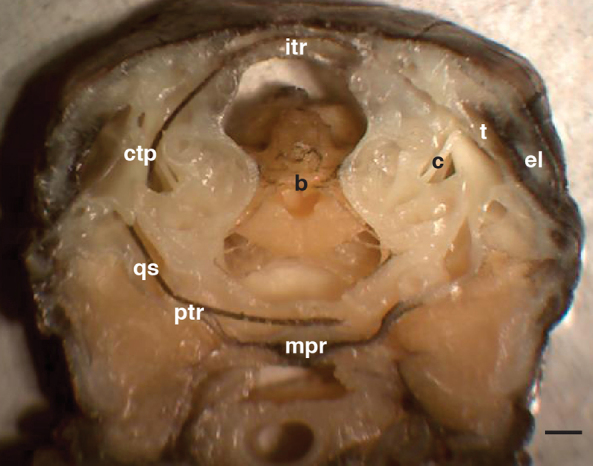
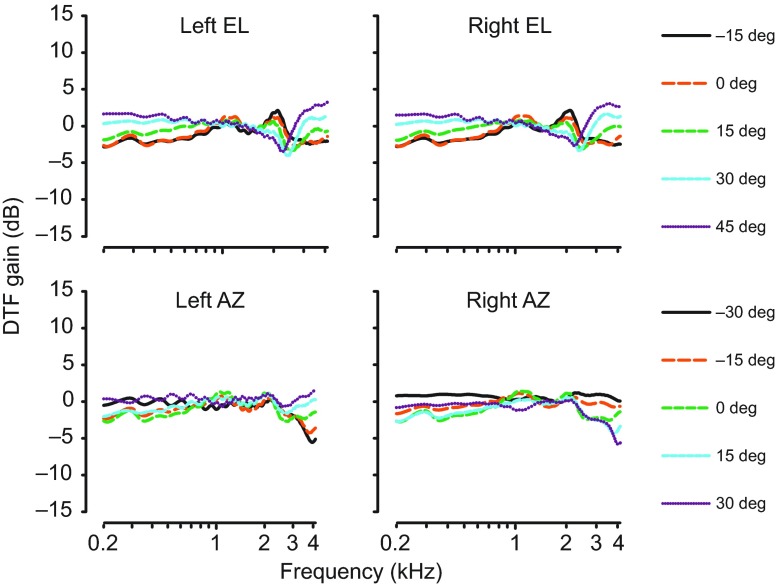
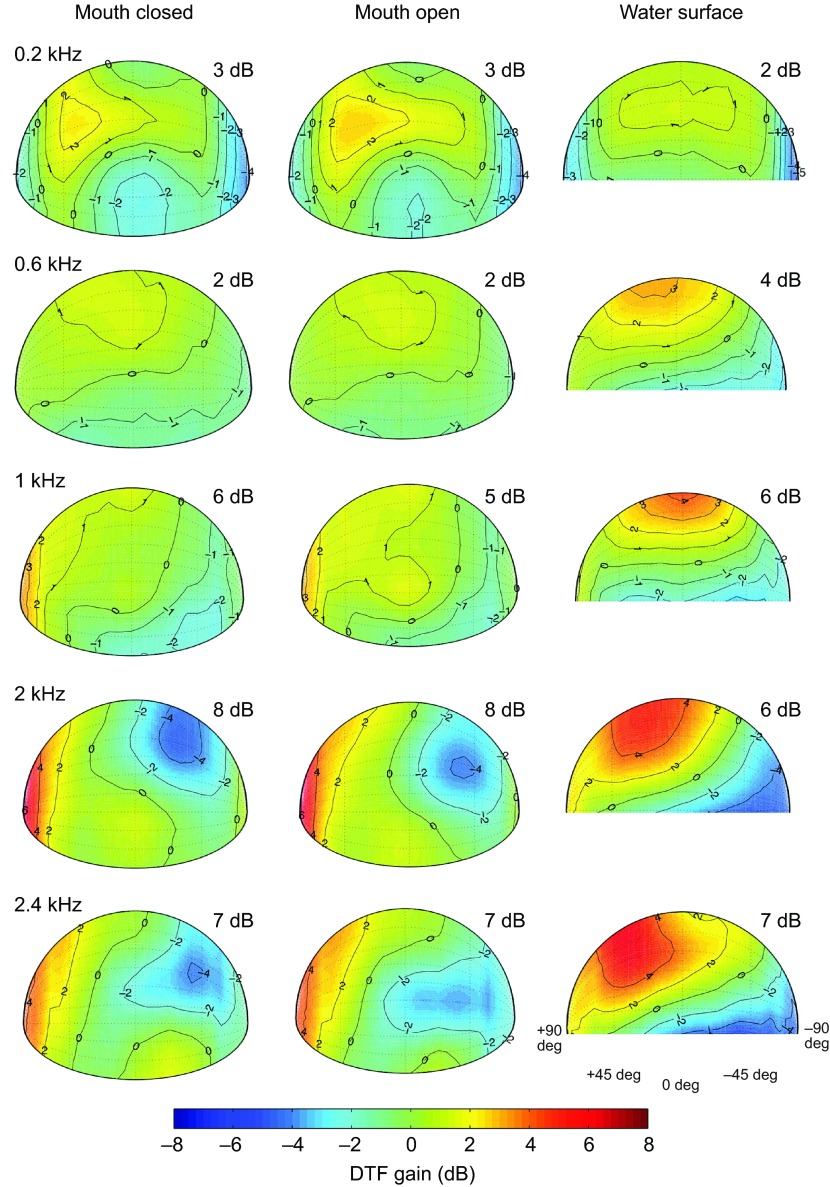
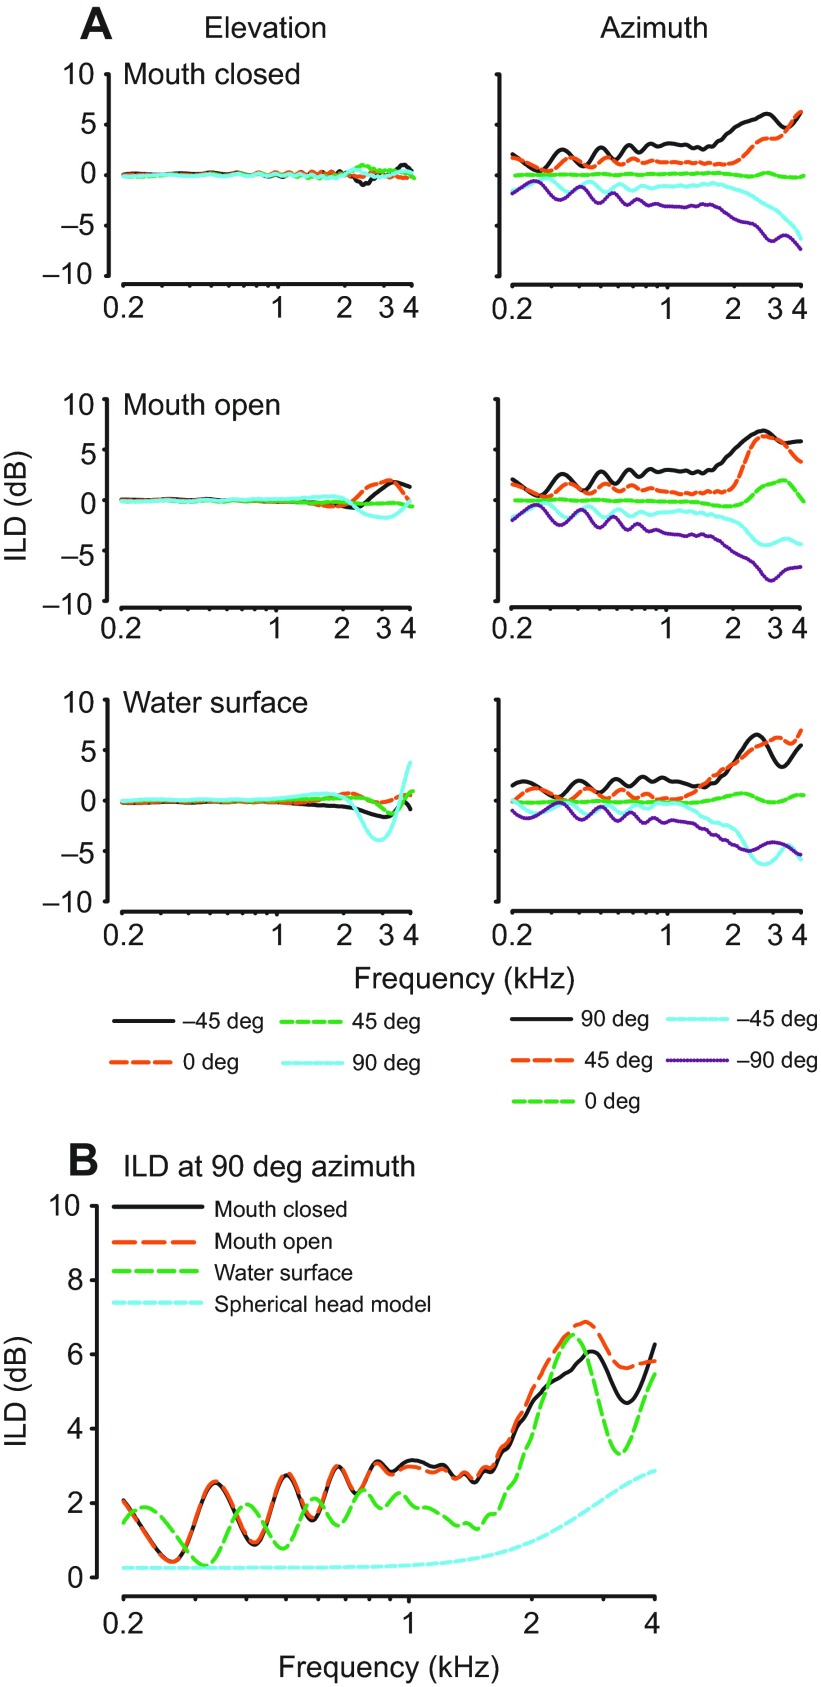
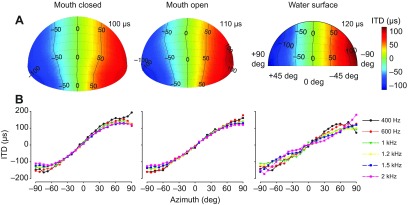
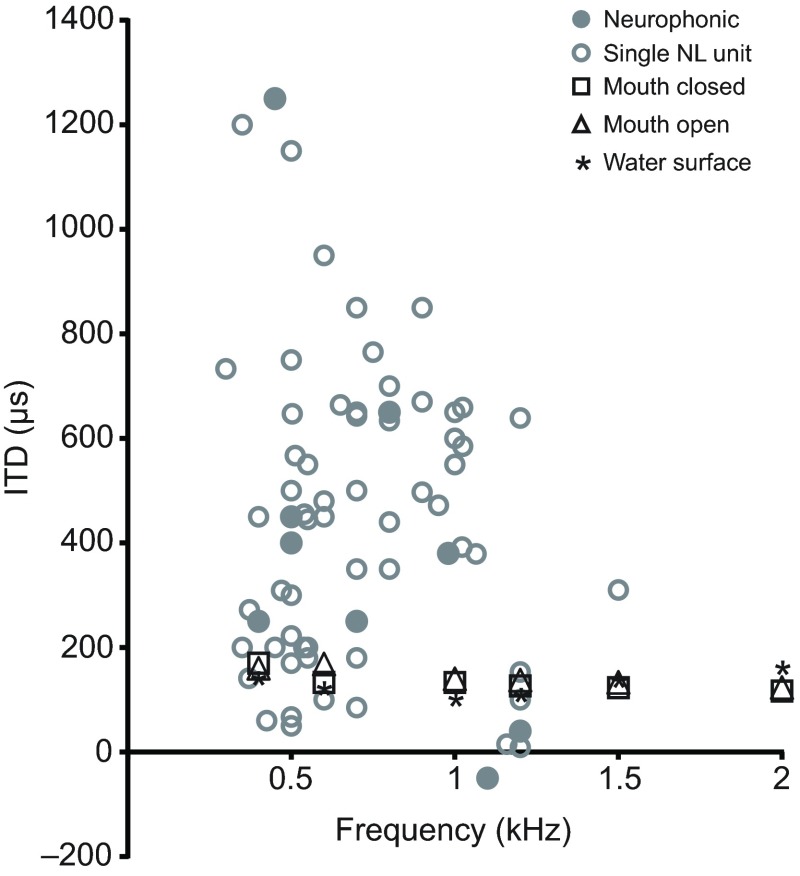
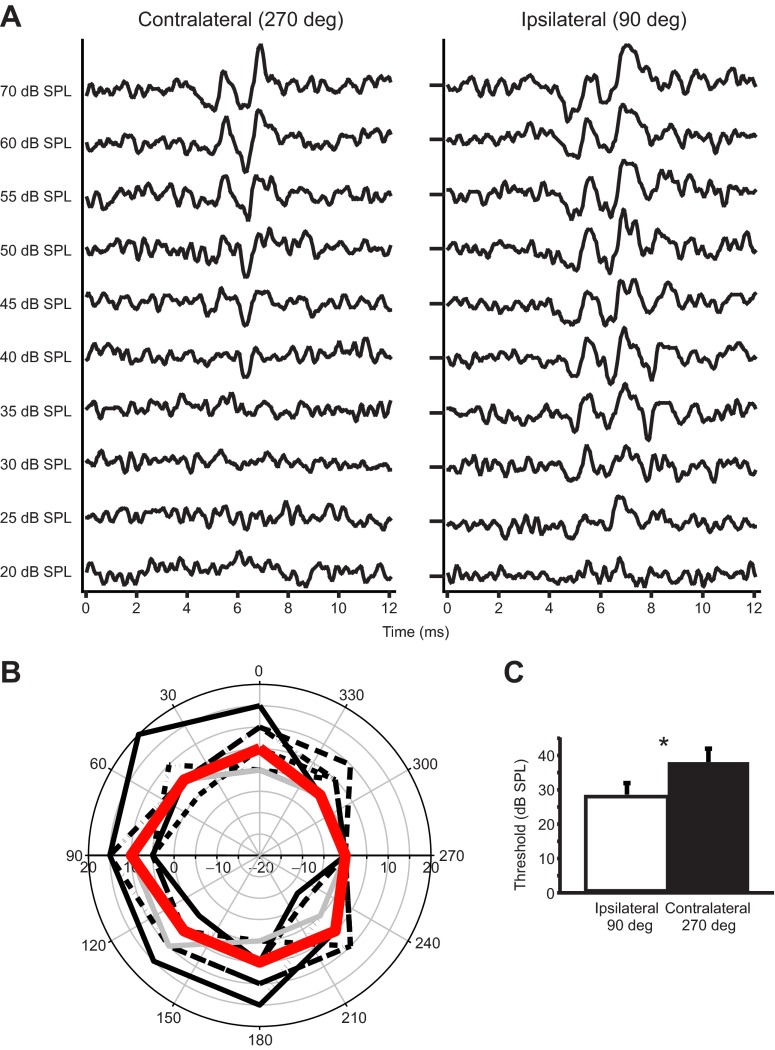
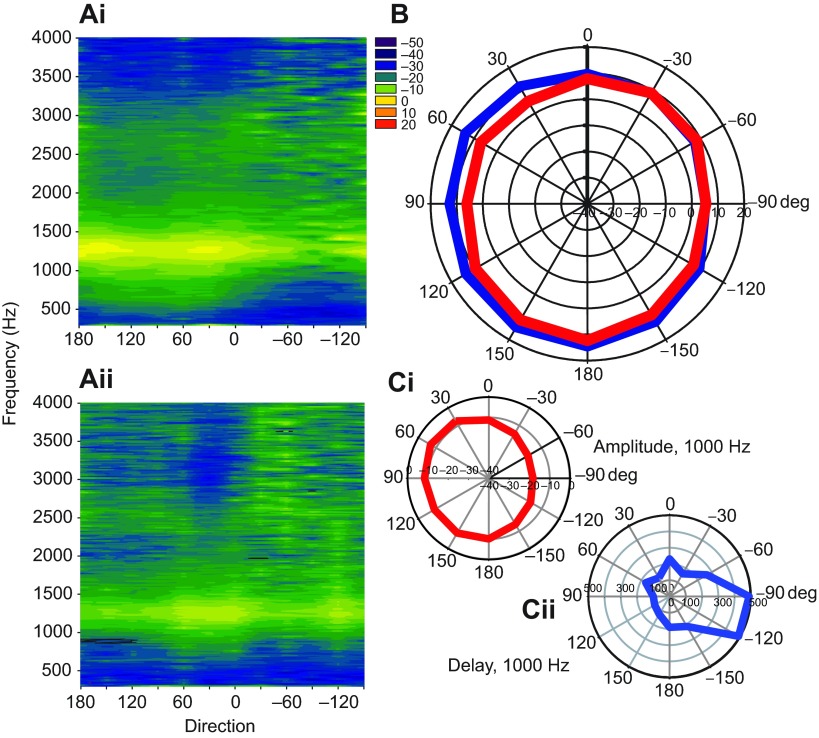
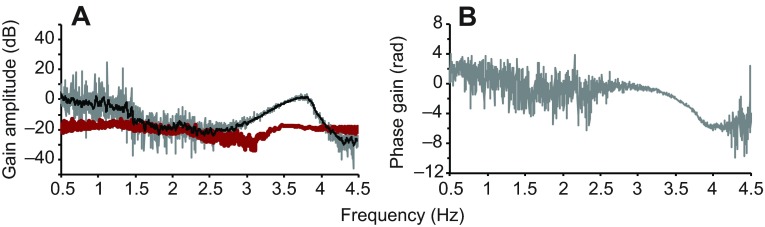
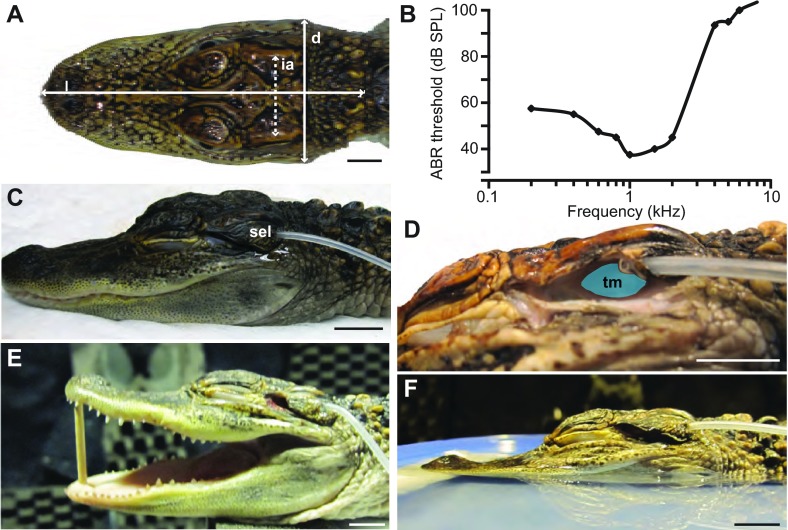
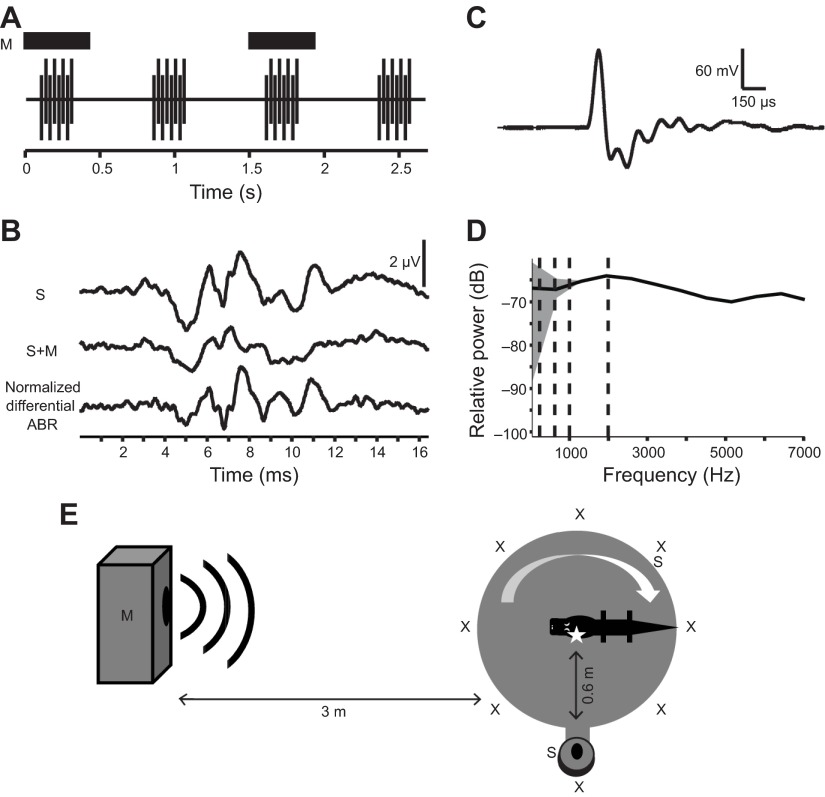
Physiological and anatomical studies have suggested that alligators have unique adaptations for spatial hearing. Sound localization cues are primarily generated by the filtering of sound waves by the head. Different vertebrate lineages have evolved external and/or internal anatomical adaptations to enhance these cues, such as pinnae and interaural canals. It has been hypothesized that in alligators, directionality may be enhanced via the acoustic coupling of middle ear cavities, resulting in a pressure difference receiver (PDR) mechanism. The experiments reported here support a role for a PDR mechanism in alligator sound localization by demonstrating that (1) acoustic space cues generated by the external morphology of the animal are not sufficient to generate location cues that match physiological sensitivity, (2) continuous pathways between the middle ears are present to provide an anatomical basis for coupling, (3) the auditory brainstem response shows some directionality, and (4) eardrum movement is directionally sensitive. Together, these data support the role of a PDR mechanism in crocodilians and further suggest this mechanism is a shared archosaur trait, most likely found also in the extinct dinosaurs.

Keywords: ABR; Archosaur; Auditory; Bird; Dinosaur; HRTF; Middle ear; Pressure-receiver; Vibrometry.


Figures

Fig. 1.
Fig. 1.
Thick coronal slice through the skull of a young alligator. A single piece of brown suture has been threaded through the contiguous intertympanic recess (itr), caudal tympanic recess (ctp), quadrate sinus (qs), pharyngotympanic (Eustachian) recess (ptr) and median pharyngeal recess (mpr). For reference, the brain cavity (b), columella (c), tympanic membrane (t) and earlid (el) have been labeled unilaterally. The top of the image is dorsal. Scale bar, 1 mm.
Fig. 2.
Fig. 2.
Monaural broadband spectral shape cues. Plots of directional transfer function (DTF) gains from a single animal (0006F264B5), for left and right ears, across elevation (EL) and azimuth (AZ) during the mouth-closed condition. No systematic changes in spectral notches were observed across frequency while increasing elevation or azimuth. Within the animal's hearing range, approximately ≤2 kHz, gains were close to zero and relatively flat across elevation and azimuth levels.
Fig. 3.
Fig. 3.
Spatial DTF across azimuth and elevation for five frequencies (rows) and three conditions (columns). The color bar indicates the gain in decibels. The maximum gain is noted in the upper right corner of each plot. Mouth closed, animal 0006F264B5; mouth open, animal 0006F26A75; water surface, animal 0006F2279C. All plots are from right ear recordings. Spatial plots were produced such that the nose of the animal is considered to project in the 0 deg position.
Fig. 4.
Fig. 4.
The interaural level difference (ILD) spectrum along azimuth and elevation. (A) ILD gain across spatial locations, calculated for each of the conditions (mouth closed, animal 0006F264B5; mouth open, animal 0006F26A75; water surface, animal 0006F2279C), is relatively flat within the animal's hearing range. (B) Comparison between the three conditions and a spherical head model at 90 deg azimuth.
Fig. 5.
Fig. 5.
Spatial distribution of ILD across azimuth and elevation for five frequencies (rows) and three conditions (columns). Values were calculated by subtracting the right ear DTF from the left ear DTF. The color bar indicates the gain in decibels. The maximum gain is noted in the upper right corner of each plot. ILD gain increases and becomes more localized at higher frequencies. ILD gain in the water surface condition is less localized. Mouth closed, animal 0006F264B5; mouth open, animal 0006F26A75; water surface, animal 0006F2279C. Spatial plots were produced such that the nose of the animal is considered to project in the 0 deg position.
Fig. 6.
Fig. 6.
Distribution of ITD across spatial locations. (A) Spatial plots of ITD, measured using a maximum length sequence (MLS), across azimuth and elevation for the three conditions. The color bar indicates the range of ITD. The maximum ITD is noted in the upper right corner of each plot. (B) ITDs measured using short-duration pure-tone stimuli were plotted as a function of azimuth across a range of relevant frequencies for all three conditions. For both A and B: mouth closed, animal 0006F264B5; mouth open, 0006F26A75; water surface, 0006F2279C. Spatial plots were produced such that the nose of the animal is considered to project in the 0 deg position.
Fig. 7.
Fig. 7.
Comparison of acoustically measured ITDs with neurophysiologically recorded ITDs. Acoustical ITD measurements come from tone stimulus data presented in Fig. 6B. ITD values from neurophonic and single-unit nucleus laminaris (NL) recordings have been reproduced from Carr et al. (Carr et al., 2009).
Fig. 8.
Fig. 8.
Directional auditory brainstem response (ABR) recordings at 1000 Hz. (A) The normalized differential signal, which was recorded with decreasing masking tone levels at two heading directions. Ipsilateral and contralateral refer to the position of the masker speaker with respect to the recording ear and stimulus speaker. (B) Polar plots [individual (black) and median (red)] of 1000 Hz directional sensitivity measured in nine animals. All values were normalized by subtracting ABR thresholds at different masker directions from the contralateral (270 deg) threshold. The contralateral threshold thus is fixed at 0 dB, and lower thresholds (i.e. higher sensitivity) yield more positive values, for easy comparison with the eardrum directionality. (C) Paired single-tailed f-test using data in B, showing that ABR threshold is significantly higher when the masking tone is contralateral to the recording electrode and stimulus, P=0.0001. Error bars are standard deviation.
Fig. 9.
Fig. 9.
Eardrum vibration in response to free-field sound stimuli. (Ai) Cylindrical surface plot of the eardrum vibration transfer function showing eardrum vibration velocity transfer function (color scale, in dB re. 1 mms−1 Pa−1) as a function of direction (x-axis, positive angles are ipsilateral, negative contralateral, the animal facing 0 deg) and frequency (y-axis). (Aii) Plot in same animal following blockage of the contralateral eardrum shows altered sensitivity. (B) Polar plot of eardrum vibration velocity transfer function at 1 kHz with (red) and without (blue) blockage of the contralateral eardrum. Blockage of the contralateral ear significantly alters ipsilateral eardrum vibration amplitude except when the sound is presented adjacent to the ipsilateral ear (60, 90 and 120 deg). For all panels, the snout is at 0 deg, the tail is at 180 deg, the left/ipsilateral ear corresponds to positive degrees and the right/contralateral ear to negative degrees. (C) Polar plots of the averaged eardrum vibrations (transfer functions) to 1 kHz directional sound in five alligators. (Ci) Eardrum vibration amplitudes. (Cii) Eardrum transfer function phases relative to the 90 deg (ipsilateral) direction are converted to delays by multiplying the phase difference by (2π×0.001 s). The delay at 90 deg was set to 100 μs.
Fig. 10.
Fig. 10.
Vibrometry measurements of amplitude (A) and phase (B) transmission gain through the head. For both A and B, three ipsilateral and three contralateral trials (10 averages/trial) were averaged, giving a sum of 30 ipsilateral and 30 contralateral averages used for the ratio calculation. (A) The moving 10-point average (black line) is higher than the amplitude gain measured using a probe microphone adjacent to the ipsilateral ear (red). (B) Phase gain measurements are shown for relevant frequencies and can be fitted to a line with slope of −0.001 (R2=0.82).
Fig. 11.
Fig. 11.
Photographs of the preparation setup and audiogram. (A) Illustration of the morphological measurements reported in Table 1: head diameter at the widest point (d), length of head (l) and the interaural distance (ia) measured as the distance between ear ridges. (B) In-air ABR audiogram based on data from Higgs et al. (Higgs et al., 2002), showing low frequency hearing specialization. (C) For auditory space measurements, the earlid was trimmed to achieve a naturalistic position. The microphone probe tube was threaded through the superior earlid (sel) and secured with liquid adhesive. (D) The earlid has been cut away to show the position of the probe with respect to the tympanic membrane (tm). (E) Image of the mouth-open condition (see Materials and methods for details). (F) For the water surface condition the head was positioned in a shallow plastic container filled with water to mimic a naturalistic floating position (see Materials and methods for details). Scales bars, 10 mm.
Fig. 12.
Fig. 12.
Directional masking ABR methodology. (A) ABRs are recorded in response to a brief broadband stimulus (S) in the presence and absence of a continuous tone masker (M, dark blocks). Stimuli are presented in trains of eight clicks with alternating polarity. (B) Responses from 400 presentations are averaged for both the stimulus (S) and stimulus plus masker (S+M) conditions. Sensitivity to the masker tone is computed by subtracting the averaged signals. The resulting differential signal is normalized to the amplitude of the stimulus response. (C,D) Digital recording (C) and power spectrum (D) of positive polarity modified click spectrum. The stimulus has been optimized so that the power spectra of the audible signal was relatively flat over the test frequencies and the amplitude was at the lowest level needed to produce a maximal response. (E) Directional sensitivity was measured by rotating the heading direction of the animal with respect to the masker sound source. The animal was restrained on a foam plank and placed on a rotating table. Attached to the table was an arm holding the stimulus speaker (S) 0.6 m from the center of the animal's head. A second, larger speaker, 3 m from the animal's head, was used to play the masker tones (M). Recordings were made with the animal facing eight heading directions (X). The placement of the recording electrode is identified with a star. (E is not drawn to scale.)

References

    1. Autrum H. (1940). Über lautäusserungen und schallwahrnehmung bei arthropoden II. Z. Vgl Physiol. 28, 326-352
    1. Aytekin M., Grassi E., Sahota M., Moss C. F. (2004). The bat head-related transfer function reveals binaural cues for sound localization in azimuth and elevation. J. Acoust. Soc. Am. 116, 3594-3605 - PubMed
    1. Batra R., Kuwada S., Fitzpatrick D. C. (1997). Sensitivity to interaural temporal disparities of low- and high-frequency neurons in the superior olivary complex. I. Heterogeneity of responses. J. Neurophysiol. 78, 1222-1236 - PubMed
    1. Bierman H. S., Carr C. E., Brandt C., Young B. A., Christensen-Dalsgaard J. (2011). Evidence for low-frequency sound localization in the American alligator (Alligator mississippiensis). In 2011 Neuroscience Meeting Planner. Washington, DC: Society for Neuroscience. Online;
    1. Boettcher F. A., Mills J. H., Norton B. L. (1993). Age-related changes in auditory evoked potentials of gerbils. I. Response amplitudes. Hear. Res. 71, 137-145 - PubMed

Publication types

MeSH terms

LinkOut - more resources