. 2014 Mar 26;34(13):4599-607.
doi: 10.1523/JNEUROSCI.4923-13.2014.

Efferent feedback slows cochlear aging

Affiliations

Efferent feedback slows cochlear aging

M Charles Liberman et al. J Neurosci. .

Abstract

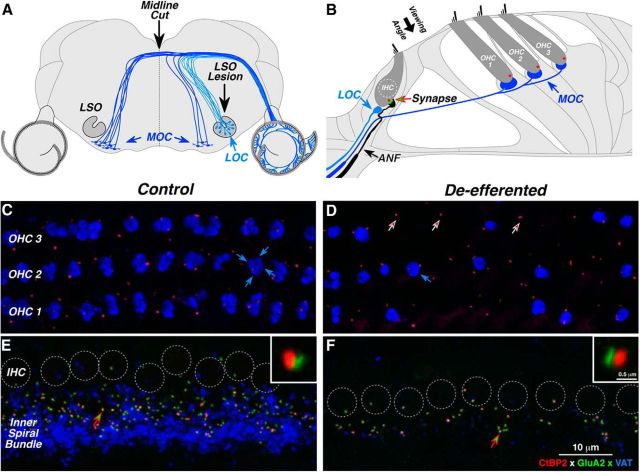
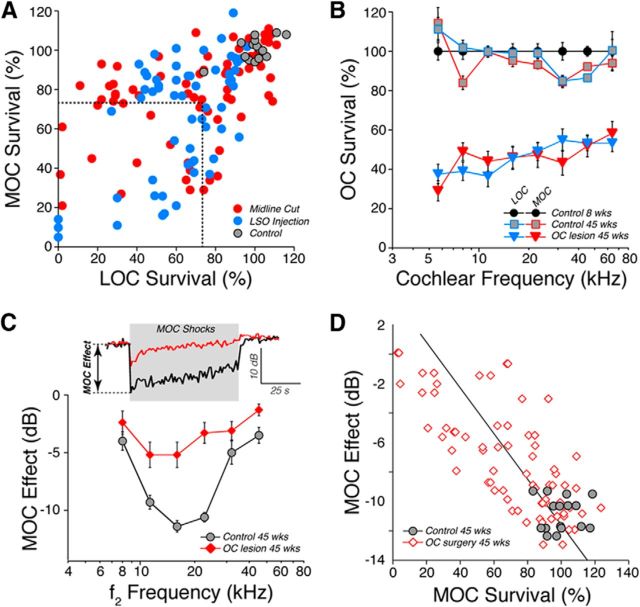
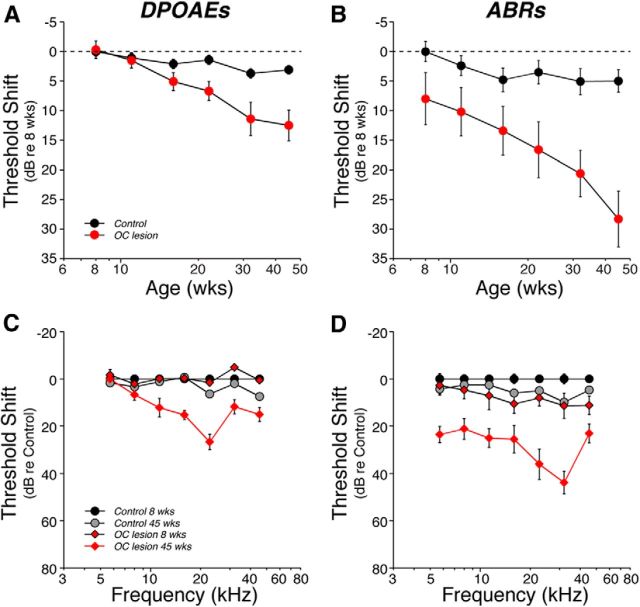
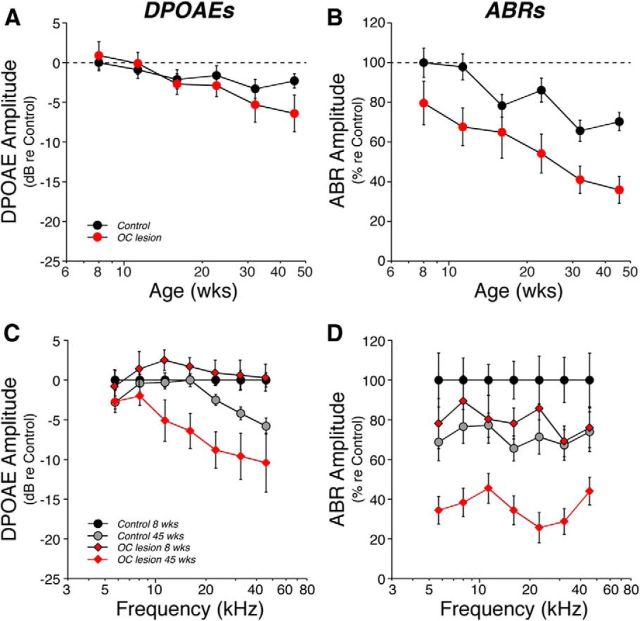
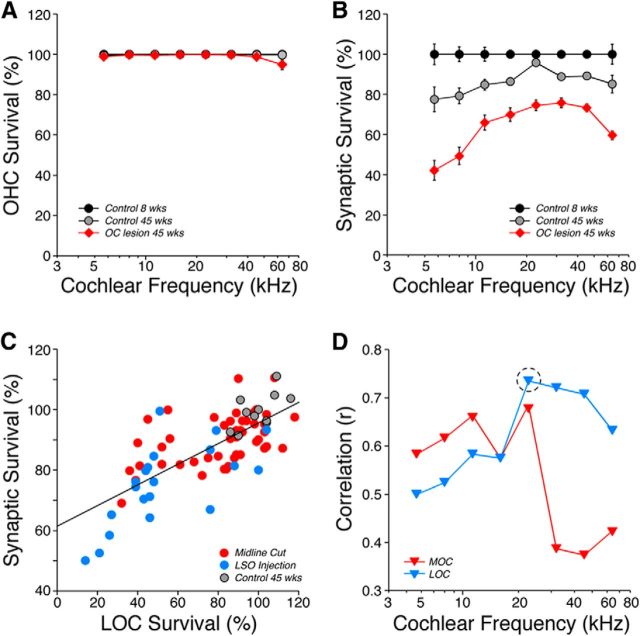
The inner ear receives two types of efferent feedback from the brainstem: one pathway provides gain control on outer hair cells' contribution to cochlear amplification, and the other modulates the excitability of the cochlear nerve. Although efferent feedback can protect hair cells from acoustic injury and thereby minimize noise-induced permanent threshold shifts, most prior studies focused on high-intensity exposures (>100 dB SPL). Here, we show that efferents are essential for long-term maintenance of cochlear function in mice aged 1 year post-de-efferentation without purposeful acoustic overexposure. Cochlear de-efferentation was achieved by surgical lesion of efferent pathways in the brainstem and was assessed by quantitative analysis of immunostained efferent terminals in outer and inner hair cell areas. The resultant loss of efferent feedback accelerated the age-related amplitude reduction in cochlear neural responses, as seen in auditory brainstem responses, and increased the loss of synapses between hair cells and the terminals of cochlear nerve fibers, as seen in confocal analysis of the organ of Corti immunostained for presynaptic and postsynaptic markers. This type of neuropathy, also seen after moderate noise exposure, has been termed "hidden hearing loss", because it does not affect thresholds, but can be seen in the suprathreshold amplitudes of cochlear neural responses, and likely causes problems with hearing in a noisy environment, a classic symptom of age-related hearing loss in humans. Since efferent reflex strength varies among individuals and can be measured noninvasively, a weak reflex may be an important risk factor, and prognostic indicator, for age-related hearing impairment.

Keywords: auditory neuropathy; feedback; hair cells; hearing conservation.


Figures

Figure 1.
Figure 1.
Sound levels in the Animal Care Facility. Ambient sound pressure levels over one 24 h period on a weekday or a weekend, as indicated in the panel. Levels were measured in half-octave bands, as shown in the key. Each sample was 100 ms in duration.
Figure 2.
Figure 2.
Immunostaining of the cochlear efferent and afferent innervation in normal and de-efferented cases. A, Brainstem schematic shows the central origins of LOC and MOC efferents. Efferent pathways were lesioned via midline cut of MOC fibers at the floor of the IVth ventricle or by neurotoxin injection into the LSO where LOC fibers originate. B, Organ of Corti schematic shows the peripheral targets of cochlear efferents. MOC terminals synapse with outer hair cells (OHCs); LOC terminals synapse with auditory nerve fibers (ANFs) near their afferent synapses with the inner hair cell (IHC). Each IHC–ANF synapse is identifiable by its presynaptic ribbon (red) and postsynaptic glutamate receptors (green). The small population of cochlear nerve fibers (<5%) that contact OHCs are not shown. C–F, The success of de-efferentation was assessed by immunostaining cochlear efferent terminals with antibodies for VAT (blue); IHC-ANF synapses were stained for a protein in the presynaptic ribbon (CtBP2; red) and an AMPA postsynaptic glutamate receptor (GluA2; green). Each image is a maximum projection of a focal series through the synaptic region of the OHCs (C, D) or IHCs (E, F), from the viewing angle schematized in B. Each control OHC (C) is innervated by a cluster of 1–4 MOC terminals (e.g., blue arrows); in the de-efferented ear (D), many OHCs have no MOC endings, but presynaptic ribbons remain near the ANF terminals (e.g., at arrows). In the IHC area (E, F), individual sensory cells are difficult to distinguish, so their nuclei are indicated by dashed circles. In the control ear (E), cochlear nerve synapses are seen as paired red-green puncta in the subnuclear zone, just above the LOC terminals in the inner spiral bundle. In the de-efferented ear (F), synaptic counts are reduced, and the LOC innervation is almost completely eliminated. In each IHC panel, one synapse (at the arrow) is shown at higher magnification in the inset. Scale bar in F applies to all large images. Scale bar in one inset applies to both. All images are from the middle of the cochlear spiral (16 kHz). D is from a midline-cut case; F is from an LSO lesion case.
Figure 3.
Figure 3.
Histological and physiological assessment of the degree of de-efferentation. A, Mean survival of MOC vs LOC terminals at 45 weeks of age. For each ear, confocal image stacks (e.g., Fig. 1C–F) were obtained from 8 cochlear locations (see B). MOC and LOC innervation was quantified in each stack as described in Materials and Methods and then averaged into three regions: apex (5.6–8.0 kHz), middle (11.3–32 kHz), and base (45–64 kHz). Regional values in each case are expressed as “survival” by normalizing to regional mean values for young (8 week) Controls (n = 6). Cochlear regions with <75% survival of both LOC and MOC terminals (dashed lines) were classified as OC Lesion (n = 44 surgical cases). Each region from each case generates one point in A and was considered independently for this and all subsequent analyses. B, The degree of de-efferentation in OC Lesion regions was relatively uniform throughout the cochlear spiral. Group mean data (±SEM) are normalized as described in A. Differences between the OC Lesion group and age-matched controls were highly significant at all frequencies (p ≪ 0.001). C, To measure MOC effects in vivo, DPOAEs were measured before, during, and after a 70 s train of shocks to the OC bundle (gray box). Response amplitudes are normalized to preshock values, and the size of MOC suppression is defined as shown for one sample run. Mean MOC effects (±SEM) are shown as a function of stimulus frequency (f2) for OC Lesion regions (defined in A) compared with control (n = 14). Intergroup differences were significant at the p ≪ 0.01 level for test frequencies at 11.3, 16, 22.6 and 45.2 kHz. D, The size of the MOC effect in individual cases, shown here for f2 = 22.6 kHz, correlates (r = 0.76) with survival of MOC innervation in the appropriate cochlear region of the same ear. For D, data are shown from controls and all surgical cases where DPOAEs were robust enough to record shock-evoked MOC effects (n = 41).
Figure 4.
Figure 4.
Age-related threshold shift was more pronounced in de-efferented regions, especially as measured via ABRs. A, B, Mean threshold shift (±SEM) vs age for Control vs OC Lesion groups, as seen via DPOAEs (A) or ABRs (B). Data from each group are averaged across all test frequencies. C, D, Mean cochlear threshold shift (±SEM) vs frequency for Control vs OC Lesion groups as seen via DPOAEs (C) or ABRs (D). For DPOAEs, differences between the OC Lesion group at 45 weeks and age-matched controls were significant at the p ≪ 0.01 level for 11.3, 16, 22.6, and 32 kHz; differences at 45.2 kHz were significant at the p < 0.05 level. For ABRs, differences were significant at the p < 0.01 level for 5.6, 8, 22.6, and 32 kHz, and at the p < 0.05 level for 11.3, 16, and 45.2 kHz. All data are normalized to the mean values for each group at 8 weeks. OC Lesion group is defined as shown in Figure 3A. Group sizes are as described in Figure 3.
Figure 5.
Figure 5.
Age-related decrements in cochlear response amplitudes were more pronounced in de-efferented regions, especially as measured via ABRs. Suprathreshold response amplitudes vs age (A, B) or frequency (C, D) for each group as seen via DPOAEs (A, C) or ABRs (B, D). For each measure, responses at 60–80 dB SPL were averaged and normalized with respect to the mean values for 8 week Controls. For A and B, responses were averaged across all frequencies. C, DPOAE differences between the OC Lesion group at 45 weeks and age-matched controls were significant at the p < 0.01 level for 16, 22.6, and 32 kHz, and at the p < 0.05 level for 11.3 kHz. D, Differences between the OC Lesion group at 45 weeks and age-matched controls were significant at the p ≪ 0.01 level for all frequencies except 11.3, which was significant at the p < 0.05 level. For ABRs, only the amplitude of Wave 1 was considered. OC Lesion group is defined as described in Figure 3A. Group sizes are as described in Figure 3. All data are group means (±SEM).
Figure 6.
Figure 6.
Age-related loss of afferent synapses was increased in de-efferented ears, and both LOC and MOC systems appear to contribute to survival. A, Mean outer hair cell (OHC) loss (±SEMs) at 45 weeks in control and de-efferented groups. B, Mean counts of afferent synapses in the inner hair cell (IHC) area (± SEMs), normalized to the values in young (8 week) control ears to estimate percentage survival. OC Lesion group in A and B is defined as shown in Figure 2A. The differences in synaptic survival between the OC Lesion group and age-matched controls was highly significant (p ≪ 0.01) at all frequency regions. C, The correlation, in the 22 kHz region at 45 weeks, between LOC survival (from Fig. 2A) and cochlear-nerve synapse survival. Each point is from a different ear; the best-fit straight line is shown (r = 0.73). Data are included from controls and all ears targeted by OC surgery (n = 42); i.e., both ears after midline cuts and the ipsilateral ear after LSO lesions (Fig. 3A). D, Correlation coefficients, as a function of cochlear frequency, between cochlear-nerve synaptic loss and either MOC or LOC survival. The dashed circle shows the value derived from the data in C.

Similar articles

Cited by

References

    1. Backus BC, Guinan JJ., Jr Measurement of the distribution of medial olivocochlear acoustic reflex strengths across normal-hearing individuals via otoacoustic emissions. J Assoc Res Otolaryngol. 2007;8:484–496. doi: 10.1007/s10162-007-0100-0. - DOI - PMC - PubMed
    1. Bohne BA, Rabbitt KD. Holes in the reticular lamina after noise exposure: implication for continuing damage in the organ of Corti. Hear Res. 1983;11:41–53. doi: 10.1016/0378-5955(83)90044-8. - DOI - PubMed
    1. Brown MC. Fiber pathways and branching patterns of biocytin-labeled olivocochlear neurons in the mouse brainstem. J Comp Neurol. 1993;337:600–613. doi: 10.1002/cne.903370406. - DOI - PubMed
    1. Chambers AR, Hancock KE, Maison SF, Liberman MC, Polley DB. Sound-evoked olivocochlear activation in unanesthetized mice. J Assoc Res Otolaryngol. 2012;13:209–217. doi: 10.1007/s10162-011-0306-z. - DOI - PMC - PubMed
    1. Chays A, Magnan J, Maison S. Absence d'efférences olivocochléaires dans les prélèvements de nerf vestibulaire du patient neurotomisé. JFORL. 2002;51:145–150.

Publication types

MeSH terms