. 2014 Mar 26;34(13):4654-64.
doi: 10.1523/JNEUROSCI.5026-13.2014.

Cholinergic inputs from Basal forebrain add an excitatory bias to odor coding in the olfactory bulb

Affiliations

Cholinergic inputs from Basal forebrain add an excitatory bias to odor coding in the olfactory bulb

Markus Rothermel et al. J Neurosci. .

Abstract

Cholinergic modulation of central circuits is associated with active sensation, attention, and learning, yet the neural circuits and temporal dynamics underlying cholinergic effects on sensory processing remain unclear. Understanding the effects of cholinergic modulation on particular circuits is complicated by the widespread projections of cholinergic neurons to telencephalic structures that themselves are highly interconnected. Here we examined how cholinergic projections from basal forebrain to the olfactory bulb (OB) modulate output from the first stage of sensory processing in the mouse olfactory system. By optogenetically activating their axons directly in the OB, we found that cholinergic projections from basal forebrain regulate OB output by increasing the spike output of presumptive mitral/tufted cells. Cholinergic stimulation increased mitral/tufted cell spiking in the absence of inhalation-driven sensory input and further increased spiking responses to inhalation of odorless air and to odorants. This modulation was rapid and transient, was dependent on local cholinergic signaling in the OB, and differed from modulation by optogenetic activation of cholinergic neurons in basal forebrain, which led to a mixture of mitral/tufted cell excitation and suppression. Finally, bulbar cholinergic enhancement of mitral/tufted cell odorant responses was robust and occurred independent of the strength or even polarity of the odorant-evoked response, indicating that cholinergic modulation adds an excitatory bias to mitral/tufted cells as opposed to increasing response gain or sharpening response spectra. These results are consistent with a role for the basal forebrain cholinergic system in dynamically regulating the sensitivity to or salience of odors during active sensing of the olfactory environment.

Keywords: acetylcholine; mitral cell; modulation; odor coding; optogenetics.


Figures

Figure 1.
Figure 1.
Selective targeting of cholinergic inputs from basal forebrain to the OB. A, Left, Cholinergic neurons in basal forebrain and striatum visualized in a ChAT-Cre:Rosa-tdTomato (Ai9) reporter cross. The coronal section was taken at ∼0.74 bregma. Right, Magnification of HDB region showing relatively sparse expression of ChAT+ neurons. VDB, Vertical limb of the diagonal band of Broca; MS, medial septum; LSV, lateral septum, ventral part; CPu, striatum; Acb, nucleus accumbens; Tu, olfactory tubercle. All images are confocal stacks from fixed sections. B, Left, Coronal section through basal forebrain (approximately the same area as in A) in a ChAT-Cre mouse given an injection of Cre-dependent AAV-ChR2-EYFP virus. ChR2-EYFP expression is localized to HDB. In this animal, injection led to ChR2-EYFP expression in neurons in an ∼300 μm3 area around the injection site. Right, Magnification of HDB region in this mouse showing extensive processes of ChAT+ neurons. C, Double labeling with ChR2-EYFP and tdTomato fluorescence in ChAT+ neurons obtained by injecting AAV-ChR2-EYFP into HDB of a ChAT-Cre:Ai9 reporter cross. Red, tdTomato; green, ChR2-EYFP. Note that all ChR2-EYFP-expressing neurons are ChAT+ as reported by tdTomato. D, ChR2-EYFP-expressing axon terminals in the OB imaged 4 weeks after AAV-ChR2-EYFP injection into HDB of a ChAT-Cre mouse. GL, glomerular layer; EPL, external plexiform layer; MCL, mitral cell layer; IPL, internal plexiform layer. E, ChR2-EYFP fluorescence in axon terminals in anterior olfactory nucleus (AON) after AAV-ChR2-EYFP injection into HDB of a ChAT-Cre mouse.
Figure 2.
Figure 2.
Optogenetic activation of cholinergic inputs to the OB enhances MTC excitability. A, Top, Schematic of experimental approach. See Materials and Methods for details. Bottom, Spike rate histogram (bin width, 50 ms) from a presumptive MTC showing spontaneous spiking in the absence of inhalation (no sniff). Spike rate increases during optical stimulation of the dorsal OB (“stim”, blue shaded area). B, Plot of spontaneous firing rate in the 9 s before (no stim) and during (stim) optical stimulation for all tested units (n = 57). Filled circles indicate units subjected to a unit-by-unit test for significant effects of HDB stimulation (≥5 trials per condition per unit). Open circles indicate units tested with three to four trials. C, Time course of change in firing rate (mean ± SEM across all units) during optical stimulation (blue bar). The trace indicates change in mean spike rate in 1 s bins relative to the mean rate before stimulation. The time axis is relative to time of stimulation onset. D, Plot of spontaneous firing rate of MTCs (n = 54) recorded in urethane-anesthetized mice before and during optical stimulation and analyzed as in B. E, Quantitative comparison of spontaneous firing rates at before (baseline) and after AchR blocker application measured before (no stim) and during (light stim) optical stimulation. Open circles, firing rates for individual units; filled bars, mean value. Lines connect the same unit across conditions. The asterisk indicates significant difference by two-way ANOVA (see Results). F, OB section from a control, uninjected (no inject) ChAT-Cre mouse showing absence of axonal fluorescence in the OB. Laser power and detector gain was set higher to confirm absence of axonal fluorescence, revealing autofluorescent monocytes throughout the OB (bright points). GL, Glomerular layer; EPL, external plexiform layer; MCL, mitral cell layer; IPL, internal plexiform layer. G, Plot of spontaneous firing rate of MTCs in control mice before and during optical stimulation of the OB (n = 41 units), recorded and analyzed as in B. H, Time course of firing rate change across all recorded MTCs during optical stimulation in control mice.
Figure 3.
Figure 3.
Optogenetic activation of cholinergic OB inputs enhances sensory-evoked excitation. A, Spike raster and rate histogram of MTC spiking during inhalation of clean air and optical stimulation (blue shaded area) in six repeated trials. The spike rate was calculated per 50 ms bin. Inhalation-evoked spike rates increase during optical stimulation and return to baseline within 5–10 s after stimulation ceases. The top trace (sniff) shows artificial inhalation as measured by a pressure sensor connected to the nasopharyngeal cannula. B, Plot of inhalation-evoked firing rates during air inhalation, averaged for the nine inhalations just before (no stim) and after (stim) optical stimulation (n = 20 units). Data were analyzed and plotted as in Figure 2. C, Sniff-triggered spike histogram of MTC spikes aligned to the start of inhalation of clean air before (blue) and after (red) optical stimulation, normalized to the maximum bin in the no-stimulation condition. Bin width, 100 ms. The histogram is compiled from all units, with firing rate normalized separately for each unit. Note that the relative increase in spike rate at the peak bin is larger than the relative increase of the baseline bins immediately after inhalation. Inset, Sniff-triggered histogram normalized to the maximum and minimum bin for both conditions independently, showing no change in spiking dynamics after OB stimulation. D, Odorant-evoked MTC spiking is enhanced by optical OB stimulation. This example MTC shows a moderately increased firing rate in response to odorant presentation in baseline conditions (top) and strongly increased odorant-evoked firing rates during optical stimulation (bottom). The histogram is the average of five trials. E, Plot of odorant-evoked changes in MTC spiking (Δ spikes/sniff) in the absence of (no stim) and during (stim) optogenetic stimulation of cholinergic afferents to the OB (n = 92 units). F, Odorant response magnitudes (Δ spikes/s) plotted for baseline (blue) and optical stimulation (red) as a function of cell identity, sorted in order of magnitude of excitatory response in baseline conditions. Note that all units show an increase or no change in odorant-evoked excitation, including those that are suppressed during odorant presentation. Shown is the same dataset as in E. G, Spike histograms for two additional units showing that optical OB stimulation increases spike rate even for neurons that show a null (Unit 3, left) or suppressive (Unit 4, right) response to odorant. H, Time course of effects of optical stimulation on odorant-evoked spike rate, averaged across all units. The blue bar shows time of optical stimulation and simultaneous odorant presentation. The darker trace shows mean change in odorant-evoked spike rate between trials with and without light stimulation, measured after each inhalation (at 1 Hz); the shaded area indicates variance (SEM) around mean. The lighter trace (spont) shows light-evoked change in the spontaneous firing rate in the absence of inhalation, reproduced from Figure 2C. I, Sniff-triggered spike histogram of MTC spikes during odorant presentation in baseline conditions (blue) and during optical OB stimulation (red), normalized and plotted as in C. Inset, Sniff-triggered histogram normalized to the maximum and minimum bin for both conditions independently.
Figure 4.
Figure 4.
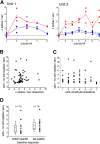
Optogenetic activation of cholinergic OB inputs enhances MTC odorant responses independent of absolute or relative odorant response strength. A, Effect of OB optical stimulation on odorant response spectrum for two MTCs tested with five (left) or seven (right) odorants. Blue, Baseline response; red, response during optical stimulation. Odorants are ordered separately for each unit, with the strongest excitatory response in the baseline condition in the middle of the abcissa. For each unit, the effect of optical stimulation varies with odorant but is always excitatory, even for odorants that suppress spiking under baseline conditions (e.g., odorants 1, 2, 6, and 7 in example 2). Circles indicate firing rates for each trial; lines connect median responses across all tested trials. B, Plot of optically induced change in odorant-evoked spike rate (stim − no stim) versus magnitude of the MTC response to odorant in baseline conditions (Δ spikes/s). Each point represents one cell–odorant pair. C, Ordinal plot of optically induced change in odorant-evoked spike rate (stim − no stim; same cell–odorant pairs as in B) as a function of rank order of MTC excitation relative to all odorants tested for that cell. A rank of 1 indicates the strongest response of all tested odorants. D, Box plot comparing optically induced change in odorant-evoked spike rate (stim − no stim) for the strongest and weakest quartile of baseline odorant-evoked responses taken from all cell–odorant pairs. The box indicates median, 25–75th percentile ranges of the data, and whiskers indicate ± 1 SD from the mean. Individual data points are shown to the right of each box.
Figure 5.
Figure 5.
Enhanced MTC excitation by cholinergic OB inputs in ChAT-ChR2 mice. A, OB section from a ChAT-ChR2 mouse showing weak Chr2-EYFP native fluorescence in sparsely distributed axon terminals in the OB (arrows). GL, glomerular layer; EPL, external plexiform layer; MCL, mitral cell layer; IPL, internal plexiform layer. B, Plot of spontaneous firing rate before (no stim) and during (stim) optical OB stimulation for MTCs (n = 24) recorded in ChAT-ChR2 transgenic mice, analyzed and plotted as in Figure 2B, showing an increase in MTC spiking during optical stimulation. C, Plot of inhalation-evoked peak firing rates during air inhalation before and during optical stimulation in ChAT-ChR2 mice (n = 34 units), analyzed and plotted as in Figure 3B. D, Plot of odorant-evoked changes in MTC spiking (Δ spikes/s) in the absence (no stim) and during (stim) optogenetic stimulation in ChAT-ChR2 mice (n = 33 units). E, Schematic of experimental approach for optical stimulation of cholinergic neurons in HDB of ChAT-ChR2 mice. See Materials and Methods for details. F, Plot of MTC firing rates during air inhalation measured for the 30 s before and during optical stimulation of HDB in urethane-anesthetized ChAT-ChR2 mice (n = 33 units). Data are plotted on a linear scale to facilitate comparison with a similar dataset from Ma and Luo (2012). G, Cumulative probability plots comparing change in MTC firing rates caused by optical stimulation of OB or HDB. Plots reflect datasets plotted in C and F, respectively. HDB stimulation reduces spike rates in ∼60% of units, whereas none are decreased by OB stimulation. H, Time course of effects of optical stimulation on MTC spike rate during air inhalation, averaged across all units. The blue bar shows time of 30 s optical stimulation. The trace shows mean difference in the peak firing rate between trials with and without light stimulation, measured after each inhalation (at 1 Hz); the shaded area indicates variance (SEM) around mean. Compare with Figure 3H.

Similar articles

Cited by

References

    1. Boyd AM, Sturgill JF, Poo C, Isaacson JS. Cortical feedback control of olfactory bulb circuits. Neuron. 2012;76:1161–1174. doi: 10.1016/j.neuron.2012.10.020. - DOI - PMC - PubMed
    1. Bozza T, McGann JP, Mombaerts P, Wachowiak M. In vivo imaging of neuronal activity by targeted expression of a genetically encoded probe in the mouse. Neuron. 2004;42:9–21. doi: 10.1016/S0896-6273(04)00144-8. - DOI - PubMed
    1. Carey RM, Wachowiak M. Effect of sniffing on the temporal structure of mitral/tufted cell output from the olfactory bulb. J Neurosci. 2011;31:10615–10626. doi: 10.1523/JNEUROSCI.1805-11.2011. - DOI - PMC - PubMed
    1. Carey RM, Verhagen JV, Wesson DW, Pírez N, Wachowiak M. Temporal structure of receptor neuron input to the olfactory bulb imaged in behaving rats. J Neurophysiol. 2009;101:1073–1088. - PMC - PubMed
    1. Carlsen J, Záborszky L, Heimer L. Cholinergic projections from the basal forebrain to the basolateral amygdaloid complex: a combined retrograde fluorescent and immunohistochemical study. J Comp Neurol. 1985;234:155–167. doi: 10.1002/cne.902340203. - DOI - PubMed

Publication types

MeSH terms

LinkOut - more resources