. 2014 Mar 26;34(13):4708-27.
doi: 10.1523/JNEUROSCI.2617-13.2014.

Discharge profiles across the sleep-waking cycle of identified cholinergic, GABAergic, and glutamatergic neurons in the pontomesencephalic tegmentum of the rat

Affiliations

Discharge profiles across the sleep-waking cycle of identified cholinergic, GABAergic, and glutamatergic neurons in the pontomesencephalic tegmentum of the rat

Soufiane Boucetta et al. J Neurosci. .

Abstract

Distributed within the laterodorsal tegmental and pedunculopontine tegmental nuclei (LDT and PPT), cholinergic neurons in the pontomesencephalic tegmentum have long been thought to play a critical role in stimulating cortical activation during waking (W) and paradoxical sleep (PS, also called REM sleep), yet also in promoting PS with muscle atonia. However, the discharge profile and thus precise roles of the cholinergic neurons have remained uncertain because they lie intermingled with GABAergic and glutamatergic neurons, which might also assume these roles. By applying juxtacellular recording and labeling in naturally sleeping-waking, head-fixed rats, we investigated the discharge profiles of histochemically identified cholinergic, GABAergic, and glutamatergic neurons in the LDT, SubLDT, and adjoining medial part of the PPT (MPPT) in relation to sleep-wake states, cortical activity, and muscle tone. We found that all cholinergic neurons were maximally active during W and PS in positive correlation with fast (γ) cortical activity, as "W/PS-max active neurons." Like cholinergic neurons, many GABAergic and glutamatergic neurons were also "W/PS-max active." Other GABAergic and glutamatergic neurons were "PS-max active," being minimally active during W and maximally active during PS in negative correlation with muscle tone. Conversely, some glutamatergic neurons were "W-max active," being maximally active during W and minimally active during PS in positive correlation with muscle tone. Through different discharge profiles, the cholinergic, GABAergic, and glutamatergic neurons of the LDT, SubLDT, and MPPT thus appear to play distinct roles in promoting W and PS with cortical activation, PS with muscle atonia, or W with muscle tone.

Keywords: EEG; EMG; REM sleep; paradoxical sleep; slow-wave sleep.


Figures
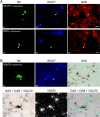
Figure 1.
Figure 1.
Staining of Nb-labeled cholinergic, GABAergic, and glutamatergic neurons. A, IF staining of recorded and Nb-labeled neurons (green, filled arrowheads), which were stained for VAChT (blue) or GAD (red). A1–A3, Nb+ cell shown to be cholinergic (CBS28U03) was immunopositive for VAChT (filled arrowhead), immunonegative for GAD (open arrowhead), and located among other VAChT+ and GAD+ cells (small arrows) in the LDT (Fig. 2, mapped as largest red circle). This cell was classified as “W/PS-max” (Fig. 4). A4–A6, Nb+ cell shown to be GABAergic (CBS28U04) was immunonegative for VAChT (open arrowhead), immunopositive for GAD (filled arrowhead), and located among other VAChT+ and GAD+ cells (small arrows) in the SubLDT (Fig. 2, mapped as largest filled green triangle). This cell was classified as a PS-max cell (Fig. 7). B, Staining by IF (B1, B2) and ISH (B3–B6) of an Nb+ cell shown to be glutamatergic (CBS47U02). The Nb+ cell (B1, green Cy2 staining; B4, brown DAB staining, filled arrowheads) was established as VAChT-negative by IF (B2, blue, open arrowhead), then established as GAD by ISH (B3, purple-gray, open arrowhead) and VGluT2+ by ISH (B5, B6, silver grains, filled arrowhead). The silver grains from the autoradiography appear white in dark-field illumination (B5) and greenish in bright-field epi-illumination (B6). The Nb+/VGluT2+ cell was located among other VAChT+, GAD+, and VGluT2+ cells (small arrows) in the SubLDT (Fig. 2, largest open red diamond). The cell was classified as a W-max active cell (Fig. 9). Scale bars, 20 μm.
Figure 2.
Figure 2.
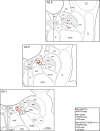
Distribution of Nb-labeled cells in the pontomesencephalic cholinergic cell area. The recorded, Nb-labeled cells (n = 52) were histochemically identified as cholinergic (Nb+/VAChT+, circles), as GABAergic (Nb+/GAD+, triangles), or as possibly or identified glutamatergic (Nb+/VAChT/GAD, diamonds; or VGluT2+, diamonds with black dots). They were further distinguished according to their functional subgroup as “W/PS-max” (red filled symbols), “PS-max” (green filled symbols), or “W-max” (red open symbols). Through appropriate levels (anterior, A0.9, A0.5, or A0.1 mm to interaural zero) of the pontomesencephalic tegmentum, cells were included and mapped if present in the LDT, SubLDT, or MPPT nuclei or surrounding zones where cholinergic cells are located. The largest symbols correspond to representative cells of each subgroup, for which the histochemical staining and/or physiology is illustrated (Figs. 1, 4, 5, 6, 7, 8, 9). CnF, Cuneiform nucleus; crf, central reticular fasciculus; DT, dorsal tegmental nucleus; IC, inferior colliculus; LC, locus coeruleus; LL, lateral lemniscus; LPB, lateral parabrachial nucleus; Me5, mesencephalic trigeminal nucleus; mlf, medial longitudinal fasciculus; Mo5, motor trigeminal nucleus; MPB, medial parabrachial nucleus; PnC, pontine reticular nucleus, caudal part; Pr5, principal sensory trigeminal nucleus; R, raphe nuclei; RtT, reticulotegmental nucleus of the thalamus; scp, superior cerebellar peduncle; SubCγ, subcoeruleus γ; SubLDT, sublaterodorsal tegmental nucleus; VT, ventral tegmental nucleus.
Figure 3.
Figure 3.
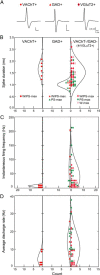
Comparison of spikes among cholinergic, GABAergic, and glutamatergic neurons. A, Spikes (average) from identified Nb+/VAChT+ W/PS-max cell (left, shown in Fig. 4), Nb+/GAD+ W/PS-max cell (middle, shown in Fig. 5), and Nb+/VAChT/GAD/VGluT2+ W/PS-max cell (right, shown in Fig. 6). The waveforms of the cholinergic and glutamatergic cells are similar, whereas that of the GABAergic cell is more narrow. B, Average spike durations of the different cell types and subgroups (W/PS-max, red filled; PS-max, green filled; and W-max, red open symbols, as in Fig. 2). The VAChT+ cells and VAChT/GAD cells, which have similarly medium to broad and overlapping spike durations, differ significantly from the GAD+ cells (Table 2), which have narrow to medium spike durations. C, Average instantaneous firing frequency of the different cell types and subgroups. The mean instantaneous firing frequency of VAChT+ cells was slow and differed significantly from the mean instantaneous firing frequency of congener W/PS GAD+ cells but not from all GAD+ or VAChT/GAD cells (Table 2) because of the extensive overlap in values. D, Average discharge rate of the different cell types and subgroups. The mean average discharge rate of VAChT+ cells was slow and did not differ significantly from the mean average discharge rate of GAD+ or VAChT/GAD cells (Table 2) because of extensive overlap in values.
Figure 4.
Figure 4.
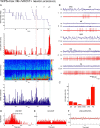
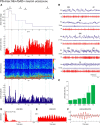
Discharge of cholinergic W/PS-max active unit across sleep–wake states. Data from Nb-labeled cell (CBS28U03) that was immunopositive for VAChT (Fig. 1A1–A3) and located in the LDT (Fig. 2, A0.5). A, Sleep–wake recording, scored (per 10 s epoch) for sleep–wake stages, is shown with simultaneous unit spike rate (Hz), EEG frequency, and amplitude (μV/Hz with frequency on y-axis and amplitude scaled differentially according to color from blue to red, over the low-frequency, 0–30 Hz from 0 to 100 μV, and the high-frequency, 30–60 Hz from 0 to 25 μV) and EMG amplitude (arbitrary units) over the recording session. Representative 10 s scored epochs (indicated by horizontal solid lines and dashed vertical lines) of aW (red), SWS (blue), and PS (green) or transitional 10 s periods (lower solid horizontal lines) are shown in B. The interruptions in the sleep–wake scoring line represent epochs during which transitions between stages occurred, such that no one stage was predominant and could thus be scored for analysis. B, Polygraphic records from 10 s epochs or periods (indicated by numbered horizontal lines in A) of the unit together with EEG (from retrosplenial cortex) and EMG activity during a transition from SWS to aW (1), aW (2), SWS (3), a transition from tPS to PS (4), and PS (5). C, Bar graph showing mean spike rate (Hz) of the unit across sleep–wake stages. During aW (2), the unit discharged tonically at a slow rate (1.91 Hz) with prominence of fast EEG activity, ceased firing during SWS (3) (0.06 Hz) in association with slow EEG activity (∼1–4 Hz) and discharged maximally and tonically to reach its highest rates during PS (5) (9.70 Hz) in association with prominent rhythmic θ (∼6–8 Hz) along with fast EEG activity. It changed its rate of discharge before cortical activation in the transition from SWS to aW (1) and before PS during tPS (4) while spindle activity (∼9–14 Hz) progresses to θ. The unit discharge was significantly positively correlated with EEG γ (r = 0.37) along with θ activity (r = 0.93). D, Unit ISIH from which the instantaneous firing frequency is calculated (as the reciprocal of the mode) for the state of maximal discharge. E, Unit autocorrelation histogram (ACH with arbitrary voltage units for spikes on vertical axes) for the state of maximal discharge. F, Unit-to-EEG spike-triggered average (STA with mV EEG on vertical axes) for the state of maximal discharge with comparison of the actual unit spike train (red line) with a randomized shuffled spike train (gray line). This VAChT+ cell, which discharged maximally during PS, fired in single spikes at a relatively slow instantaneous frequency (10 Hz, in ISIH) and in a relatively regular tonic mode, with no evidence of rhythmic firing (in ACH) or cross-correlated activity with slow or fast EEG rhythms (in STA).
Figure 5.
Figure 5.
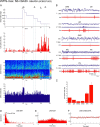
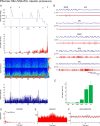
Discharge of GABAergic W/PS-max active unit across sleep–wake states. Data from Nb-labeled cell (CBS37U02) that was immunopositive for GAD (data not shown) and located in the SubLDT (Fig. 2, A0.1). A–C, This GAD+ cell discharged moderately during aW (2) (2.20 Hz), minimally during SWS (3) (0.72 Hz) and maximally during PS (5) (7.72 Hz) in a phasic manner comprised of clusters of spikes. It changed its rate of discharge only after cortical activation in the transition from SWS to aW (1) but increased its rate before PS during tPS (4). The unit discharge was significantly positively correlated with EEG γ (r = 0.72) and θ activity (r = 0.90). D–F, During the state of maximal discharge (PS), the instantaneous firing frequency (53 Hz, in the ISIH) was much higher than the average discharge rate and reflected a phasic firing pattern in clusters, which however was neither rhythmic (in ACH) nor cross-correlated with slow or fast EEG rhythms (in STA). For details and abbreviations, see Figure 4.
Figure 6.
Figure 6.
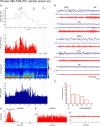
Discharge of glutamatergic W/PS-max active unit across sleep–wake states. Data from Nb-labeled cell (CBS51U01) that expressed VGluT2 (data not shown) and was located in the LDT (Fig. 2, A0.1). A–C, This VGluT2+ cell, discharged slowly during epochs of aW (2) (0.25 Hz), was virtually silent during SWS (3) (0.02 Hz) associated with slow EEG activity and discharged at its maximal, albeit slow, rate during PS (5) (0.68 Hz) in association with prominent θ and fast EEG activity. Slow firing, this cell did not appear to increase its rate of discharge before cortical activation in the transition from SWS to aW (1) but did begin to fire before PS during tPS (4). The unit discharge was significantly positively correlated with EEG γ (r = 0.34) and θ activity (r = 0.86). D–F, During the state of maximal discharge (PS), the instantaneous firing frequency (2.7 Hz in the ISIH) did not differ much from the average discharge rate, reflecting the tonic regular firing pattern, which was neither rhythmic (in ACH) nor cross-correlated with slow or fast EEG rhythms (in STA). For details and abbreviations, see Figure 4.
Figure 7.
Figure 7.
Discharge of GABAergic PS-max active unit across sleep–wake states. Data from Nb-labeled cell (CBS28U04) that was immunostained for GAD (Fig. 1A4–A6) and located in the SubLDT (Fig. 2, A0.1). A–C, This GAD+ cell discharged at relatively low rates during aW (2) (3.90 Hz) with fast EEG activity and high EMG amplitude, increased firing during SWS (3) (6.05 Hz) in association with slow δEEG activity and low muscle EMG and discharged maximally during PS (5) (20.98 Hz) with θ and fast EEG activity accompanied by muscle atonia. It increased its discharge most markedly immediately preceding PS during tPS (4). The unit discharge was positively correlated with EEG θ activity (r = 0.53) and negatively correlated with EMG amplitude (r = −0.45). D–F, During the state of maximal discharge (PS), there are two interspike interval modes (in the unit ISIH): one reflecting the high instantaneous firing frequency (∼77 Hz) during phasic spike clusters and the other, the slow rhythmic recurrence of the spike clusters. These spike clusters appear to be rhythmic at a θ frequency (in the ACH, ∼6 Hz) and cross-correlated with the EEG (in the STA) at the same frequency. For details and abbreviations, see Figure 4.
Figure 8.
Figure 8.
Discharge of glutamatergic PS-max active unit across sleep–wake states. Data from Nb-labeled cell (CBS46U02) that expressed VGluT2 (data not shown) and was located in the LDT (Fig. 2, A0.5). A–C, This VGluT2+ cell discharged at its lowest rates during aW (2) (0.13 Hz) with fast EEG activity and high neck muscle tone, increased its firing during SWS (3) (1.77 Hz) in association with slow EEG activity and low muscle tone and discharged maximally to reach its highest rate during PS (5) (9.42 Hz) in association with θ EEG activity and muscle atonia. It increased its rate most markedly immediately preceding PS during tPS (4). D–F, During the state of maximal discharge (PS), the instantaneous firing frequency (200 Hz in the ISIH) was much higher than its average discharge rate and reflected a phasic firing pattern of spike bursts, which was neither rhythmic (in ACH) nor cross-correlated with slow or fast EEG rhythms (in STA). For details and abbreviations, see Figure 4.
Figure 9.
Figure 9.
Discharge of glutamatergic W-max active unit across sleep–wake states. Data from Nb-labeled cell (CBS47U02) that expressed VGluT2 (Fig. 1B) and was located in the SubLDT (Fig. 2, A0.5). A–C, This VGluT2+ cell discharged maximally and tonically during aW (2) (17.40 Hz) with fast EEG activity and high neck muscle tone, decreased its firing during SWS (3) (6.83 Hz) in association with slow EEG activity and low muscle tone, and ceased firing during PS (5) (0.78 Hz) in association with θ EEG activity and muscle atonia. It changed its rate with awakening from SWS (1) and through tPS to become silent during PS (5). The unit discharge was positively correlated with EMG activity (r = 0.69). D–F, During the state of maximal discharge (aW), the instantaneous firing frequency (23 Hz in the ISIH) did not differ much from the average discharge rate, reflecting the tonic regular discharge of the cell, which was neither rhythmic (see ACH) nor cross-correlated with EEG activity (STA). For details and abbreviations, see Figure 4.
Figure 10.
Figure 10.
Mean discharge rates of different cell types and subgroups in association with EEG and EMG activity across sleep–wake stages. A, Discharge rates of cholinergic (Nb+/VAChT+, n = 6), GABAergic (Nb+/GAD+, n = 5), and possibly glutamatergic (Nb+/VAChT/GAD, n = 18), including a subset of identified glutamatergic (VGluT2+, n = 3, black open bars), neurons that discharged maximally during aW and PS in positive correlation with γ EEG activity across sleep–wake stages. B, Discharge rates of GABAergic (n = 4) and possibly glutamatergic (n = 12) neurons, including a subset of identified glutamatergic (VGluT2+, n = 1, black open bars), neurons that discharged maximally during PS in negative correlation with EMG amplitude across sleep–wake stages. C, Discharge rates of possibly glutamatergic (n = 7) neurons, including a subset of identified glutamatergic (VGluT2+, n = 2, black open bars) neurons that discharged maximally during aW in positive correlation with EMG amplitude across sleep–wake stages. Unit discharge rates were normalized per cell according to individual maximal rate (in W or PS). EEG γ and EMG amplitudes were similarly normalized for each cell included.
Figure 11.
Figure 11.
Regulation of sleep–wake states by pontomesencephalic cholinergic/noncholinergic neurons. Sagittal schematic view depicting the recorded and identified functional subtypes of LDT/SubLDT and MPPT cholinergic, GABAergic, and glutamatergic neurons (dark filled symbols) and how they might influence cortical activity and behavior through actions upon other presumed functional subtypes of neurons (light filled symbols) in the brainstem and forebrain. Cholinergic, GABAergic, and glutamatergic LDT/SubLDT and MPPT neurons, which are maximally active during both W and PS (W/PS-max active, filled red symbols) and discharge in positive (+) association with fast EEG (γ) activity, could stimulate cortical activation during both W and PS by projections onto presumed glutamatergic neurons located in the Mes and PnO RF (arrows) and/or the thalamus (through a dorsal ascending pathway, large arrow) and hypothalamus and basal forebrain (through a ventral ascending pathway, large arrow). The cholinergic neurons could also promote muscle atonia during PS through excitation of glutamatergic neurons (with M1 AChRs) in the SubCα (arrow) and PnO RF (arrow), which are active during PS and project upon GABAergic neurons in the Gi RF. They could also excite GABAergic neurons in the PnC (arrow) and Gi RF (arrow), which are active during PS and can in turn, respectively, inhibit large reticular projection neurons and/or motor neurons in the spinal cord. The cholinergic neurons could conversely inhibit neurons (with M2 AChRs) that are predominantly active during W, including local GABAergic neurons in the PnO (bar), which inhibit PS active neurons, and large presumed glutamatergic neurons in the PnC (bar), which excite motor neurons. The inhibitory actions of ACh would be opposed during W by excitatory influences from noradrenergic locus coeruleus neurons (arrow) and from Orx neurons (arrows). GABAergic and glutamatergic LDT/SubLDT and MPPT neurons that are maximally active during PS (PS-max active, aqua symbols) in negative (−) association with EMG activity could stimulate behavioral sleep with muscle atonia also by projections into the brainstem. The GABAergic neurons could inhibit their neighboring W active noradrenergic locus coeruleus neurons (bar) and W active GABAergic neurons in the PnO (bar). The glutamatergic neurons could stimulate other PS active presumed glutamatergic neurons in the SubCα (arrow) and PnO (arrow) and, in parallel with these, stimulate GABAergic (or glycinergic) neurons located in the Gi RF (arrows) or spinal cord (data not shown) (above). Glutamatergic LDT/SubLDT and MPPT neurons, which are maximally active during W (W-max active, open red symbol) in positive (+) association with EMG activity, could stimulate behavioral arousal with muscle tone during W. They could excite, together with noradrenergic and Orx neurons, the W active presumed glutamatergic neurons in the PnC (above, arrow), that in turn stimulate presumed glutamatergic neurons located in the Gi RF (arrow) or spinal cord (data not shown) (above). 7 g, Genu seventh nerve; Gi, gigantocellular reticular formation; Glu, glutamate; LC, locus coeruleus nucleus; LDT, laterodorsal tegmental nucleus; Mes RF, mesencephalic reticular formation; NA, noradrenaline; PH, posterior hypothalamus; Orx, orexin; PnC, pontine, caudal part RF; PnO, pontine, oral part RF; PPT, pedunculopontine tegmental nucleus; RF, reticular formation; scp, superior cerebellar peduncle; SubCα, subcoeruleus α; SubLDT, sublaterodorsal tegmental nucleus.

Similar articles

Cited by

References

    1. Alonso A, Khateb A, Fort P, Jones BE, Mühlethaler M. Differential oscillatory properties of cholinergic and non-cholinergic nucleus Basalis neurons in guinea pig brain slice. Eur J Neurosci. 1996;8:169–182. doi: 10.1111/j.1460-9568.1996.tb01178.x. - DOI - PubMed
    1. Armstrong DM, Saper CB, Levey AI, Wainer BH, Terry RD. Distribution of cholinergic neurons in rat brain: demonstrated by the immunocytochemical localization of choline acetyltransferase. J Comp Neurol. 1983;216:53–68. doi: 10.1002/cne.902160106. - DOI - PubMed
    1. Baghdoyan HA, Rodrigo-Angulo ML, McCarley RW, Hobson JA. A neuroanatomical gradient in the pontine tegmentum for the cholinoceptive induction of desynchronized sleep signs. Brain Res. 1987;414:245–261. doi: 10.1016/0006-8993(87)90005-9. - DOI - PubMed
    1. Boucetta S, Jones BE. Activity profiles of cholinergic and intermingled GABAergic and putative glutamatergic neurons in the pontomesencephalic tegmentum of urethane-anesthetized rats. J Neurosci. 2009;29:4664–4674. doi: 10.1523/JNEUROSCI.5502-08.2009. - DOI - PMC - PubMed
    1. Brischoux F, Mainville L, Jones BE. Muscarinic-2 and orexin-2 receptors on GABAergic and other neurons in the rat mesopontine tegmentum and their potential role in sleep–wake state control. J Comp Neurol. 2008;510:607–630. doi: 10.1002/cne.21803. - DOI - PubMed

Publication types

MeSH terms

LinkOut - more resources