. 2014 Jun;88(11):6403-10.
doi: 10.1128/JVI.00362-14. Epub 2014 Mar 26.

An allometric relationship between the genome length and virion volume of viruses

Affiliations

An allometric relationship between the genome length and virion volume of viruses

Jie Cui et al. J Virol. 2014 Jun.

Abstract

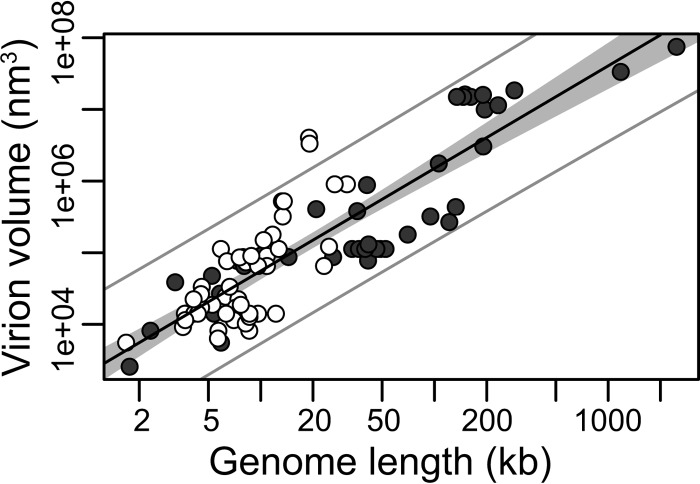
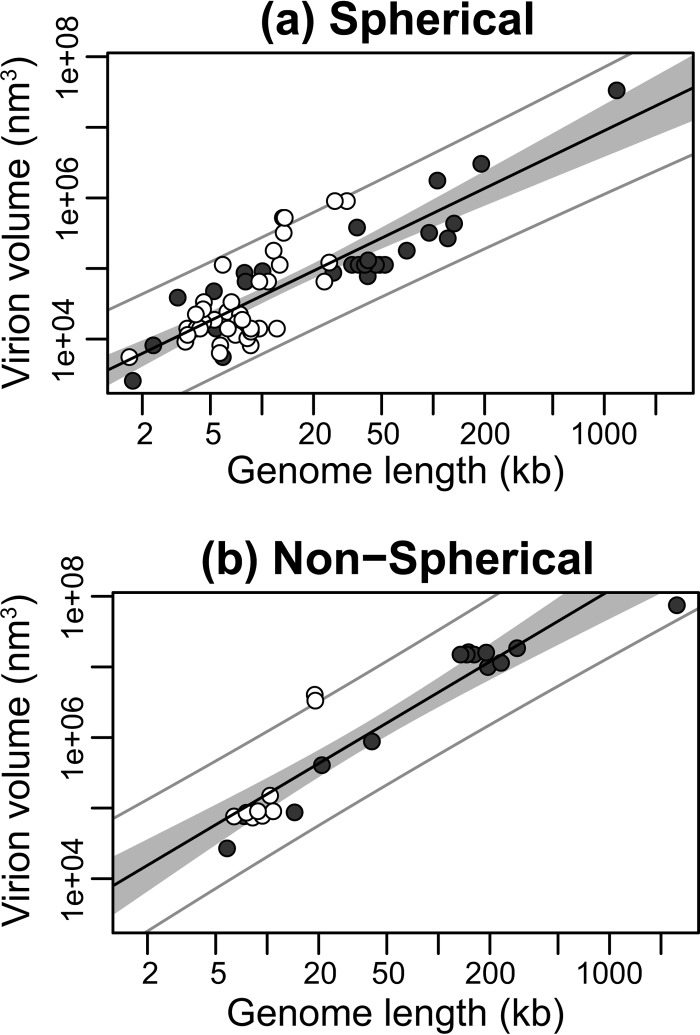
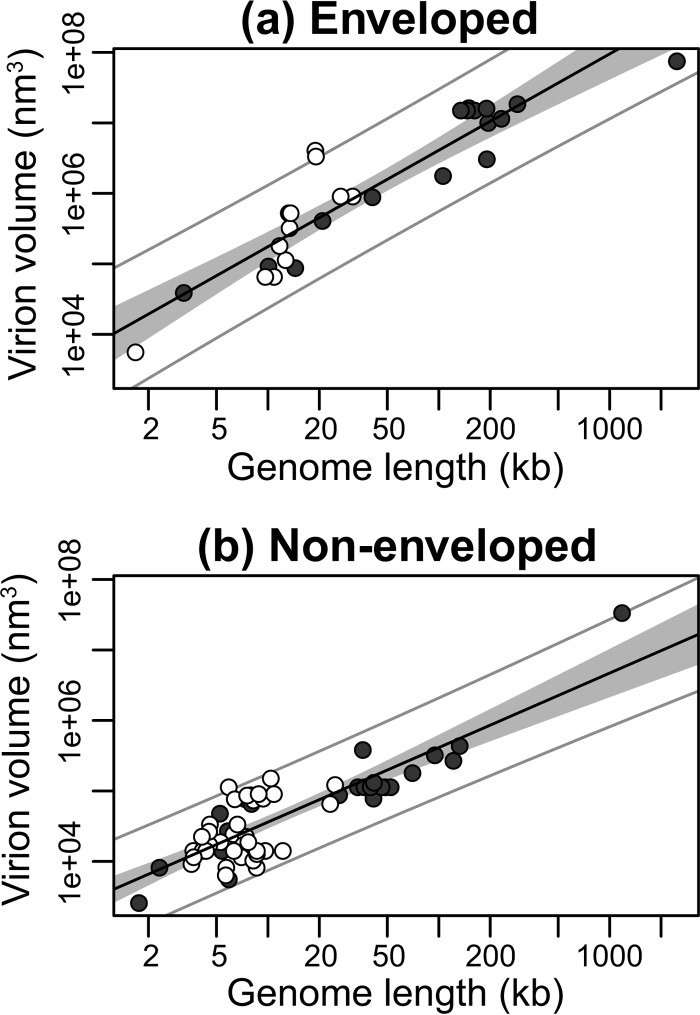
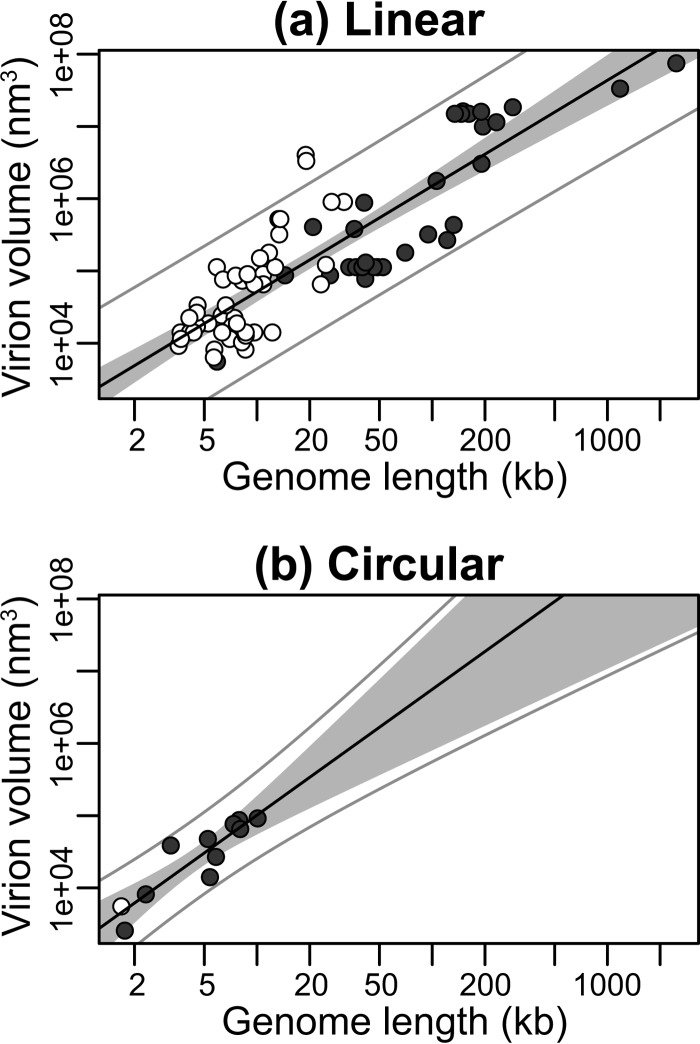
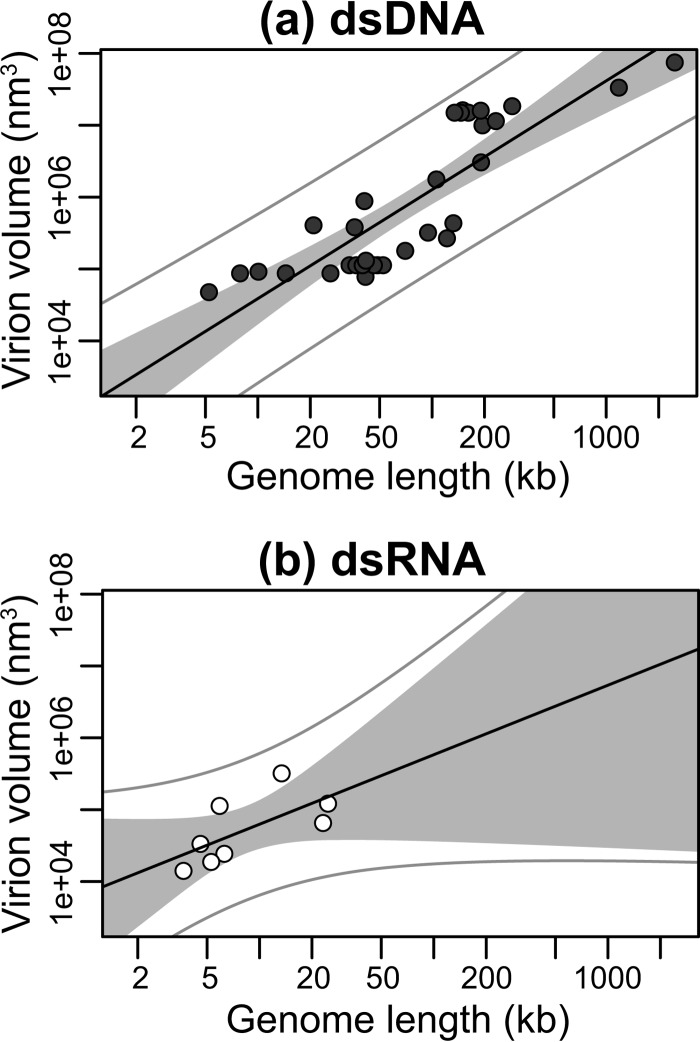
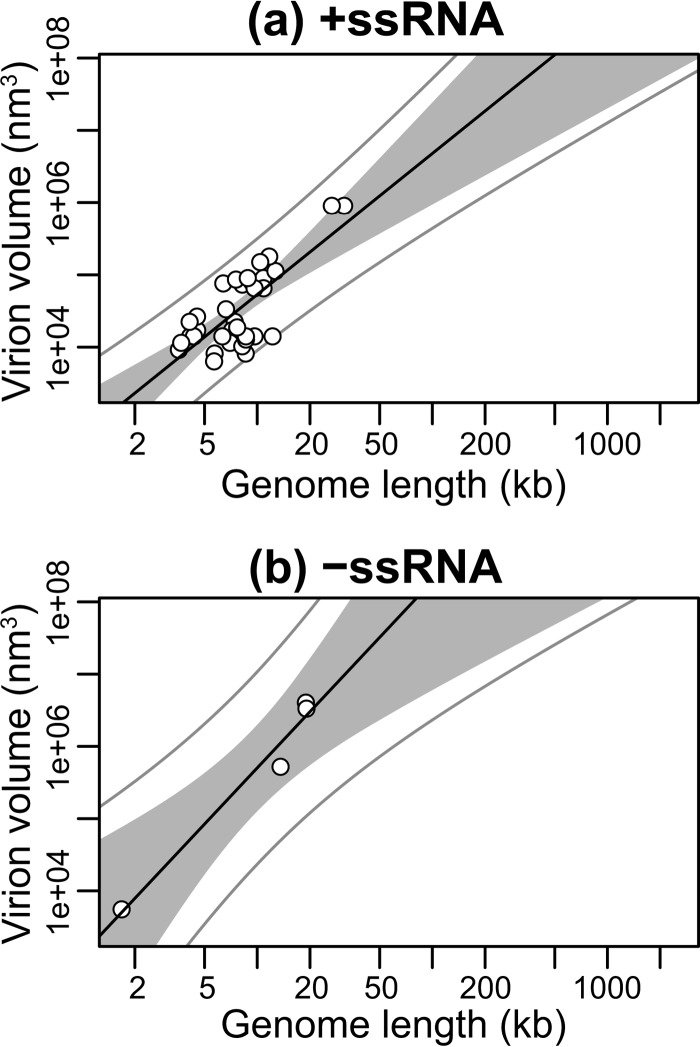
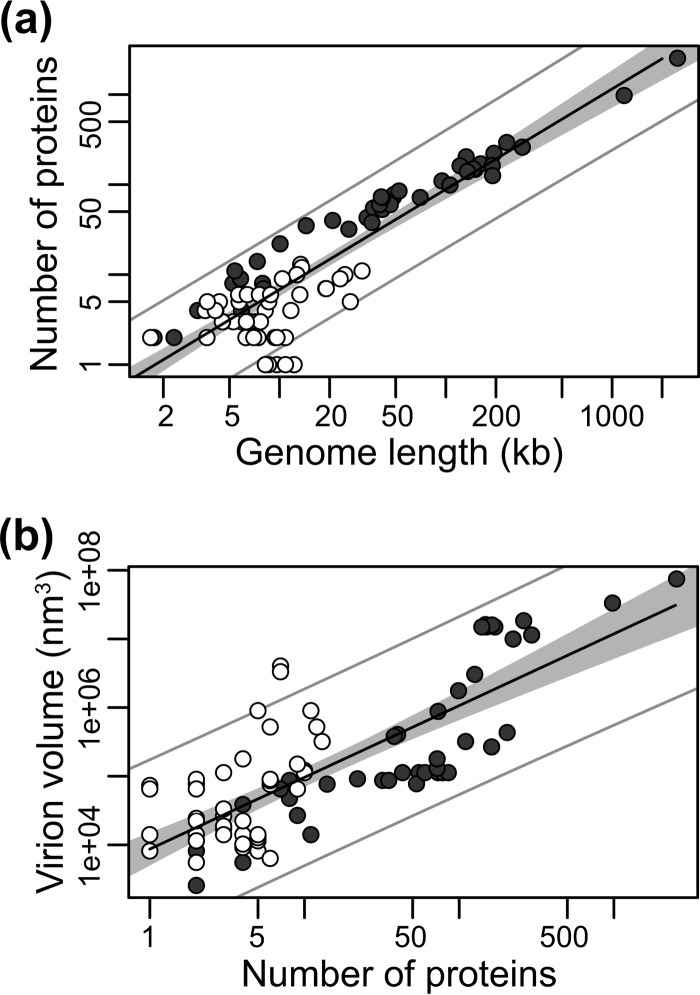
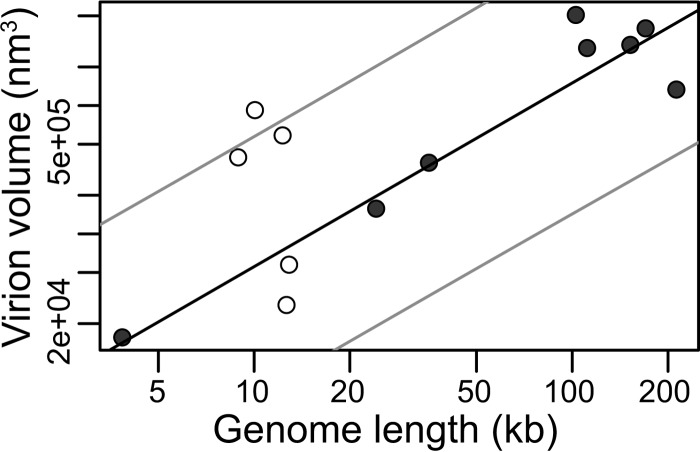
Virions vary in size by at least 4 orders of magnitude, yet the evolutionary forces responsible for this enormous diversity are unknown. We document a significant allometric relationship, with an exponent of approximately 1.5, between the genome length and virion volume of viruses and find that this relationship is not due to geometric constraints. Notably, this allometric relationship holds regardless of genomic nucleic acid, genome structure, or type of virion architecture and therefore represents a powerful scaling law. In contrast, no such relationship is observed at the scale of individual genes. Similarly, after adjusting for genome length, no association is observed between virion volume and the number of proteins, ruling out protein number as the explanation for the relationship between genome and virion sizes. Such a fundamental allometric relationship not only sheds light on the constraints to virus evolution, in that increases in virion size but not necessarily structure are associated with concomitant increases in genome size, but also implies that virion sizes in nature can be broadly predicted from genome sequence data alone.

Importance: Viruses vary dramatically in both genome and virion sizes, but the factors responsible for this diversity are uncertain. Through a comparative and quantitative investigation of these two fundamental biological parameters across diverse viral taxa, we show that genome length and virion volume conform to a simple allometric scaling law. Notably, this allometric relationship holds regardless of the type of virus, including those with both RNA and DNA genomes, and encompasses viruses that exhibit more than 3 logs of genome size variation. Accordingly, this study helps to reveal the basic rules of virus design.


Figures

FIG 1
FIG 1
Relationship between viral genome and virion sizes. The y axis shows virion sizes displayed as volume (nm3) on a log scale, while the x axis indicates genome length (kb) on a log scale. RNA viruses are shown by open circles and DNA viruses by closed circles. The solid black line marks the linear regression between log-log-transformed data. The gray area represents the 95% confidence interval for the linear regression line. The outer gray lines represent the 95% prediction interval, within which we expect 95% of virion sizes to lie for a given genome size.
FIG 2
FIG 2
Relationship between genome and virion sizes among spherical (a) and nonspherical (b) viruses. The y axis shows virion sizes calculated as volume (nm3) on a log scale, while the x axis shows genome length (kb) on a log scale. RNA viruses are shown by open circles and DNA viruses by closed circles. The solid black line marks the linear regression between log-log-transformed data. The gray area represents the 95% confidence interval for the linear regression line. The outer gray lines represent the 95% prediction interval, within which we expect 95% of virion sizes to lie for a given genome size.
FIG 3
FIG 3
Relationship between genome lengths and virion sizes among enveloped (a) and nonenveloped (b) viruses. The y axis shows the virion sizes calculated as volume (nm3) on a log scale, while genome lengths (kb) are shown on the x axis on a log scale. RNA viruses are shown by open circles and DNA viruses by closed circles. The solid black line marks the linear regression between log-log-transformed data. The gray area represents the 95% confidence interval for the linear regression line. The outer gray lines represent the 95% prediction interval, within which we expect 95% of virion sizes to lie for a given genome size.
FIG 4
FIG 4
Relationship between genome and virion sizes among linear (a) and circular (b) viruses. The y axis shows virion sizes calculated as volume (nm3) on a log scale, while the x axis shows genome length (kb) on a log scale. RNA viruses are shown by open circles and DNA viruses by closed circles. The solid black line marks the linear regression between log-log-transformed data. The gray area represents the 95% confidence interval for the linear regression line. The outer gray lines represent the 95% prediction interval, within which we expect 95% of virion sizes to lie for a given genome size.
FIG 5
FIG 5
Relationship between genome and virion sizes among dsDNA viruses (closed circles) (a) and dsRNA viruses (open circles) (b). The y axis shows virion sizes calculated as volume (nm3) on a log scale, while the x axis shows genome length (kb) on a log scale. The solid black line marks the linear regression between log-log-transformed data. The gray area represents the 95% confidence interval for the linear regression line. The outer gray lines represent the 95% prediction interval, within which we expect 95% of virion sizes to lie for a given genome size.
FIG 6
FIG 6
Relationship between genome and virion sizes among +ssRNA (a) and −ssRNA (b) viruses. The y axis shows virion sizes calculated as volume (nm3) on a log scale, while the x axis shows genome length (kb) on a log scale. The solid black line marks the linear regression between log-log-transformed data. The gray area represents the 95% confidence interval for the linear regression line. The outer gray lines represent the 95% prediction interval, within which we expect 95% of virion sizes to lie for a given genome size.
FIG 7
FIG 7
Relationship between (a) the number of proteins in a viral genome (y axis, log scale) and its length (kb) (x axis, log scale) and (b) virion volumes (nm3) (y axis, log scale) and protein numbers (x axis, log scale). RNA viruses are shown by open circles and DNA viruses by closed circles. The solid line marks the linear regression on log-log-transformed data.
FIG 8
FIG 8
Relationship between genome and virion sizes for 13 viruses excluded from the original analysis because only a range of virion volumes were available (Table 3). RNA viruses are shown by open circles and DNA viruses by closed circles. The solid black line marks the prediction line calculated for our original analysis (Fig. 1). The outer gray lines represent the 95% prediction interval for our original analysis, within which we expect 95% of predicted virion sizes to lie.

Similar articles

Cited by

References

    1. Fauquet CM, Mayo MA, Maniloff J, Desselberger U, Ball LA. (ed). 2005. Virus taxonomy; eighth report of the International Committee on Taxonomy of Viruses. Elsevier, London, United Kingdom
    1. Philippe N, Legendre M, Doutre G, Couté Y, Poirot O, Lescot M, Arslan D, Seltzer V, Bertaux L, Bruley C, Garin J, Claverie JM, Abergel C. 2013. Pandoraviruses: amoeba viruses with genomes up to 2.5 Mb reaching that of parasitic eukaryotes. Science 341:281–286. 10.1126/science.1239181 - DOI - PubMed
    1. Fiddes JC. 1977. The nucleotide sequence of a viral DNA. Sci. Am. 237:54–67. 10.1038/scientificamerican1277-54 - DOI - PubMed
    1. Michel JP, Ivanovska IL, Gibbons MM, Klug WS, Knobler CM, Wuite GJ, Schmidt CF. 2006. Nanoindentation studies of full and empty viral capsids and the effects of capsid protein mutations on elasticity and strength. Proc. Natl. Acad. Sci. U. S. A. 103:6184–6189. 10.1073/pnas.0601744103 - DOI - PMC - PubMed
    1. Ting CL, Wu J, Wang ZG. 2011. Thermodynamic basis for the genome to capsid charge relationship in viral encapsidation. Proc. Natl. Acad. Sci. U. S. A. 108:16986–16991. 10.1073/pnas.1109307108 - DOI - PMC - PubMed

Publication types

LinkOut - more resources