. 2014 Jun;88(12):6599-610.
doi: 10.1128/JVI.00590-14. Epub 2014 Mar 26.

Coregulatory interactions among CD8α dendritic cells, the latency-associated transcript, and programmed death 1 contribute to higher levels of herpes simplex virus 1 latency

Affiliations

Coregulatory interactions among CD8α dendritic cells, the latency-associated transcript, and programmed death 1 contribute to higher levels of herpes simplex virus 1 latency

Kevin R Mott et al. J Virol. 2014 Jun.

Abstract

The latency-associated transcript (LAT) of herpes simplex virus 1 (HSV-1), CD8α(+) dendritic cells (DCs), and programmed death 1 (PD-1) have all been implicated in the HSV-1 latency-reactivation cycle. It is not known, however, whether an interaction between LAT and CD8α(+) DCs regulates latency and T-cell exhaustion. To address this question, we used LAT-expressing [LAT(+)] and LAT-negative [LAT(-)] viruses. Depletion of DCs in mice ocularly infected with LAT(+) virus resulted in a reduction in the number of T cells expressing PD-1 in the trigeminal ganglia (TG), whereas depletion of DCs in mice similarly infected with LAT(-) virus did not alter PD-1 expression. CD8α(+) DCs, but not CD4(+) DCs, infected with LAT(+) virus had higher levels of ICP0, ICP4, thymidine kinase (TK), and PD-1 ligand 1 (PD-L1) transcripts than those infected with LAT(-) virus. Coculture of infected bone marrow (BM)-derived DCs from wild-type (WT) mice, but not infected DCs from CD8α(-/-) mice, with WT naive T cells contributed to an increase in PD-1 expression. Transfer of bone marrow from WT mice but not CD8α(-/-) mice to recipient Rag1(-/-) mice increased the number of latent viral genomes in reconstituted mice infected with the LAT(+) virus. Collectively, these data indicated that a reduction in latency correlated with a decline in the levels of CD8α(+) DCs and PD-1 expression. In summary, our results demonstrate an interaction among LAT, PD-1, and CD11c CD8α(+) cells that regulates latency in the TG of HSV-1-infected mice.

Importance: Very little is known regarding the interrelationship of LAT, PD-1, and CD8α(+) DCs and how such interactions might contribute to relative numbers of latent viral genomes. We show here that (i) in both in vivo and in vitro studies, deficiency of CD8α(+) DCs significantly reduced T-cell exhaustion in the presence of LAT(+) virus but not LAT(-) virus; (ii) HSV-1 infectivity was significantly lower in LAT(-)-infected DCs than in their LAT(+)-infected counterparts; and (iii) adoptive transfer of bone marrow (BM) from WT but not CD8α(-/-) mice to recipient Rag1(-/-) mice restored latency to the level in WT mice following infection with LAT(+) virus. These studies point to a key role for CD8α(+) DCs in T-cell exhaustion in the presence of LAT, which leads to larger numbers of latent viral genomes. Thus, altering this negative function of CD8α(+) DCs can potentially be used to generate a more effective vaccine against HSV infection.


Figures

FIG 1
FIG 1
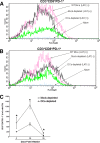
Role of DCs in CD8 T-cell exhaustion in vivo. DTR mice were depleted of their DCs by use of diphtheria toxin or were mock depleted with PBS, as described in Materials and Methods. Mice were ocularly infected with LAT(+) or LAT(−) virus, and individual mouse TG were collected on days 5, 10, and 30 p.i. Controls included infected WT mice and noninfected naive DTR mice. On days 5, 10, and 30 p.i., TG from each mouse were isolated and digested with collagenase (400 IU/TG). The cell suspension was filtered through a 45-mm cell strainer, stained with PAC Blue–anti-CD8, FITC–anti-PD-1, and allophycocyanin (APC)–anti-CD3, and analyzed by flow cytometry. (A) Representative histograms of CD3+ CD8+ PD1+ T cells on day 30 p.i. in mice infected with LAT(+) virus. (B) Representative histograms of CD3+ CD8+ PD1+ T cells on day 30 p.i. in mice infected with LAT(−) virus. (C) Mean numbers of CD3+ CD8+ PD1+ T cells from DC-depleted and mock-depleted mice infected with LAT(+) virus on days 5, 10, and 30 p.i. Data for three mice per treatment are shown.
FIG 2
FIG 2
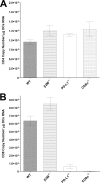
Expression of CD4 and CD8 transcripts in BM-derived DCs. Subconfluent monolayers of DCs from naive WT, β2m−/−, PD-L1−/−, or CD8α−/− mice were harvested, total RNA was isolated, and TaqMan RT-PCR was performed using CD4- and CD8α-specific primers as described in Materials and Methods. GAPDH was used as an internal reference control. Data represent mean copy numbers ± standard errors of the means (SEM) (n = 4). (A) Copy numbers for CD4 transcript. (B) Copy numbers for CD8α transcript.
FIG 3
FIG 3
HSV-1 infection of DCs isolated from different strains of mice. Subconfluent monolayers of BM-derived DCs from WT, β2m−/−, PD-L1−/−, or CD8α−/− mice were infected with 1 PFU/cell of LAT(+) or LAT(−) virus for 24 h as described in Materials and Methods. RNAs were isolated, and the copy numbers of HSV-1 gB transcripts were determined by TaqMan qRT-PCR. GAPDH was used as an internal reference control. Data represent means ± SEM (n = 4).
FIG 4
FIG 4
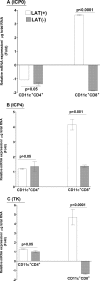
Expression of HSV-1 transcripts in CD8α+ DCs. Subconfluent monolayers of BM-derived DCs from WT mice were infected with 1 PFU/cell of LAT(+) or LAT(−) virus as described in Materials and Methods. At 24 h p.i., infected DCs were fractionated into CD11c+ CD4 CD8α+ and CD11c+ CD4+ CD8α subsets. Total RNA was isolated, and TaqMan RT-PCR was performed using ICP0-, ICP4-, and TK-specific primers as described in Materials and Methods. GAPDH was used as an internal reference control. Data represent means ± SEM (n = 4) for two separate experiments. (A) ICP0; (B) ICP4; (C) TK.
FIG 5
FIG 5
Expression of PD-L1 transcript in CD8α+ DCs. Subconfluent monolayers of BM-derived DCs from WT mice were infected with 1 PFU/cell of LAT(+) or LAT(−) virus or mock infected as described for Fig. 4. Infected and mock-infected DCs were fractionated into CD11c+ CD4 CD8α+ and CD11c+ CD4+ CD8α subsets. Total RNA was isolated, and TaqMan RT-PCR was performed using PD-L1-specific primers as described in Materials and Methods. Expression of PD-L1 in the CD11c+ CD4 CD8α+ and CD11c+ CD4+ CD8α subsets was normalized to that in their uninfected counterparts. GAPDH was used as an internal reference control. Data represent means ± SEM (n = 4) for two separate experiments.
FIG 6
FIG 6
Expansion of exhausted T cells in the presence of infected DCs from WT mice. Subconfluent monolayers of BM-derived DCs from WT mice were infected with 1 PFU/cell of LAT(+) virus. At 24 h p.i., 1 × 10⁶ infected DCs were incubated with similar amounts of purified naive T cells isolated from WT mice. As controls, a subset of T cells were cultured without any DCs or incubated with noninfected DCs. At 24, 48, 72, and 96 h postcoculture, cells were harvested, stained with anti-CD3, anti-CD4, anti-CD8, and anti-PD-1 monoclonal antibodies (MAbs), and analyzed by flow cytometry. A minimum of 104 events was acquired on a gate, including viable cells. (A) At 96 h postincubation, CD3 T cells were gated on expression of CD8 and PD-1. The number in each quadrant indicates the percentage of single- or double-positive T cells per treatment. (B) Mean percentages of CD3+ PD-1+ CD8+ T cells at different times postcoculture are shown for each treatment from three experiments. (C) At 96 h postincubation, CD3 T cells were gated on expression of CD4 and PD-1. The number in each quadrant indicates the percentage of single- or double-positive T cells for each treatment condition. (D) Mean percentages of CD3+ PD-1+ CD4+ T cells at different times postcoculture for each treatment are shown for three independent experiments.
FIG 7
FIG 7
PD-1 expression was not altered in the presence of infected DCs from CD8α−/− mice. Subconfluent monolayers of BM-derived DCs from CD8α−/− mice were infected with 1 PFU/cell of LAT(+) virus as described in the text. At 24 h p.i., 1 × 10⁶ infected DCs were incubated with similar amounts of purified naive T cells isolated from WT mice. As controls, a subset of T cells was cultured without any DCs or incubated with uninfected DCs. At 96 h postcoculture, cells were isolated, stained with anti-CD3, anti-CD4, anti-CD8, and anti-PD-1 MAbs, and analyzed by flow cytometry. A minimum of 104 events was acquired on a gate, including viable cells. Upper panels show CD3 T cells gated on expression of CD8 and PD-1, while lower panels show CD3 T cells gated on expression of CD4 and PD-1. The number in each quadrant indicates the percentage of single- or double-positive T cells for each treatment condition.
FIG 8
FIG 8
IHC of DCs isolated from Rag-1−/− mice. BM-derived DCs from Rag-1−/− mice were isolated and grown on Lab-Tex chamber slides. At 24 h postculture, DCs were fixed and stained with anti-CD11c and anti-CD4, anti-CD11c and anti-CD8α, or anti-CD11c and anti-CD8β antibodies, followed by incubation with relevant secondary antibody to each primary antibody as described in Materials and Methods. DAPI is shown as a nuclear counterstain.
FIG 9
FIG 9
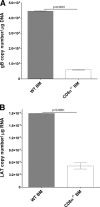
Effect of CD8α expression on the level of latency in TG of latently infected mice. Rag1−/− mice received BM from WT or CD8α−/− mice at a 1:1 ratio i.v. At 2 weeks posttransfer, recipient mice were ocularly infected with LAT(+) virus as described in Materials and Methods. On day 30 p.i., TG were harvested from the latently infected mice. Quantitative PCR and RT-PCR were performed on each individual mouse TG. In each experiment, an estimated relative copy number of gB or LAT was calculated using a standard curve generated from pGem-gB1 or pGEM-5317 (H. Ghiasi, unpublished data), respectively. Briefly, the DNA template was serially diluted 10-fold, such that 5 μl contained 103 to 1011 copies of gB or LAT, and then subjected to TaqMan PCR with the same set of primers. By comparing the normalized threshold cycle of each sample to the threshold cycle of the standard, the copy number for each reaction was determined. GAPDH expression was used to normalize the relative expression of gB DNA or LAT RNA in the TG. Data represent means ± SEM for 10 TG. (A) gB DNA; (B) LAT RNA.

Similar articles

Cited by

References

    1. Stevens JG. 1989. Human herpesviruses: a consideration of the latent state. Microbiol. Rev. 53:318–332 - PMC - PubMed
    1. Wechsler SL, Nesburn AB, Watson R, Slanina S, Ghiasi H. 1988. Fine mapping of the major latency-related RNA of herpes simplex virus type 1 in humans. J. Gen. Virol. 69:3101–3106. 10.1099/0022-1317-69-12-3101 - DOI - PubMed
    1. Fraser NW, Valyi-Nagy T. 1993. Viral, neuronal and immune factors which may influence herpes simplex virus (HSV) latency and reactivation. Microb. Pathog. 15:83–91. 10.1006/mpat.1993.1059 - DOI - PubMed
    1. Rock DL, Nesburn AB, Ghiasi H, Ong J, Lewis TL, Lokensgard JR, Wechsler SL. 1987. Detection of latency-related viral RNAs in trigeminal ganglia of rabbits latently infected with herpes simplex virus type 1. J. Virol. 61:3820–3826 - PMC - PubMed
    1. Gordon YJ. 1990. Pathogenesis and latency of herpes simplex virus type 1 (HSV-1): an ophthalmologist's view of the eye as a model for the study of the virus-host relationship. Adv. Exp. Med. Biol. 278:205–209. 10.1007/978-1-4684-5853-4_21 - DOI - PubMed

Publication types

MeSH terms

Substances