. 2014 Jun;25(11):1769-81.
doi: 10.1091/mbc.E13-05-0292. Epub 2014 Mar 26.

The KSR2-calcineurin complex regulates STIM1-ORAI1 dynamics and store-operated calcium entry (SOCE)

Affiliations

The KSR2-calcineurin complex regulates STIM1-ORAI1 dynamics and store-operated calcium entry (SOCE)

E Giurisato et al. Mol Biol Cell. 2014 Jun.

Abstract

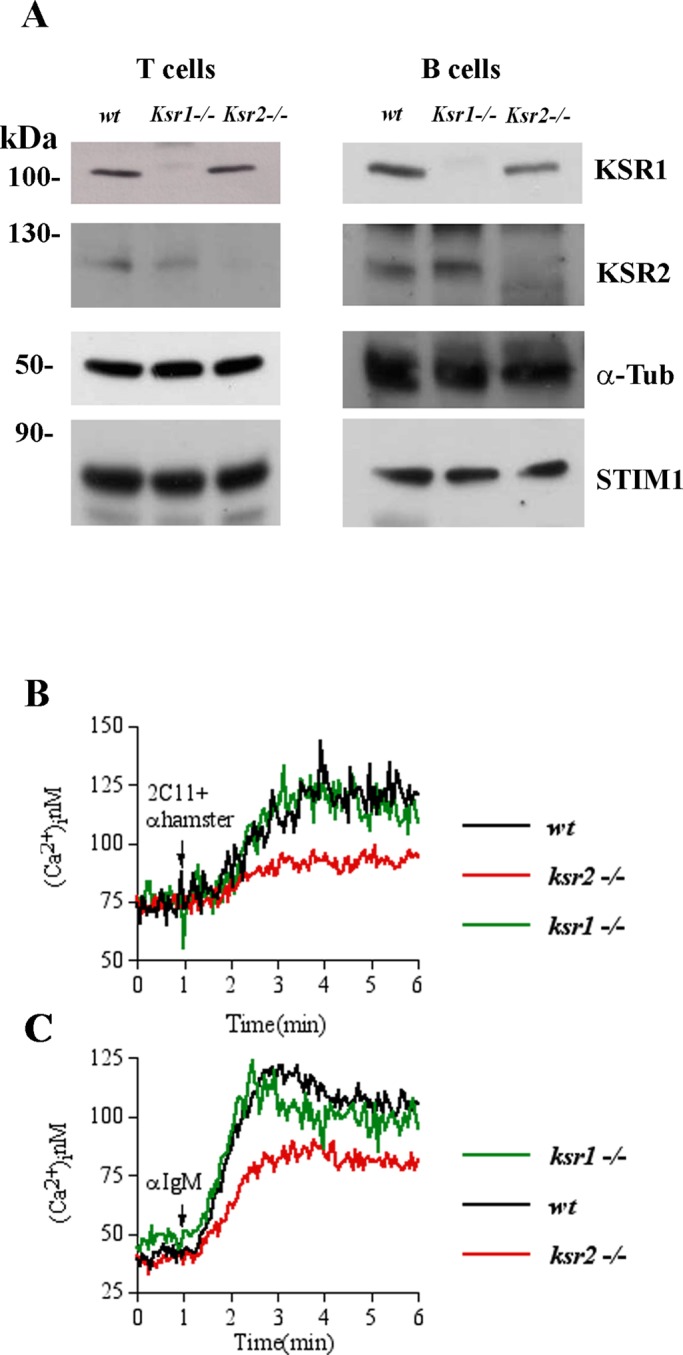
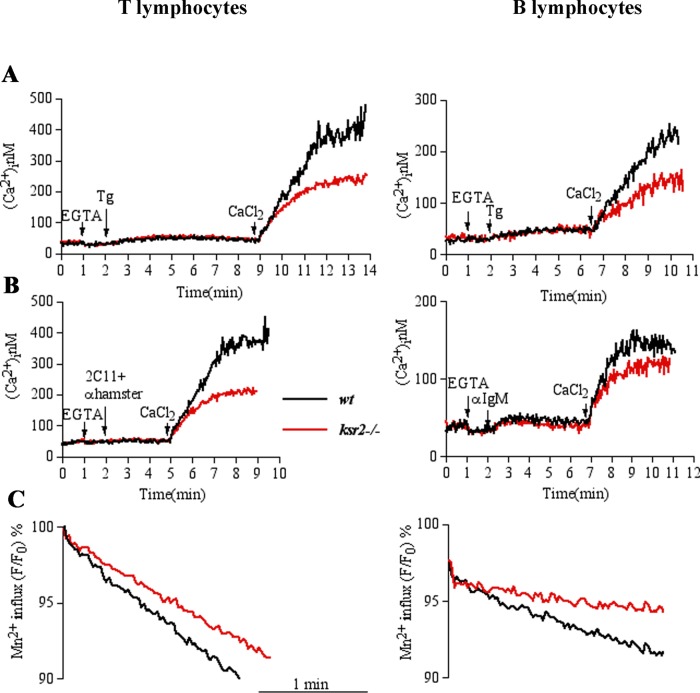
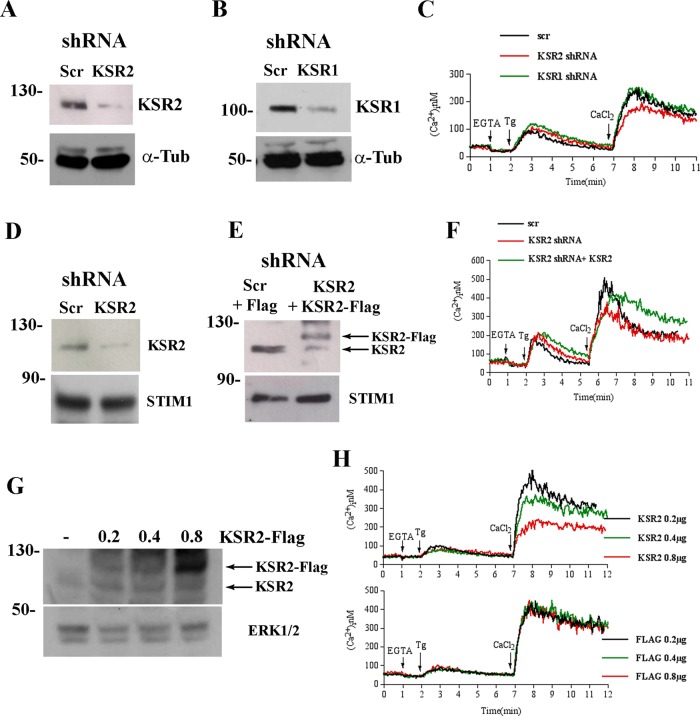
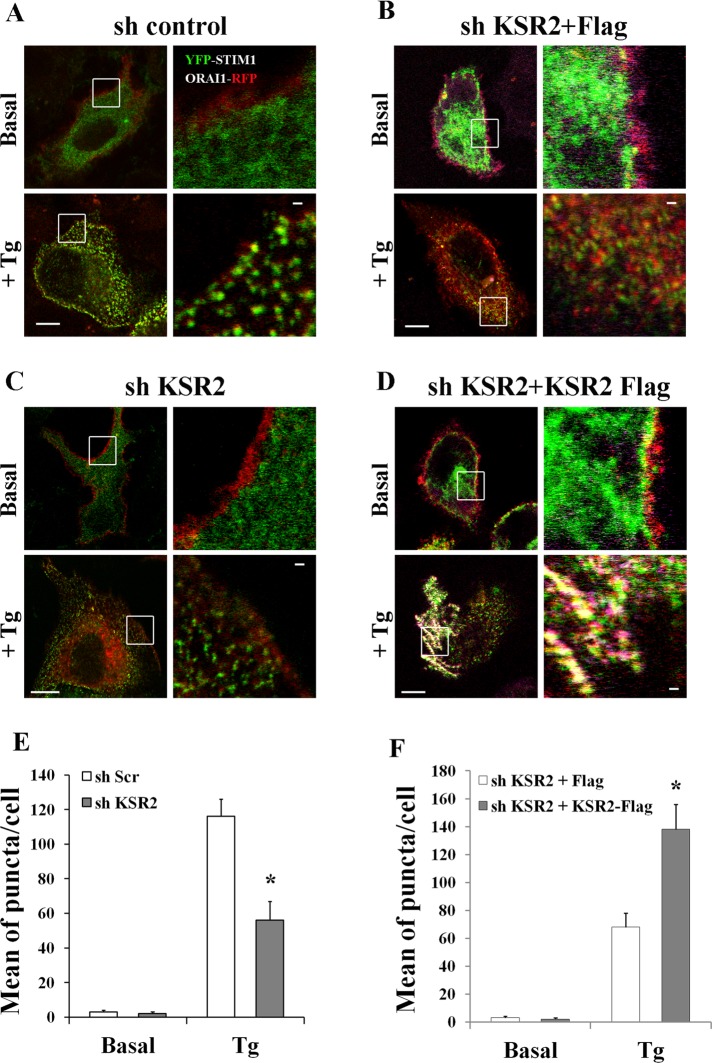
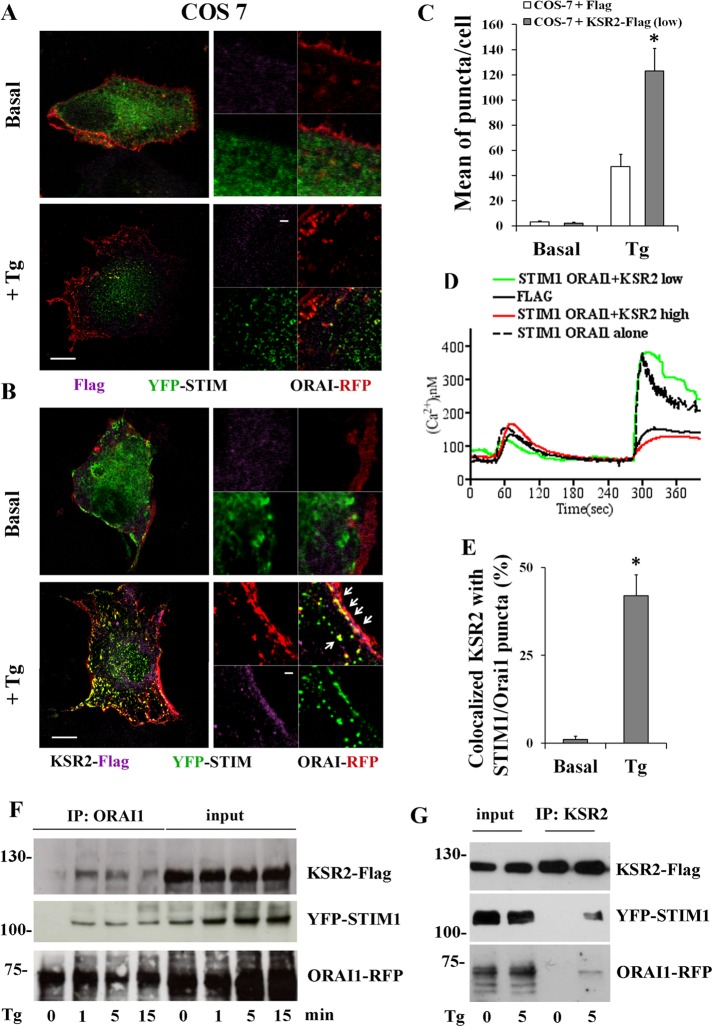
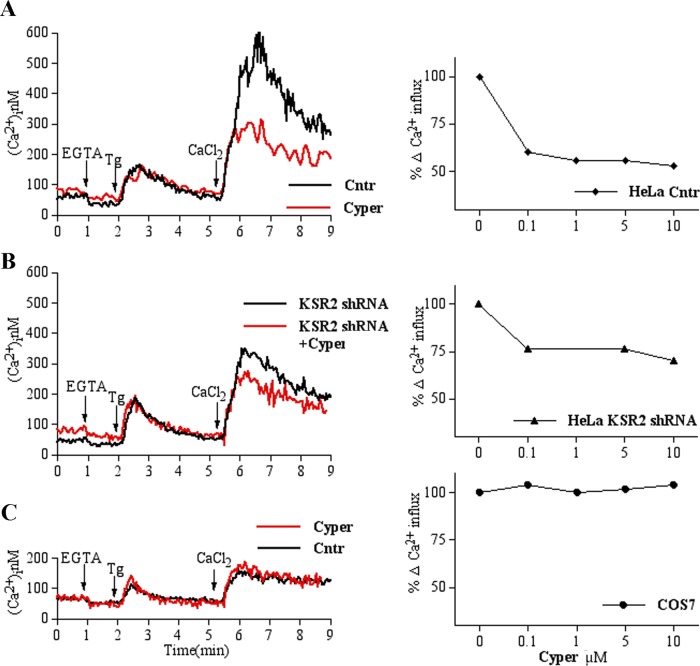
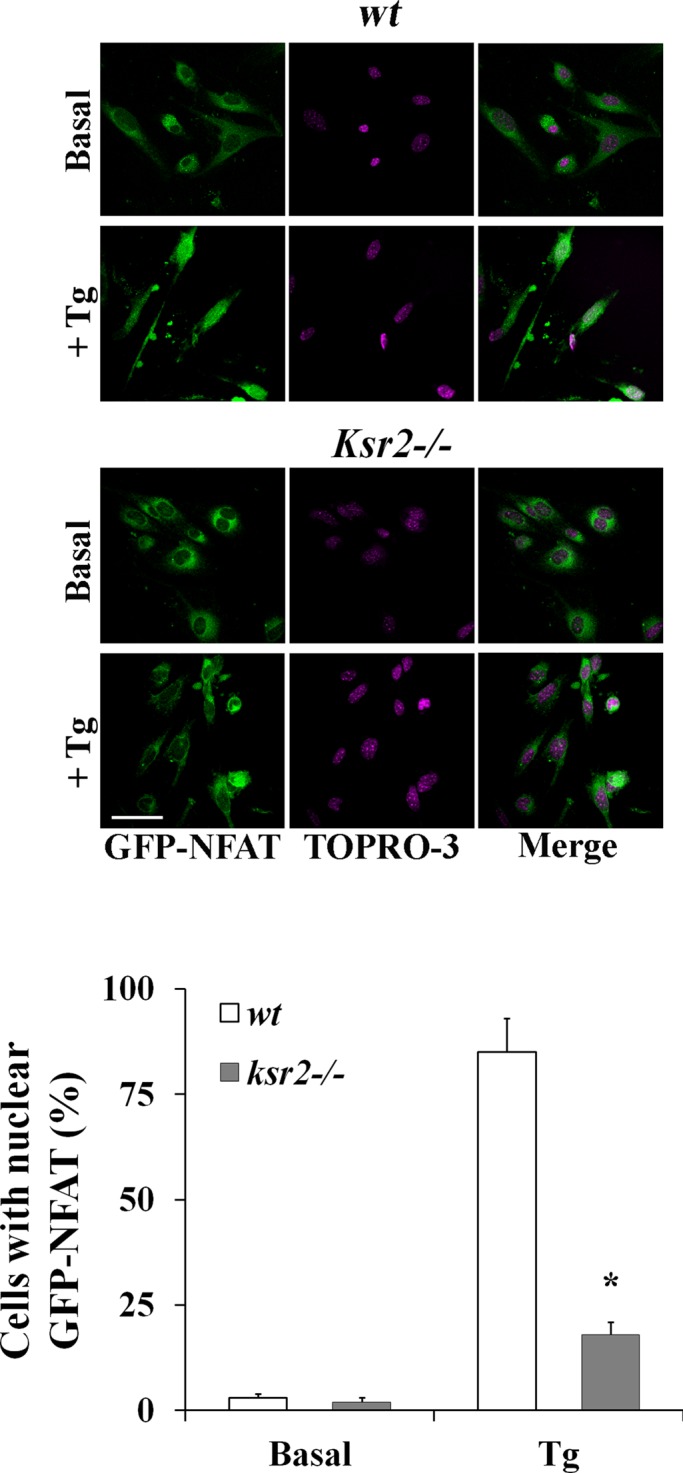
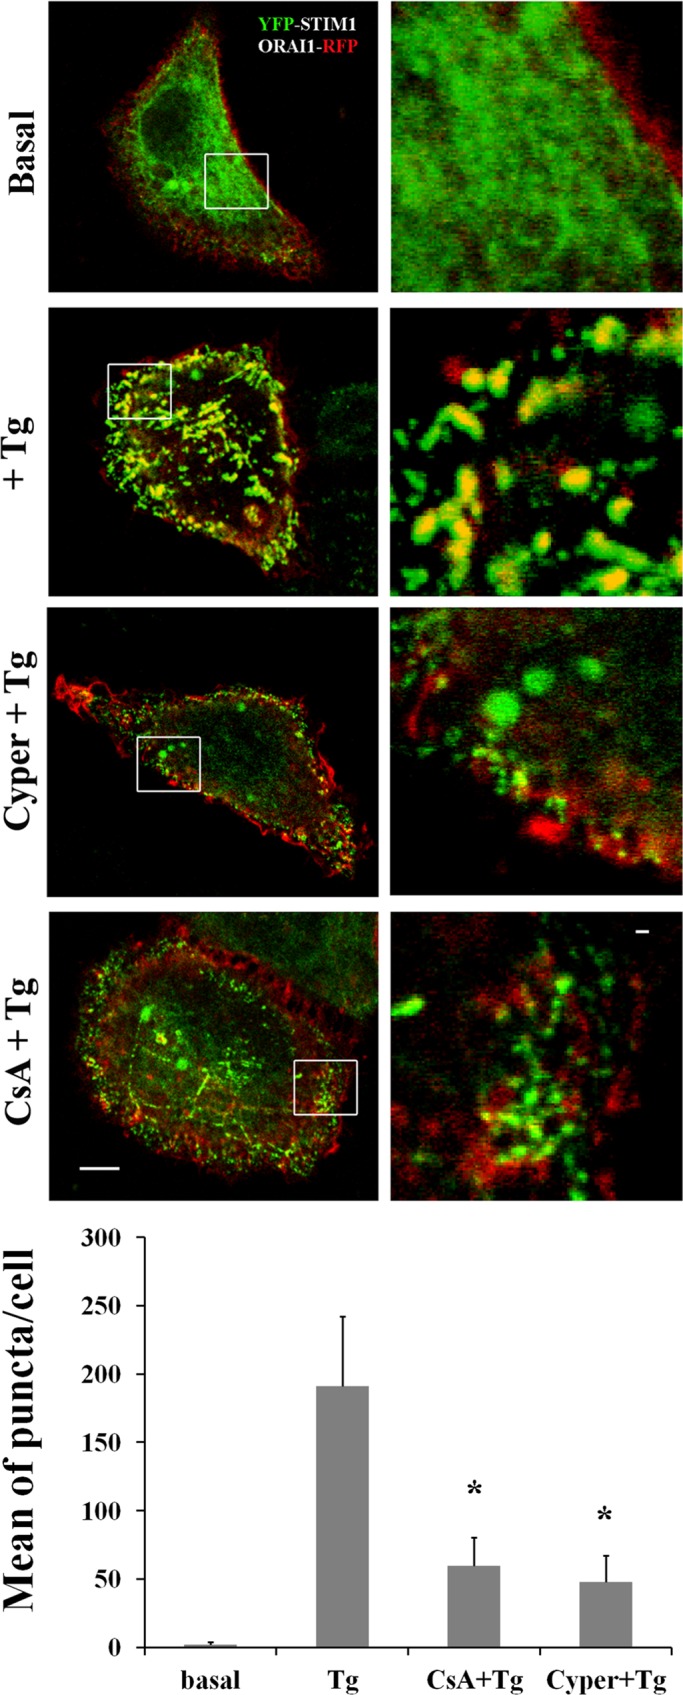
Store-operated calcium entry (SOCE) is the predominant Ca(2+) entry mechanism in nonexcitable cells and controls a variety of physiological and pathological processes. Although significant progress has been made in identifying the components required for SOCE, the molecular mechanisms underlying it are elusive. The present study provides evidence for a direct involvement of kinase suppressor of Ras 2 (KSR2) in SOCE. Using lymphocytes and fibroblasts from ksr2(-/-) mice and shKSR2-depleted cells, we find that KSR2 is critical for the elevation of cytosolic Ca(2+) concentration. Specifically, our results show that although it is dispensable for Ca(2+)-store depletion, KSR2 is required for optimal calcium entry. We observe that KSR2 deficiency affects stromal interaction molecule 1 (STIM1)/ORAI1 puncta formation, which is correlated with cytoskeleton disorganization. Of interest, we find that KSR2-associated calcineurin is crucial for SOCE. Blocking calcineurin activity impairs STIM1/ORAI1 puncta-like formation and cytoskeleton organization. In addition, we observe that calcineurin activity and its role in SOCE are both KSR2 dependent.


Figures

FIGURE 1:
FIGURE 1:
Defective [Ca2+]i elevation in ksr2−/− lymphocytes. (A) Immunoblot analysis of KSR1, KSR2, and STIM1 protein expression in purified T- and B-lymphocytes (15 × 106 cells/condition) from wt, ksr1−/−, and ksr2−/− mice. α-Tubulin (α-Tub) was used as loading control. Left, relative molecular mass (kilodaltons). (B) Elevation of [Ca2+]i induced by anti-CD3 (2C11) followed by anti-IgG antibody (anti-hamster) stimulation was assessed by spectrofluorimetric analysis with Fura-2 in 3 × 10⁶ T-cells purified from wt (black line), ksr1−/− (green line), and ksr2−/− mice (red line). Cells were kept in 1.0 mM Ca2+-containing medium. (C) Elevation of [Ca2+]i induced by anti-IgM stimulation performed in 3 × 10⁶ purified B-cells, as described in B. Traces represent one of three independent experiments.
FIGURE 2:
FIGURE 2:
KSR2 is required for SOCE. T- and B-lymphocytes (3 × 10⁶ cells) purified from wt (black line) or ksr2/ (red line) mice were loaded with Fura-2. The experiments were done in a spectrofluorimeter cuvette in a nominally Ca2+-free medium containing 0.2 mM EGTA. (A) Intracellular Ca2+ stores were depleted with 0.2 μM thapsigargin (Tg); subsequently 1.2 mM Ca2+ was added to the medium to reveal Ca2+ influx. (B) Elevation of [Ca2+]i was induced by anti-CD3 (2C11) followed by anti-IgG antibody (anti-hamster) or anti-IgM stimulation for T- and B-lymphocytes, respectively. (C) Store-dependent Ca2+ influx was also evaluated from the rate of Fura-2 fluorescence quenching by Mn2+ (see Materials and Methods). Fura-2–loaded cells were resuspended in cuvette containing Ca2+-free medium and treated or not with agonists (2C11 + anti-hamster or anti-IgM for T- and B-cells, respectively). After 4 min, 0.1 mM MnCl2 was added. Data (shown after MnCl2 addition) were normalized as percentage of fluorescence values obtained immediately before addition of MnCl2. Traces represent one of three independent experiments.
FIGURE 3:
FIGURE 3:
KSR2 depletion reduces SOCE. Immunoblot analysis showing the reduction of KSR2 (A) or KSR1 (B) in lysates from shRNA KSR2 HEK-293T, and shRNA control HEK-293T (Scr) cells. α-Tubulin (α-Tub) was used as loading control. (C) Spectrofluorimeter analysis of Ca2+ influx in indicated shRNA HEK-293T cells loaded with Fura-2. Ca2+ stores were depleted with 0.2 μM Tg (in Ca2+-free medium), and subsequently 1.2 mM Ca2+ was added to the medium to reveal Ca2+ influx. (D) Immunoblot analysis of KSR2 and STIM1 in lysates from shRNA KSR2 HeLa and shRNA control HeLa (Scr) cells. (E) Immunoblot analysis of KSR2 and STIM1in lysates from shRNA control HeLa (Scr) transfected with 0.2 μg of Flag or shRNA KSR2 HeLa transfected with 0.2 μg of KSR2-Flag. Lysates were blotted for KSR2 and STIM1. (F) Spectrofluorimeter analysis of Ca2+ influx in indicated shRNA HeLa cells loaded with Fura-2. Ca2+ influx was analyzed as in C. (G) Immunoblot analysis showing the presence of KSR2 in lysates from HEK-293T cells transfected as indicated. Lysates were blotted for KSR2. ERK1/2 was used as loading control. (H) Spectrofluorimeter analysis of 1 × 10⁶ HEK-293T cells transfected with expression vectors encoding KSR2-Flag at different doses (0.2, 0.4, 0.8 μg; top) or Flag alone as control (bottom). Elevation of [Ca2+]i was measured with Fura-2 as described in C. Traces represent one of three independent experiments.
FIGURE 4:
FIGURE 4:
STIM1-ORAI1 puncta-like formation is impaired in KSR2-depleted HeLa cells. (A–C) ShRNA control and shRNA KSR2 HeLa cells were grown on coverslips and cotransfected with expression vectors encoding YFP-STIM1 (0.2 μg) and ORAI1-RFP (0.2 μg). After starvation for 2 h, cells were stimulated either without (basal) or with 1 μM Tg. Distribution of Tg-induced STIM1-ORAI1 puncta formation (yellow dots) was visualized under confocal microscopy. Bar, 5 μm. (B–D) shRNA KSR2–depleted HeLa cells were cotransfected with expression vectors encoding YFP-STIM1 (0.2 μg) and ORAI1-RFP (0.2 μg) and Flag alone 0.2 μg (B) or KSR2-Flag 0.2 μg (D). After starvation, cells were stimulated as in A–C. Cells were fixed, permeabilized, and incubated with anti-Flag antibody, followed by Alexa Fluor 647–labeled secondary antibody. Tg-induced STIM1-ORAI1 puncta formation (yellow dots) was visualized under confocal microscopy. Bar, 5 μm. One representative cell of >30 cells in three experiments. White squares show enlarged images. Bar, 1 μm. The graph bars illustrate the mean per cell ± SEM of puncta in response to Tg treatment in >30 cells/condition. Significance of values is compared with control Tg-treated cells. *p < 0.05.
FIGURE 5:
FIGURE 5:
KSR2 is required for puncta formation and colocalizes with STIM1-ORAI1. (A, B) COS-7 cells were cotransfected with expression vectors encoding YFP-STIM1 (0.2 μg), ORAI1-RFP (0.2 μg), and 0.2 μg of Flag alone (A) or 0.2 μg of KSR2-Flag (B). After starvation, cells were either stimulated without (basal) or with 1 μM Tg. Cells were fixed, permeabilized, and incubated with anti-Flag antibody, followed by Alexa Fluor 647–labeled secondary antibody. Tg-induced STIM1-ORAI1 puncta formation (yellow dots) was visualized under confocal microscopy. Bar, 5 μm. One representative cell of >30 cells in three experiments. White squares show enlarged images. The colocalization of KSR2 with puncta (as indicated by white arrows) was evaluated by performing fluorescence intensity profiles along a straight line where fluorescent signals were colocalized. Bar, 1 μm. (C) The graph bars illustrate the mean per cell ± SEM of puncta in response to Tg treatment in >30 cells/condition. Significance of values is compared with control Tg-treated cells. *p < 0.05. (D) Intracellular Ca2+ concentration was monitored by video imaging experiments in COS-7 cells transfected with STIM1 and ORAI1 (black dotted line) as in B or cotransfected with KSR2-Flag 0.2 μg (low, green line) or KSR2-Flag 0.8 μg (high, red line). As control, COS-7 cells were cotransfected with Flag alone (black line). Ca2+ stores were depleted with 0.5 μM Tg in the absence of extracellular Ca2+ and the presence of 0.5 mM EGTA. Subsequently the medium was changed with one that contains 1.5 mM Ca2+ to reveal Ca2+ influx. Each trace represents the average response of all the fluorescent cells on a single coverslip. (E) The graph bars illustrate the percentage of KSR2 colocalized with STIM1-ORAI1 puncta per cell ± SEM in response to Tg treatment in >30 cells/condition. Significance of values is compared with control Tg-treated cells. *p < 0.05. (F) Western blot illustrating coimmunoprecipitation of KSR2 with STIM1-ORAI1 puncta. COS-7 cells were cotransfected as described in B and stimulated with 1 μM Tg at the indicated times (in minutes). ORAI1 immunoprecipitates (IPs) were prepared and analyzed by immunoblotting using anti-KSR2. The membrane was then stripped and reprobed with anti-STIM1 and then anti-ORAI1. One representative experiment of three is shown. Left, relative molecular mass (kilodaltons). (G) Inverse coimmunoprecipitation of KSR2 with STIM1-ORAI1. COS-7 cells were cotransfected and stimulated as described in B. KSR2 IPs were prepared and analyzed by immunoblotting as in F. One representative experiment of three is shown.
FIGURE 6:
FIGURE 6:
SOCE is reduced by Cyper pretreatment only in KSR2-expressing cells. Left: (A) HeLa cells loaded with Fura-2 were analyzed by spectrofluorimeter as described in Figure 3F. Black and red traces represent, respectively, cells pretreated without or with 5 μM Cyper for 15 min at 37°C. The traces show a representative experiments that was repeated at least in triplicate. (B) Elevation of [Ca2+]i was measured in shRNA KSR2 HeLa as described in A. (C) Analysis of SOCE in COS-7 cells loaded with Fura-2 as described in A. Right: Cells were pretreated for 15 min at 37°C with the indicated Cyper concentrations, and peak values of Tg-dependent Ca2+ entry after Ca2+ readmission were calculated. Percentage of residual Ca2+ influx after Cyper treatment compared with maximal Ca2+ peak of their respective vehicle-pretreated controls. Values are mean ± SEM of at least three independent experiments.
FIGURE 7:
FIGURE 7:
KSR2 is required for CN activation. (A) Confocal microscopy of NFAT nuclear translocation in wt (top) and ksr2−/− (bottom) fibroblasts expressing GFP-NFAT (green) and stimulated without (basal) or with 1 μM Tg for 30 min followed by TO-PRO-3 staining of the nucleus (purple). The merge of NFAT and TO-PRO-3 staining (right) shows the NFAT translocation into the nucleus in wt cells. Representative cells for each condition of three experiments is shown. Quantitative analysis (mean ± SD) of wt and ksr2−/− cells with nuclear GFP-NFAT before and after stimulation with Tg from three experiments is shown in the graph bars. *p < 0.01. Bar, 5 μm.
FIGURE 8:
FIGURE 8:
Calcineurin inhibition reduces STIM-ORAI puncta formation. Representative images of HeLa cells coexpressing YFP-STIM1 (0.2 μg) and ORAI1-RFP (0.2 μg). Cells were starved overnight and then stimulated without (basal) or with 1 μM Tg (+Tg) and pretreated or not with 10 μM Cyper or CsA. Bar, 5 μM. White squares show enlarged images. Bar, 1 μM. The quantification of puncta, expressed as mean per cell ± SEM, is based on the number of cells indicated in parentheses: basal (20); Tg (25); CsA+Tg (28); Cyper+Tg (26). The number of puncta formed in response to Tg treatment and the effect of inhibition of CN are shown in the graph bars. Significance of values is compared with control Tg-treated cells. *p < 0.01.

Similar articles

Cited by

References

    1. Cacace AM, Michaud NR, Therrien M, Mathes K, Copeland T, Rubin GM, Morrison DK. Identification of constitutive and ras-inducible phosphorylation sites of KSR: implications for 14-3-3 binding, mitogen-activated protein kinase binding, and KSR overexpression. Mol Cell Biol. 1999;19:229–240. - PMC - PubMed
    1. Cantini M, Giurisato E, Radu C, Tiozzo S, Pampinella F, Senigaglia D, Zaniolo G, Mazzoleni F, Vitiello L. Macrophage-secreted myogenic factors: a promising tool for greatly enhancing the proliferative capacity of myoblasts in vitro and in vivo. Neurol Sci. 2002;23:189–194. - PubMed
    1. Carafoli E. The calcium-signalling saga: tap water and protein crystals. Nat Rev Mol Cell Biol. 2003;4:326–332. - PubMed
    1. Costanzo-Garvey DL, et al. KSR2 is an essential regulator of AMP kinase, energy expenditure, and insulin sensitivity. Cell Metab. 2009;10:366–378. - PMC - PubMed
    1. Dolmetsch RE, Keli X, Lewis RS. Calcium oscillations increase the efficiency and specificity of gene expression. Nature. 1998;392:933–936. - PubMed

Publication types

MeSH terms