. 2012 Jun;2(2):112-20.
doi: 10.1556/EuJMI.2.2012.2.3. Epub 2012 Jun 13.

Impact of enzymatic tissue disintegration on the level of surface molecule expression and immune cell function

Impact of enzymatic tissue disintegration on the level of surface molecule expression and immune cell function

A Autengruber et al. Eur J Microbiol Immunol (Bp). 2012 Jun.

Abstract

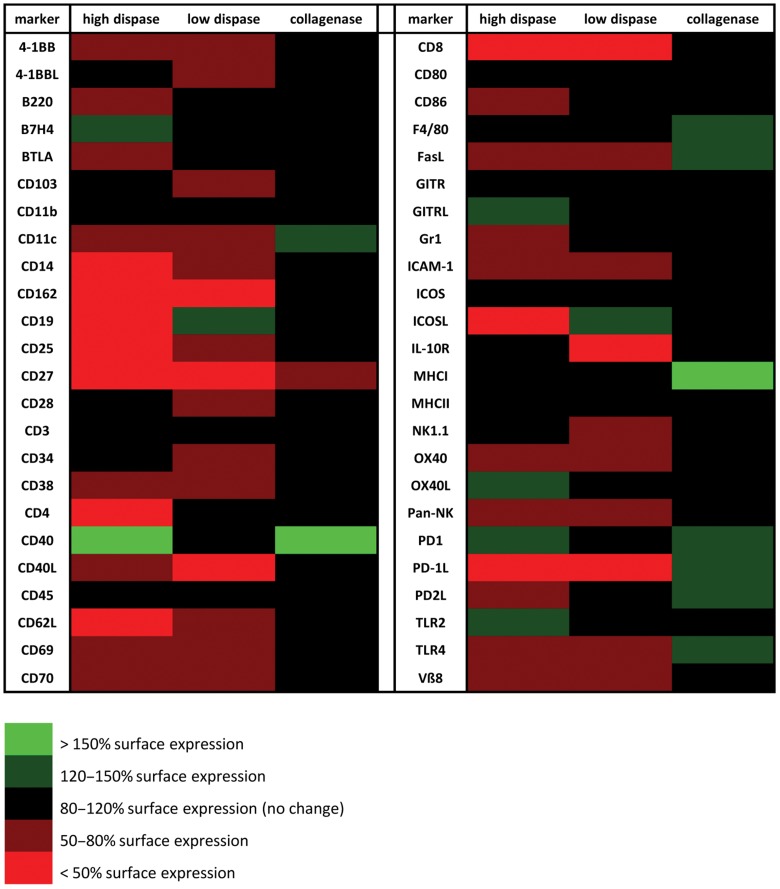
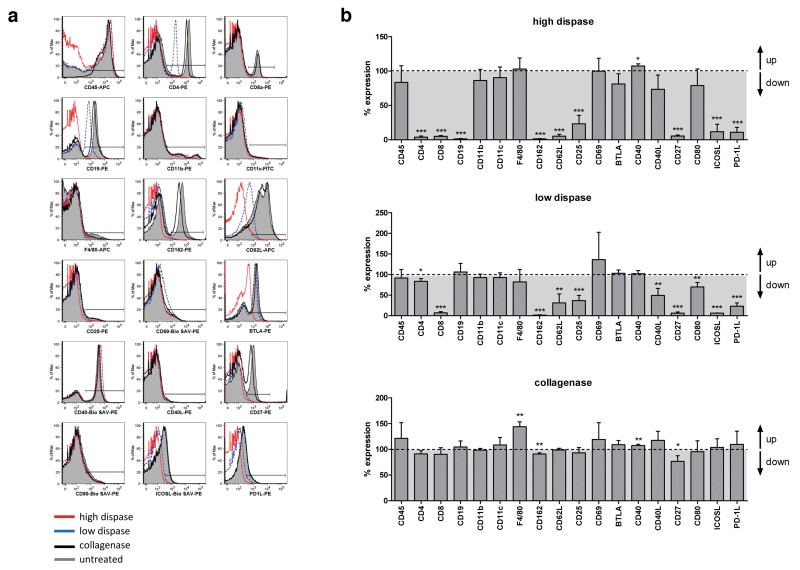
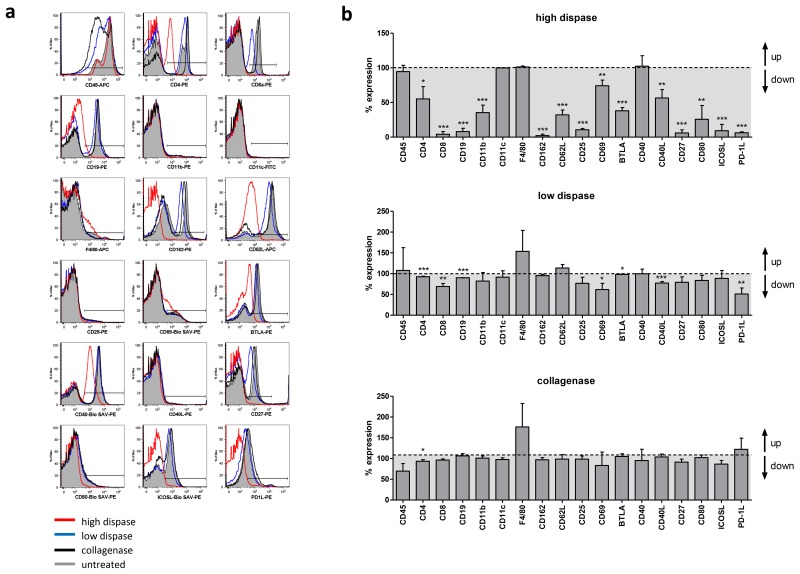
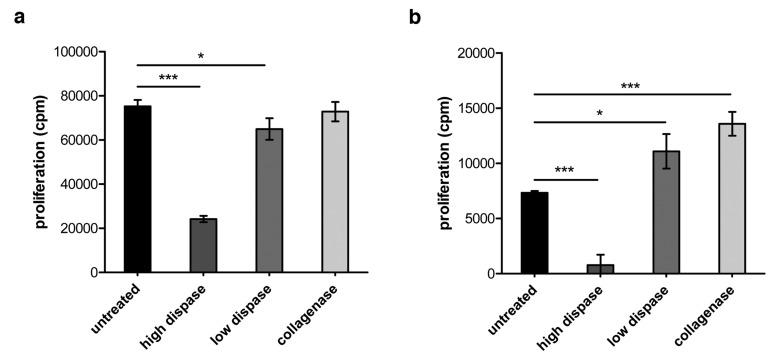
Immunological characterization of immune cells that reside in specific anatomic compartments often requires their isolation from the respective tissue on the basis of enzymatic tissue disintegration. Applying enzymatic digestion of primary splenocytes, we evaluated the impact of collagenase and dispase, two enzymes that are commonly used for the liberation of immune cells from tissues, on the detectability of 48 immunologically relevant surface molecules that are frequently used for flow cytometric identification, isolation, and characterization of immune cell subsets. Whereas collagenase treatment had only minor effects on surface expression of most molecules tested, dispase treatment considerably affected antibody-mediated detectability of the majority of surface markers in subsequent FACS analyses. This effect was long lasting and, in case of high-dose dispase treatment, evident for the majority of surface molecules even after 24 h of in vitro culture. Of note, high-dose dispase treatment not only affected surface expression of certain molecules but also impaired antigen-specific proliferation of CD4(+) and CD8(+) T cells. Together, our data indicate that enzymatic tissue disintegration can have profound effects on the expression of a variety of cell-surface molecules with direct consequences for phenotypic analysis, FACS- and MACS-based target cell isolation, and immune cell function in cell culture experiments.

Keywords: T cell proliferation; collagenase; dispase; enzymatic digestion; flow cytometry; surface molecules.


Figures

Fig. 1.
Fig. 1.
Enzymatic digestion broadly affects surface marker expression. BALB/c splenocytes were digested with collagenase D (0.044 U/ml) or high (50 U/ml) or low (0.8 U/ml) concentrations of dispase I, respectively, followed by antibody staining of 48 selected surface markers and FACS analysis. Percent positive cells obtained after enzymatic digestion was normalized to surface marker expression on untreated splenocytes which was arbitrarily set to 100%. Green color indicates elevated surface expression following enzymatic digestion, red color indicates reduced surface expression; black indicates no change in surface expression
Fig. 2.
Fig. 2.
Quantification of the impact of collagenase and dispase treatment on surface expression of selected markers. (a) Splenocytes were digested with either collagenase D or different dispase I concentrations as described in Materials and methods, followed by antibody staining of selected surface molecules and FACS analysis. Untreated splenocytes served as internal control. Histograms show representative results obtained in one out of three independent experiments. (b) Data obtained from three independent digestion experiments were combined to quantify the impact of enzymatic treatment on surface expression levels of all 18 markers tested. For every marker analyzed, percent expression after enzymatic treatment was normalized to marker expression on untreated splenocytes which was defined as 100%. p values were calculated using t-test, and p<0.05 is indicated as *, p<0.01 is indicated as **, and p<0.001 is indicated as ***
Fig. 3.
Fig. 3.
Partial recovery of surface molecule expression on immune cells following 24 h in vitro culture after enzymatic digestion. (a) Splenocytes were digested with either collagenase D or different dispase I concentrations as described in Materials and methods, followed by 24 h in vitro culture in IMDM compl. at 37 °C and 5% CO2. Cells were harvested and stained for subsequent FACS analysis with the antibodies indicated on the x axis of the histograms. Untreated splenocytes served as internal control. Histograms show representative results obtained in one out of three independent experiments. (b) Data obtained from three independent digestion experiments were combined to quantify the impact of enzymatic treatment on surface expression levels of all 18 markers tested. For every marker analyzed, percent expression after enzymatic treatment was normalized to marker expression on untreated splenocytes which was defined as 100%. p values were calculated using t-test; p<0.05 is indicated as *, p<0.01 is indicated as ** and p<0.001 is indicated as ***
Fig. 4.
Fig. 4.
Impact of enzymatic digestion on proliferative capacity of CD4+ and CD8+ T cells. (a) Splenocytes were isolated from TCR-HA mice and treated with collagenase or dispase as described in the section Materials and methods. Subsequently, 5 × 10⁵ enzyme-treated spleen cells and untreated control cells were seeded per well of a 96-well microtiter plate and stimulated in vitro with 0.01 µg/ml of the corresponding HA peptide 110–120 for 24 h. 3[H]-thymidine was added for another 16 h of culture before harvesting the cells and scintillation counting to determine antigen-specific CD4+ T cell proliferation. (b) 1 × 10⁵ splenocytes isolated from CL4 mice and treated with the respective enzymes were stimulated in vitro with 0.001 µg/ml of the corresponding HA peptide 512–520 for 24 h before the addition of 3[H]-thymidine and further culture for 12 h. Radioactively labeled cells were harvested, and antigen-specific CD8+ T cell proliferation was determined by scintillation counting. p values were calculated using t-test; p<0.05 is indicated as *, and p<0.001 is indicated as ***

References

    1. Kroemer G, Cuende E, Martínez C. Compartmentalization of the peripheral immune system. Adv Immunol. 1993;53:157–216. - PubMed
    1. Arstila T, Arstila TP, Calbo S, Selz F, Malassis-Seris M, Vassalli P, Kourilsky P, Guy-Grand D. Identical T cell clones are located within the mouse gut epithelium and lamina propia and circulate in the thoracic duct lymph. J Exp Med. 2000 Mar 6;191(5):823–834. - PMC - PubMed
    1. Bruder D, Westendorf AM, Geffers R, Gruber AD, Gereke M, Enelow RI, Buer J. CD4 T Lymphocyte-mediated lung disease: steady state between pathological and tolerogenic immune reactions. Am J Respir Crit Care Med. 2004 Dec 1;170(11):1145–1152. - PubMed
    1. Derbinski J, Schulte A, Kyewski B, Klein L. Promiscuous gene expression in medullary thymic epithelial cells mirrors the peripheral self. Nat Immunol. 2001 Nov;2(11):1032–1039. - PubMed
    1. Sedgwick JD, Schwender S, Imrich H, Dörries R, Butcher GW, ter Meulen V. Isolation and direct characterization of resident microglial cells from the normal and inflamed central nervous system. Proc Natl Acad Sci U S A. 1991 Aug 15;88(16):7438–7442. - PMC - PubMed

LinkOut - more resources