Test-Retest Reliability of Diffusion Tensor Imaging in Huntington's Disease
- PMID: 24672743
- PMCID: PMC3962450
- DOI: 10.1371/currents.hd.f19ef63fff962f5cd9c0e88f4844f43b
Test-Retest Reliability of Diffusion Tensor Imaging in Huntington's Disease
Abstract
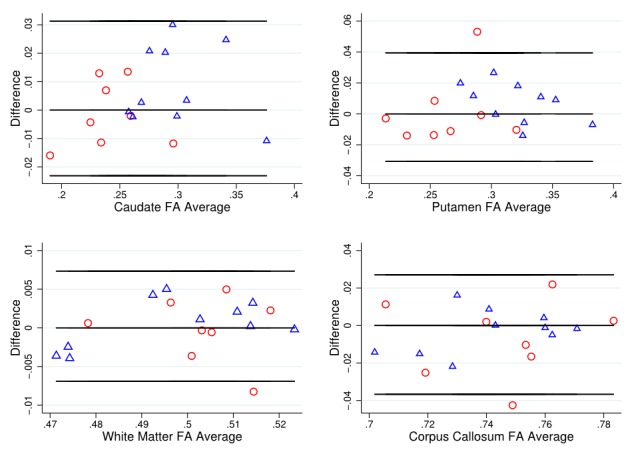
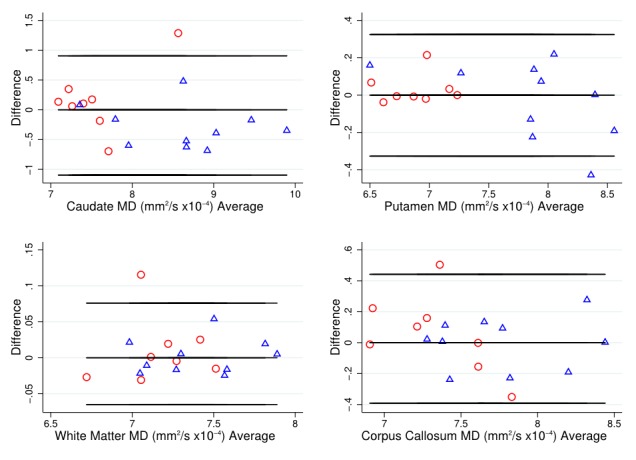
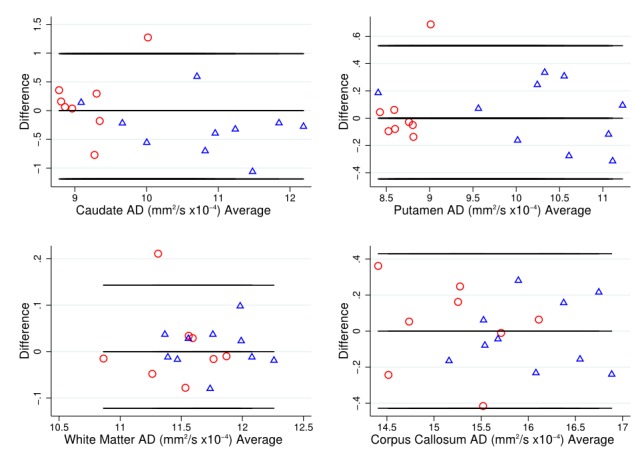
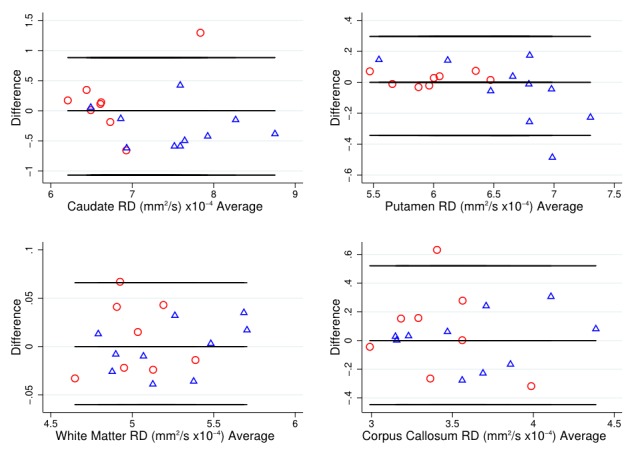
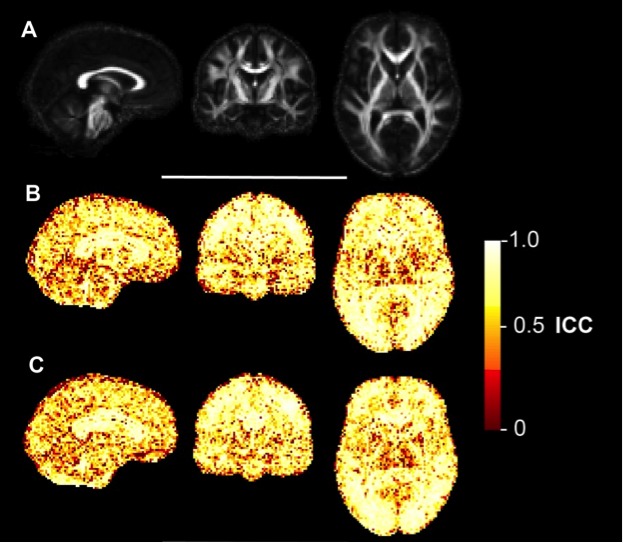
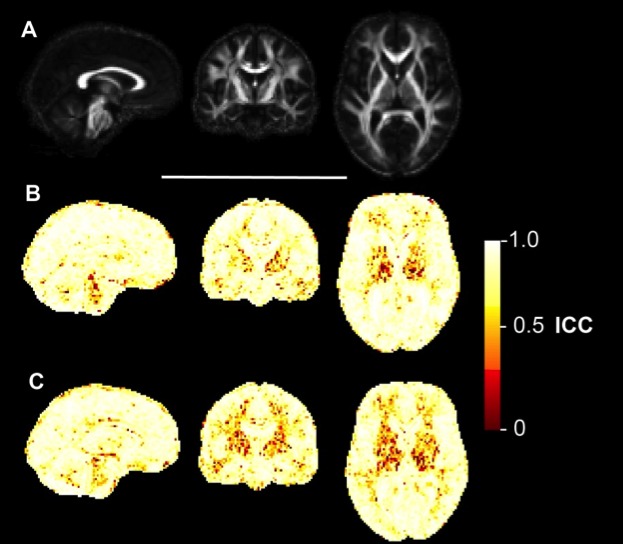
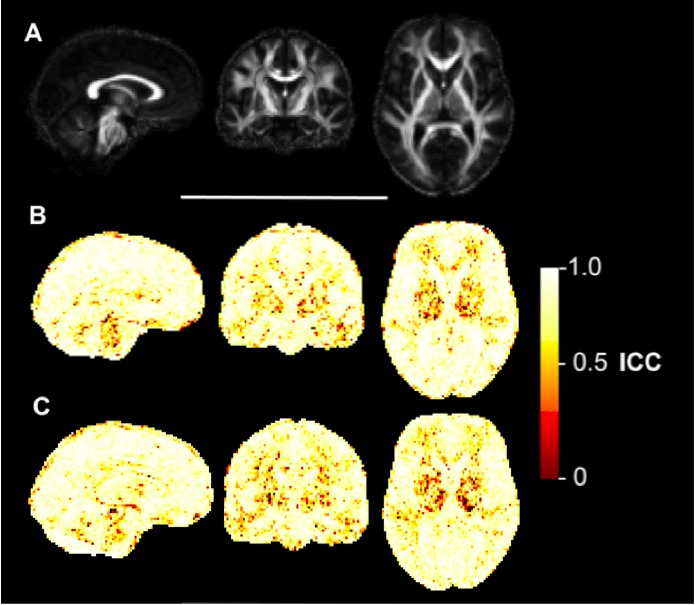
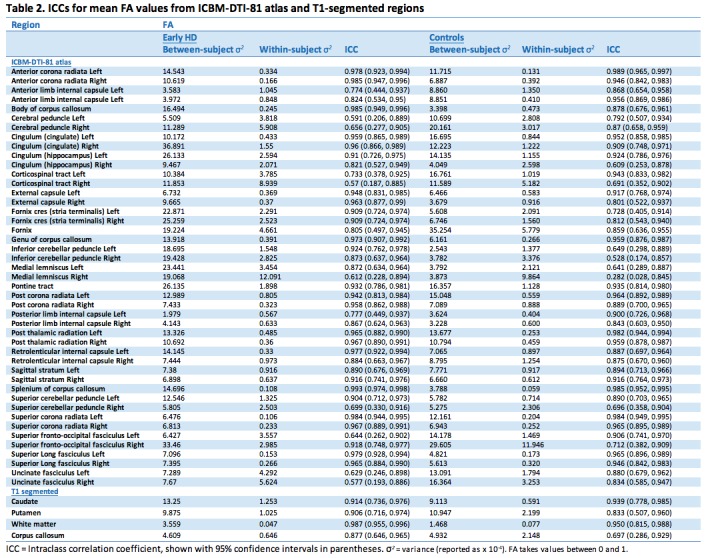
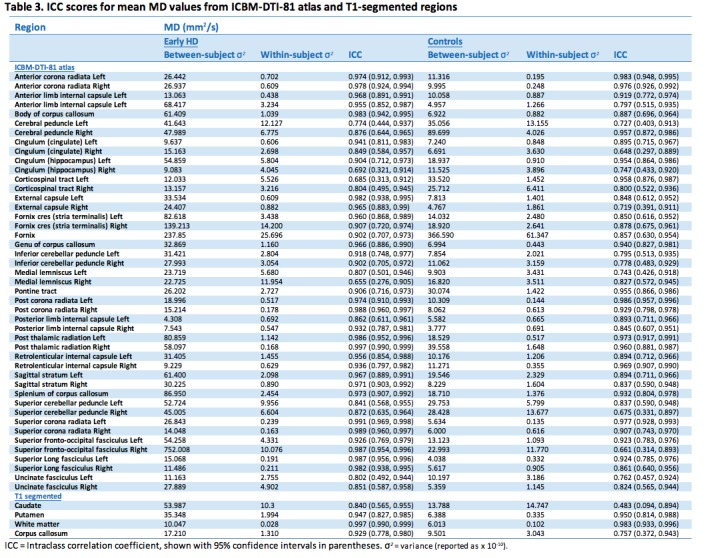
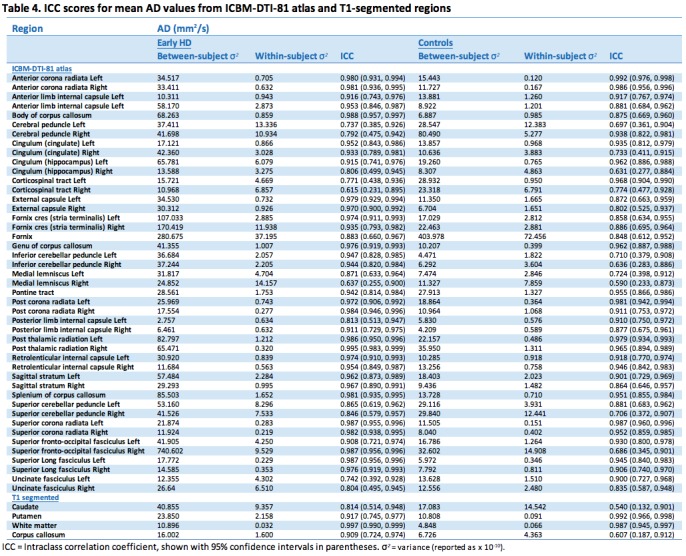
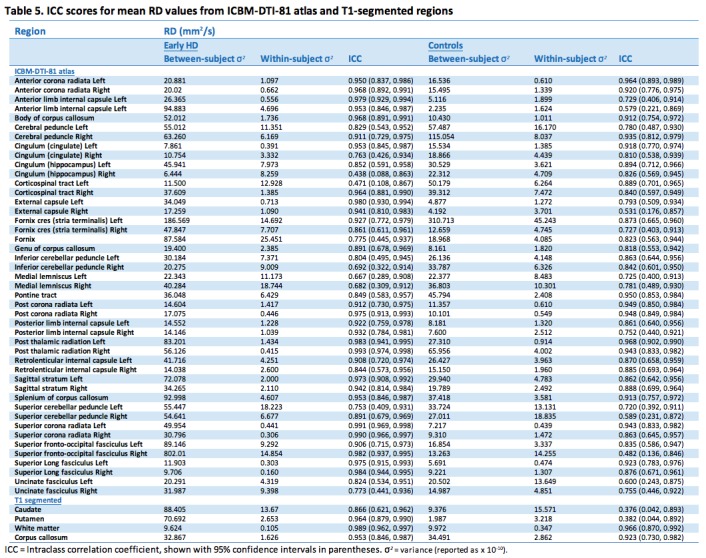
Diffusion tensor imaging (DTI) has shown microstructural abnormalities in patients with Huntington's Disease (HD) and work is underway to characterise how these abnormalities change with disease progression. Using methods that will be applied in longitudinal research, we sought to establish the reliability of DTI in early HD patients and controls. Test-retest reliability, quantified using the intraclass correlation coefficient (ICC), was assessed using region-of-interest (ROI)-based white matter atlas and voxelwise approaches on repeat scan data from 22 participants (10 early HD, 12 controls). T1 data was used to generate further ROIs for analysis in a reduced sample of 18 participants. The results suggest that fractional anisotropy (FA) and other diffusivity metrics are generally highly reliable, with ICCs indicating considerably lower within-subject compared to between-subject variability in both HD patients and controls. Where ICC was low, particularly for the diffusivity measures in the caudate and putamen, this was partly influenced by outliers. The analysis suggests that the specific DTI methods used here are appropriate for cross-sectional research in HD, and give confidence that they can also be applied longitudinally, although this requires further investigation. An important caveat for DTI studies is that test-retest reliability may not be evenly distributed throughout the brain whereby highly anisotropic white matter regions tended to show lower relative within-subject variability than other white or grey matter regions.
Figures

Similar articles
-
Test-retest reliability of diffusion tensor imaging scalars in 5-year-olds.Hum Brain Mapp. 2022 Nov;43(16):4984-4994. doi: 10.1002/hbm.26064. Epub 2022 Sep 13. Hum Brain Mapp. 2022. PMID: 36098477 Free PMC article.
-
White matter integrity in premanifest and early Huntington's disease is related to caudate loss and disease progression.Cortex. 2014 Mar;52:98-112. doi: 10.1016/j.cortex.2013.11.009. Epub 2013 Dec 6. Cortex. 2014. PMID: 24405816
-
Diffusion imaging studies of Huntington's disease: A meta-analysis.Parkinsonism Relat Disord. 2016 Nov;32:94-101. doi: 10.1016/j.parkreldis.2016.09.005. Epub 2016 Sep 7. Parkinsonism Relat Disord. 2016. PMID: 27624391 Review.
-
Longitudinal change in white matter microstructure in Huntington's disease: The IMAGE-HD study.Neurobiol Dis. 2015 Feb;74:406-12. doi: 10.1016/j.nbd.2014.12.009. Epub 2014 Dec 12. Neurobiol Dis. 2015. PMID: 25497085
-
The role of diffusion tensor imaging and fractional anisotropy in the evaluation of patients with idiopathic normal pressure hydrocephalus: a literature review.Neurosurg Focus. 2016 Sep;41(3):E12. doi: 10.3171/2016.6.FOCUS16192. Neurosurg Focus. 2016. PMID: 27581308 Review.
Cited by
-
Assessing the performance of different DTI motion correction strategies in the presence of EPI distortion correction.Hum Brain Mapp. 2016 Dec;37(12):4405-4424. doi: 10.1002/hbm.23318. Epub 2016 Jul 20. Hum Brain Mapp. 2016. PMID: 27436169 Free PMC article.
-
A prospective harmonized multicenter DTI study of cerebral white matter degeneration in ALS.Neurology. 2020 Aug 25;95(8):e943-e952. doi: 10.1212/WNL.0000000000010235. Epub 2020 Jul 9. Neurology. 2020. PMID: 32646955 Free PMC article.
-
Scan-rescan repeatability and cross-scanner comparability of DTI metrics in healthy subjects in the SPRINT-MS multicenter trial.Magn Reson Imaging. 2018 Nov;53:105-111. doi: 10.1016/j.mri.2018.07.011. Epub 2018 Jul 23. Magn Reson Imaging. 2018. PMID: 30048675 Free PMC article.
-
Topological state-space estimation of functional human brain networks.PLoS Comput Biol. 2024 May 13;20(5):e1011869. doi: 10.1371/journal.pcbi.1011869. eCollection 2024 May. PLoS Comput Biol. 2024. PMID: 38739671 Free PMC article.
-
Neuroimaging to Facilitate Clinical Trials in Huntington's Disease: Current Opinion from the EHDN Imaging Working Group.J Huntingtons Dis. 2024;13(2):163-199. doi: 10.3233/JHD-240016. J Huntingtons Dis. 2024. PMID: 38788082 Free PMC article. Review.
References
-
- Bohanna I, Georgiou-Karistianis N, Sritharan A, Asadi H, Johnston L, Churchyard A, Egan G. Diffusion tensor imaging in Huntington's disease reveals distinct patterns of white matter degeneration associated with motor and cognitive deficits. Brain Imaging Behav. 2011 Sep;5(3):171-80. PubMed PMID:21437574. - PubMed
-
- Della Nave R, Ginestroni A, Tessa C, Giannelli M, Piacentini S, Filippi M, Mascalchi M. Regional distribution and clinical correlates of white matter structural damage in Huntington disease: a tract-based spatial statistics study. AJNR Am J Neuroradiol. 2010 Oct;31(9):1675-81. PubMed PMID:20488902. - PMC - PubMed
-
- Douaud G, Behrens TE, Poupon C, Cointepas Y, Jbabdi S, Gaura V, Golestani N, Krystkowiak P, Verny C, Damier P, Bachoud-Lévi AC, Hantraye P, Remy P. In vivo evidence for the selective subcortical degeneration in Huntington's disease. Neuroimage. 2009 Jul 15;46(4):958-66. PubMed PMID:19332141. - PubMed
-
- Hobbs NZ, Cole JH, Farmer RE, Rees EM, Crawford HE, Malone IB, Roos RA, Sprengelmeyer R, Durr A, Landwehrmeyer B, Scahill RI, Tabrizi SJ, Frost C. Evaluation of multi-modal, multi-site neuroimaging measures in Huntington's disease: Baseline results from the PADDINGTON study. Neuroimage Clin. 2012 Dec 9;2:204-11. PubMed PMID:24179770. - PMC - PubMed
-
- Delmaire C, Dumas EM, Sharman MA, van den Bogaard SJ, Valabregue R, Jauffret C, Justo D, Reilmann R, Stout JC, Craufurd D, Tabrizi SJ, Roos RA, Durr A, Lehéricy S. The structural correlates of functional deficits in early huntington's disease. Hum Brain Mapp. 2013 Sep;34(9):2141-53. PubMed PMID:22438242. - PMC - PubMed
LinkOut - more resources
Full Text Sources
Other Literature Sources