. 2014 Mar 6;2(3):282-94.
doi: 10.1016/j.stemcr.2014.01.015. eCollection 2014 Mar 11.

Quality metrics for stem cell-derived cardiac myocytes

Affiliations

Quality metrics for stem cell-derived cardiac myocytes

Sean P Sheehy et al. Stem Cell Reports. .

Abstract

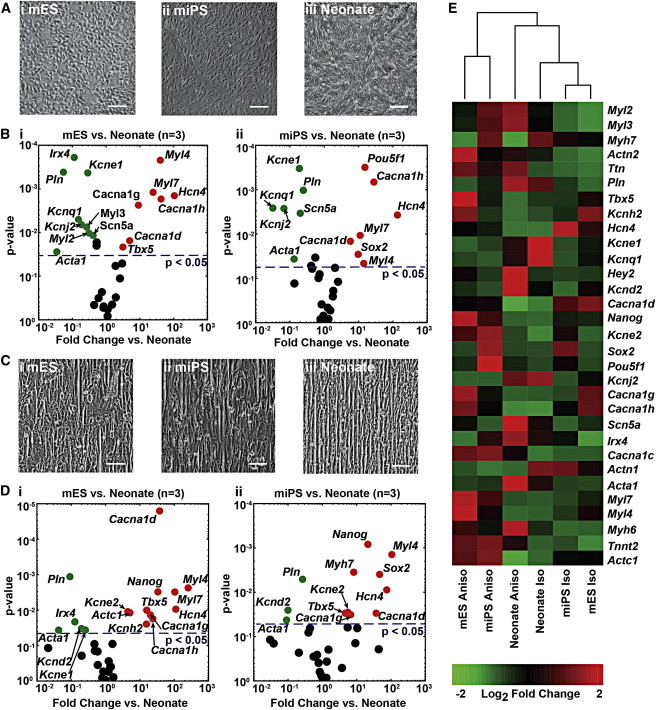
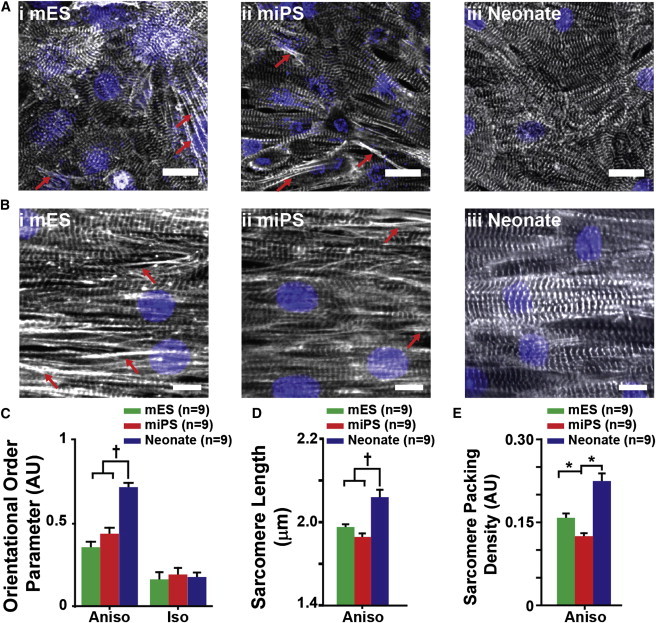
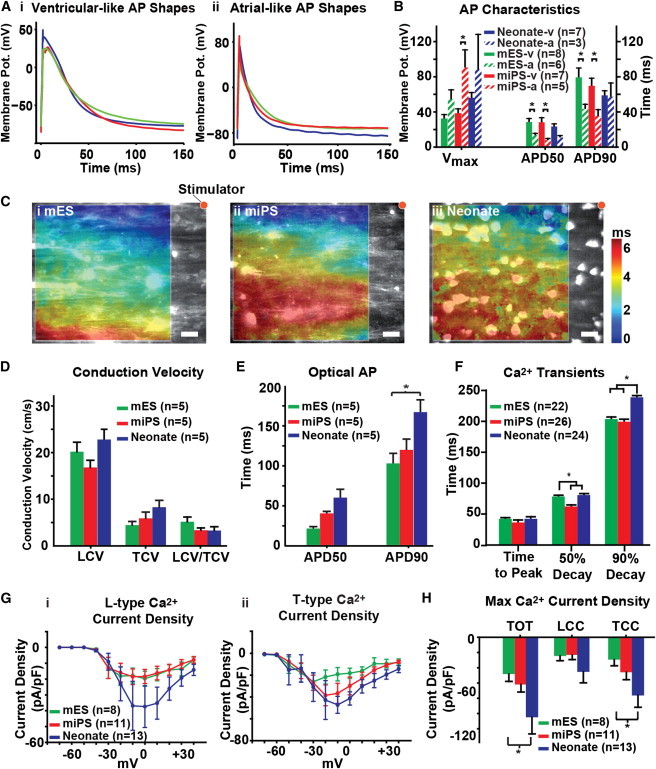
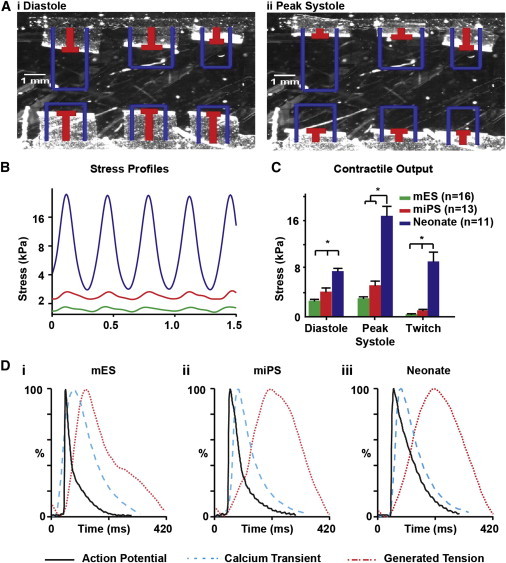
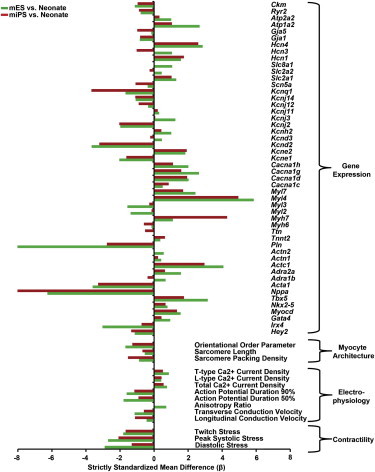
Advances in stem cell manufacturing methods have made it possible to produce stem cell-derived cardiac myocytes at industrial scales for in vitro muscle physiology research purposes. Although FDA-mandated quality assurance metrics address safety issues in the manufacture of stem cell-based products, no standardized guidelines currently exist for the evaluation of stem cell-derived myocyte functionality. As a result, it is unclear whether the various stem cell-derived myocyte cell lines on the market perform similarly, or whether any of them accurately recapitulate the characteristics of native cardiac myocytes. We propose a multiparametric quality assessment rubric in which genetic, structural, electrophysiological, and contractile measurements are coupled with comparison against values for these measurements that are representative of the ventricular myocyte phenotype. We demonstrated this procedure using commercially available, mass-produced murine embryonic stem cell- and induced pluripotent stem cell-derived myocytes compared with a neonatal mouse ventricular myocyte target phenotype in coupled in vitro assays.


Figures

Figure 1
Figure 1
Comparison of mESC, miPSC, and Neonate Gene-Expression Profiles on Isotropic and Anisotropic ECM Substrates (A) Culturing (i) mESC, (ii) miPSC, and (iii) neonate myocytes on substrates with a uniform coating of FN resulted in isotropic cellular arrangement. (B) Volcano plots showing the negative log of p values (two-tailed t test, n = 3 for all conditions) versus log fold-change values for comparison of qPCR measurements of cardiac genes (i) between mESC and neonate isotropic monolayers, and (ii) between miPSC and neonate isotropic monolayers reveal significant differences for a number of genes (points on the plot colored green or red represent genes with p < 0.05). (C) Culturing (i) mESC, (ii) miPSC, and (iii) neonate myocytes on substrates with microcontact-printed lines of FN that were 20 μm wide and spaced 4 μm apart resulted in anisotropic cellular arrangement in all three cell types. (D) Volcano plots showing the negative log of p values (two-tailed t test, n = 3 for all conditions) versus log fold-change values for comparison of qPCR measurements of cardiac genes (i) between mESC and neonate anisotropic monolayers, and (ii) between miPSC and neonate anisotropic monolayers reveal slightly fewer genes demonstrating significant differences than in the isotropic cultures (points on the plot colored green or red represent genes with p < 0.05). (E) Hierarchical clustering of mean 2-ΔCt values for a select panel of cardiac genes reveals that the isotropic and anisotropic neonate tissue expression profiles cluster together in the center columns of the heatmap, whereas the anisotropic mESC and miPSC expression profiles form a separate cluster on the right sides of the heatmap, and the isotropic mESC and miPSC profiles cluster together on the left side of the heatmap. Scale bars, 100 μm. See also Figure S1 and Table S1.
Figure 2
Figure 2
Comparison of Myofibril Architecture in mESC, miPSC, and Neonate Engineered Tissues (A and B) Immunofluorescence visualization of sarcomeric α-actinin in (A) isotropic monolayers of (i) mESC, (ii) miPSC, and (iii) neonate myocytes, and (B) anisotropic monolayers of (i) mESC, (ii) miPSC, and (iii) neonate myocytes reveals the pattern of sarcomere organization adopted by each cell type in response to geometric cues encoded in the ECM. Immature premyofibrils (red arrows) were observed exclusively in mESC and miPSC engineered tissues. Quantitative evaluation of sarcomeric α-actinin immunofluorescence micrographs allowed statistical comparison of sarcomere organization and architecture. (C) The OOP was used as a metric of global sarcomere alignment within the engineered tissues and showed that anisotropic neonate tissues exhibited significantly greater overall sarcomere alignment than the mESC and miPSC anisotropic tissues. No significant differences in global sarcomere alignment were observed among the isotropic mESC, miPSC, and neonate tissues. (D) Comparison of z-line spacing revealed that the neonate anisotropic tissues exhibited significantly greater sarcomere length than both the mESC and miPSC anisotropic tissues. (E) From the measurements of sarcomere length, the sarcomere packing density was calculated for anisotropic tissues of each cell type. All three cell types exhibited significantly different sarcomere packing densities. The statistical tests used were ANOVA (p < 0.05) and ANOVA on ranks (p < 0.05). Data are presented as mean ± SEM. Scale bars, 10 μm. See also Figure S2.
Figure 3
Figure 3
Comparison of Electrical Activity in mESC, miPSC, and Neonate Engineered Tissues (A) Patch-clamp recordings from isolated mESC, miPSC, and neonate myocytes exhibited APs with both (i) ventricular-like and (ii) atrial-like profiles. (B) Characterization of the AP traces revealed no significant differences between the three cell types, but the mESC and miPSC myocytes exhibited an equal proportion of ventricular-like (mESC-v, miPSC-v) and atrial-like (mESC-a, miPSC-a) AP traces, whereas the neonates exhibited primarily ventricular-like (neonate-v) AP profiles. (C) The electrophysiological characteristics of anisotropic (i) mESC, (ii) miPSC, and (iii) neonate tissues were assessed using optical mapping and the photovoltaic dye RH237. (D) Comparison of conduction properties between the mESC, miPSC, and neonate tissues revealed no significant differences in either LCV or TCV. (E) Evaluation of optical AP duration in anisotropic tissues revealed no significant differences in APD50, but a significant difference in APD90 between the mESC and neonate tissues was observed. (F) Comparison of Ca2+ transients measured in anisotropic tissues revealed that the 50% decay time of the miPSC tissues was significantly lower than that of both the mESC and neonate tissues, but the 90% decay time of both the mESC and miPSC tissues was significantly lower than that of the neonate tissues. (G) Patch-clamp recordings were collected on isolated mESC, miPSC, and neonate myocytes to measure and compare (i) LCC and (ii) TCC elicited at various holding potentials. (H) Patch-clamp recordings of maximum Ca2+ current density in isolated mESC, miPSC, and neonate myocytes revealed a significant difference in TOT between the neonate and mESC myocytes. No significant differences in LCC were observed, but a significant difference in TCC was observed between the neonate and mESC myocytes. The statistical test used was ANOVA (p < 0.05). Data are presented as mean ± SEM. Scale bars, 20 μm. See also Figure S3.
Figure 4
Figure 4
Comparison of Contractile Performance in mESC, miPSC, and Neonate Engineered Tissues (A) The contractile performance of anisotropic mESC, miPSC, and neonate tissues was assessed using the MTF assay, and the radius of curvature of the MTFs at (i) diastole and (ii) peak systole were used to calculate contractile stress. (B) The radius of curvature of the MTFs was used to calculate and compare the temporal contractile strength profiles of anisotropic mESC (green), miPSC (red), and neonate (blue) tissues. (C) Comparison of MTF contractile output revealed that neonate anisotropic tissues generated significantly greater diastolic, peak systolic, and twitch stress than both the mESC and miPSC tissues. (D) Graphical representation of AP morphology (black solid line), Ca2+ transient morphology (blue dotted line), and contractility profile (red dotted line) during a typical excitation-contraction cycle of the mESC, miPSC, and neonate engineered anisotropic tissues. The statistical test used was ANOVA (p < 0.05). Data are presented as mean ± SEM. See also Movies S1, S2, and S3.
Figure 5
Figure 5
Integrated Visual Comparison of mESC, miPSC, and Neonate Experimental Measurements SSMD (β) values were computed for mESC- and miPSC-derived myocytes relative to the neonate cardiac myocytes from the mean and sample SDs collected for each experimental measurement. These β values were organized by measurement type (i.e., gene expression, myocyte architecture, electrophysiology, and contractility) and plotted to allow comparison. Negative β values indicate measurements with higher relative magnitude in the neonate cardiac myocytes, whereas positive β values indicate measurements that were higher in the mES/miPSC myocytes relative to the neonate cardiac myocytes. See also Table S2.

References

    1. Abramoff M.D., Magalhaes P.J., Ram S.J. Image processing with ImageJ. Biophotonics Int. 2004;11:36–42.
    1. Alford P.W., Feinberg A.W., Sheehy S.P., Parker K.K. Biohybrid thin films for measuring contractility in engineered cardiovascular muscle. Biomaterials. 2010;31:3613–3621. - PMC - PubMed
    1. Bers D.M. Cardiac excitation-contraction coupling. Nature. 2002;415:198–205. - PubMed
    1. Birmingham A., Selfors L.M., Forster T., Wrobel D., Kennedy C.J., Shanks E., Santoyo-Lopez J., Dunican D.J., Long A., Kelleher D. Statistical methods for analysis of high-throughput RNA interference screens. Nat. Methods. 2009;6:569–575. - PMC - PubMed
    1. Brower V. Human ES cells: can you build a business around them? Nat. Biotechnol. 1999;17:139–142. - PubMed

Publication types

MeSH terms