. 2014 Mar 6;2(3):337-50.
doi: 10.1016/j.stemcr.2014.01.013. eCollection 2014 Mar 11.

Isolation of human induced pluripotent stem cell-derived dopaminergic progenitors by cell sorting for successful transplantation

Affiliations

Isolation of human induced pluripotent stem cell-derived dopaminergic progenitors by cell sorting for successful transplantation

Daisuke Doi et al. Stem Cell Reports. .

Abstract

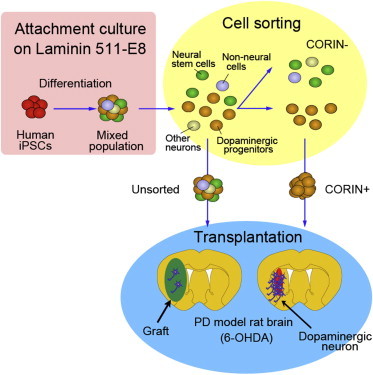
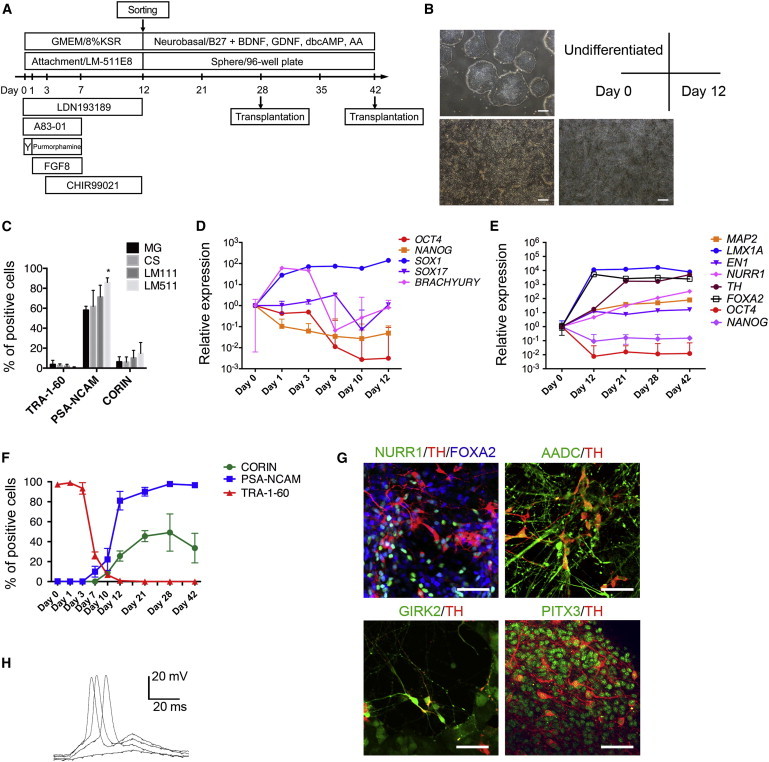
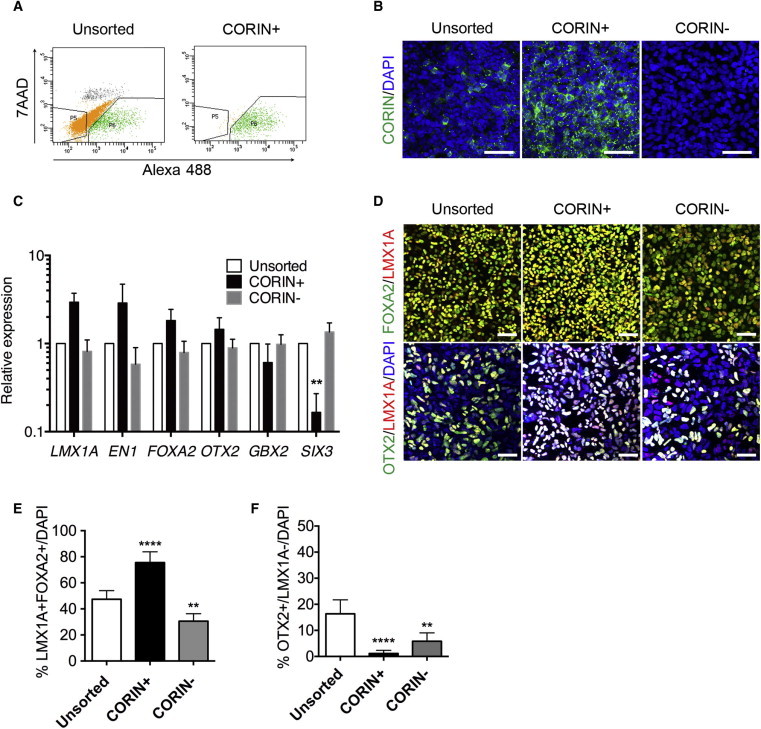
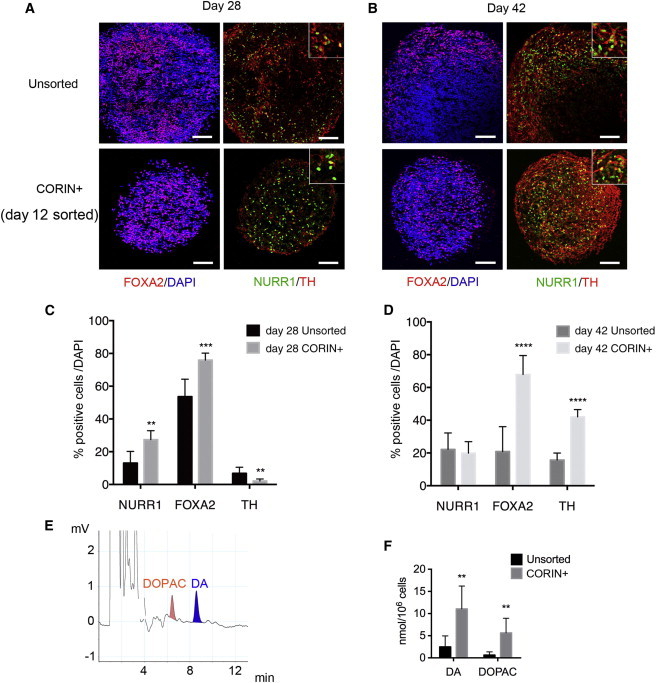
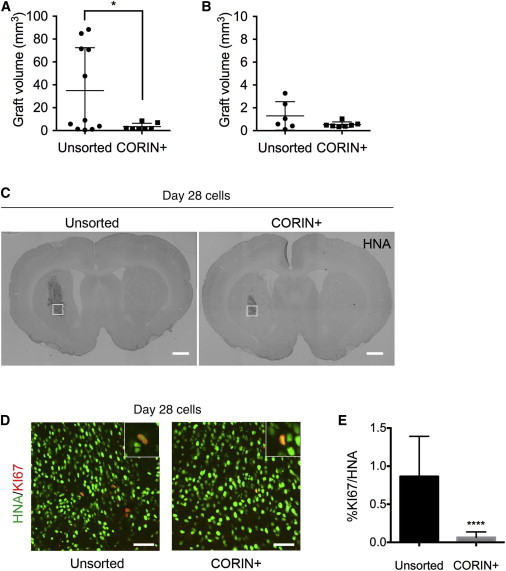
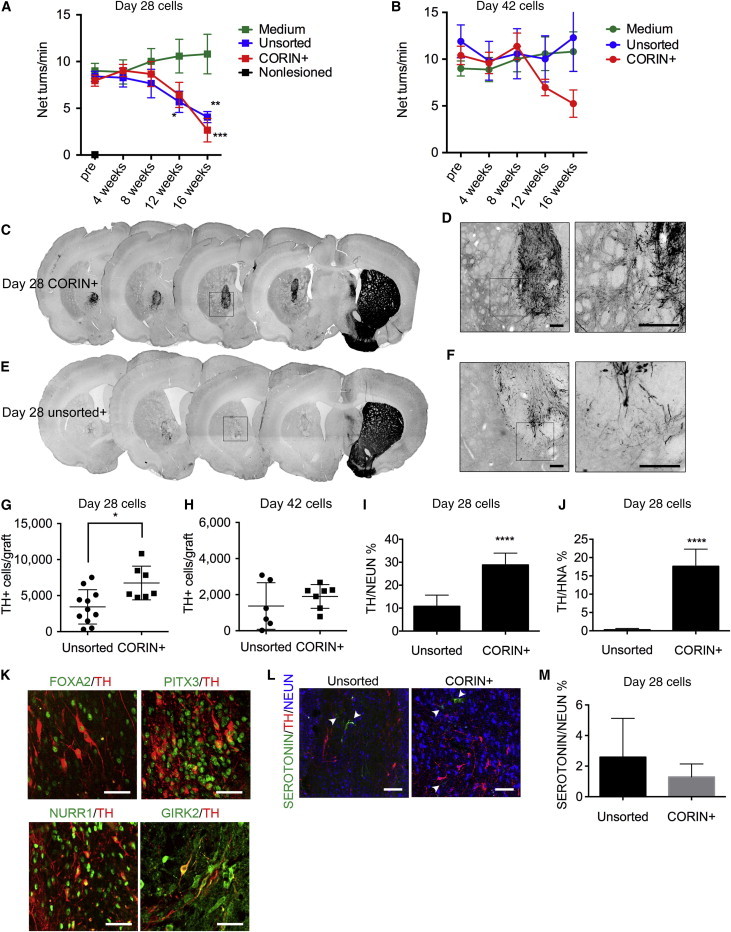
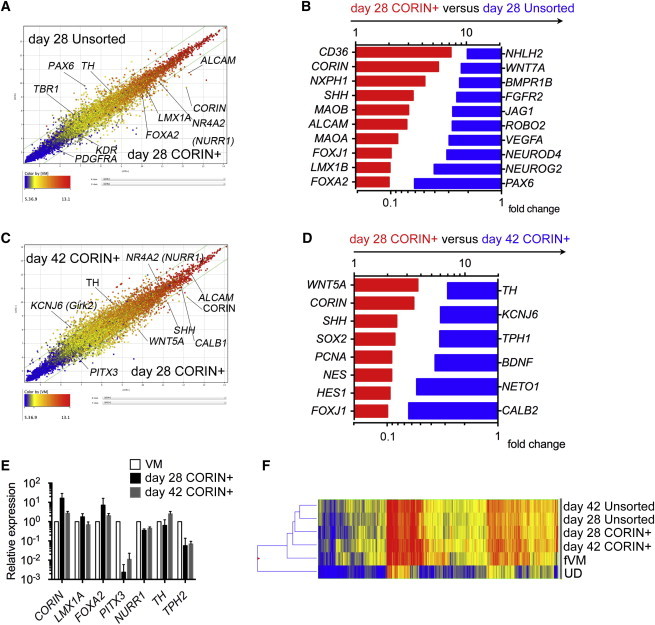
Human induced pluripotent stem cells (iPSCs) can provide a promising source of midbrain dopaminergic (DA) neurons for cell replacement therapy for Parkinson's disease. However, iPSC-derived donor cells inevitably contain tumorigenic or inappropriate cells. Here, we show that human iPSC-derived DA progenitor cells can be efficiently isolated by cell sorting using a floor plate marker, CORIN. We induced DA neurons using scalable culture conditions on human laminin fragment, and the sorted CORIN(+) cells expressed the midbrain DA progenitor markers, FOXA2 and LMX1A. When transplanted into 6-OHDA-lesioned rats, the CORIN(+) cells survived and differentiated into midbrain DA neurons in vivo, resulting in significant improvement of the motor behavior, without tumor formation. In particular, the CORIN(+) cells in a NURR1(+) cell-dominant stage exhibited the best survival and function as DA neurons. Our method is a favorable strategy in terms of scalability, safety, and efficiency and may be advantageous for clinical application.


Figures

None
Graphical abstract
Figure 1
Figure 1
Differentiation of Human iPSCs by Attachment Culture on LM511-E8 (A) An overview of the culture protocol. (B) Phase-contrast images of the undifferentiated iPSCs on LM511-E8 on differentiation culture day 0 and day 12. Scale bars, 200 μm. (C) The results of the flow cytometric analysis of differentiating cells on MG, CS, Laminin 111-E8 fragment (LM111), and Laminin 511-E8 fragment (LM511) on day 12. The values are the mean ± SD. p = 0.0459 by a one-way ANOVA with Tukey’s multiple comparison test (n = 3 independent experiments). (D and E) The results of the gene expression analysis by quantitative RT-PCR. The expression level of the undifferentiated cells (day 0) was set to 1. The values are the mean ± SD (n = 3 independent experiments). (F) The results of the temporal expression analysis by flow cytometry. The values are the mean ± SD (n = 4 independent experiments). (G) Immunofluorescence images of the differentiated cells on poly-L-O/F/L-coated dishes on day 42. Scale bars, 50 μm. (H) Current clamp recordings of induced action potentials by brief current pulses from an iPSC-derived neuron on day 42. See also Figure S1 and Tables S5 and S6.
Figure 2
Figure 2
Purification and Characterization of iPSC-Derived CORIN+ Cells on Day 12 (A) Dot plots of the FACS analysis of the unsorted and the reanalyzed sorted cells. The x-y grid indicates the intensity of 7-AAD and Alexa 488 staining, respectively. (B) Immunostaining for CORIN (green) and DAPI (blue). Scale bars, 50 μm. (C) The results of the gene expression analysis by quantitative RT-PCR. The expression level of the unsorted cells was set to 1. The values are the mean ± SD. ∗∗p = 0.0080 by a one-way ANOVA with Dunnett’s multiple comparison test (n = 3 independent experiments). (D) Immunostaining for FOXA2/LMX1A and OTX2/LMX1A. Scale bars, 100 μm. (E and F) The percentages of LMX1A+/FOXA2+ cells (E) and OTX2+/LMX1A cells (F) per the total number of cells. The values are the mean ± SD. ∗∗p = 0.0046 (E), ∗∗p = 0.0013 (F), and ∗∗∗∗p < 0.0001 by a one-way ANOVA with Dunnett’s multiple comparison test (n = 5 different experiments). See also Figures S1 and S2 and Tables S5 and S6.
Figure 3
Figure 3
DA Differentiation of the Unsorted and the Day 12 CORIN+ Cells (A and B) Double-labeled immunostaining of the spheres on day 28 and day 42. FOXA2/DAPI (left) and NURR1/TH (right). Insets indicate magnified images of double-positive cells. Scale bars, 100 μm. (C and D) The percentages of NURR1+, FOXA2+, and TH+ cells per total cells on day 28 (C) or day 42 (D). The values are the mean ± SD. (C) ∗∗p = 0.0011 for NURR1, ∗∗∗p = 0.0002 for FOXA2, and ∗∗p = 0.0058 for TH, and (D) ∗∗∗∗p < 0.0001 for FOXA2 and TH by the unpaired t test (n = 6 independent experiments). (E and F) The results of the HPLC analysis of the dopamine and DOPAC releases by the day 56 cultured cells under high potassium stimulation. The values are the mean ± SD. ∗∗p = 0.0043 for DA and ∗∗p = 0.0045 for DOPAC by an unpaired t test (n = 3 independent experiments). See also Figure S3 and Table S6.
Figure 4
Figure 4
The Proliferation of the Unsorted or the Day 12 CORIN+ Cells In Vivo (A and B) The graft volumes at 16 weeks. The day 12 CORIN+ cells were grafted on day 28 (n = 11 for unsorted, n = 7 for CORIN+) (A) or day 42 (n = 6 for unsorted, n = 7 for CORIN+) (B). Values are the mean ± SD. p = 0.0435 by the unpaired t test. (C) Immunohistochemistry for the human nuclear antigen (HNA). Scale bars, 1 mm. (D) Immunofluorescence images of the squares in (C) for HNA (green) and KI67 (red). Scale bars, 50 μm. Insets show magnified images of KI67+ cells. (E) The percentages of proliferating (KI67+) cells per donor cells (HNA+). ∗∗∗∗p < 0.0001 by the unpaired t test. The values are the mean ± SD (n = 5 animals). See also Table S6.
Figure 5
Figure 5
The Survival and Function of DA Neurons Derived from the Unsorted or the Day 12 CORIN+ Cells In Vivo, which Were Grafted on Day 28 or Day 42 (A and B) The methamphetamine-induced rotation of the rats with the grafts. The values are the mean ± SEM. p = 0.0482 (12 weeks), ∗∗p = 0.0017 (unsorted, 16 weeks), and ∗∗∗p = 0.0003 (CORIN+, 16 weeks) by a two-way ANOVA with Dunnett’s multiple comparisons test: n = 6, medium injection and nonlesioned; n = 11, day 28 unsorted; n = 6, day 42-unsorted; and n = 7, day 28- and day 42 CORIN+, respectively. (C–F) DAB staining of the representative grafts derived from day 28 CORIN+ or day 28-unsorted cells stained for TH. (C and E) The low-power images of consecutive sections throughout the striatum are shown. (D and F) The magnified images of flames in (C) and (E) are shown. The right panels are the magnified images of the flames in the left panels. Scale bars, 200 μm. (G and H) The number of TH+ cells in each graft. The values are the mean ± SD. p = 0.0106 by the unpaired t test. (I and J) The rates of TH+ cells per neuronal cells (NEUN+) (I) and TH+ cells per surviving donor cells (HNA+) (J). ∗∗∗∗p < 0.0001 by the unpaired t test. The values are the mean ± SD. (K) Immunostaining of the grafts derived from day 12 CORIN+ cells for FOXA2/TH, PITX3/TH, NURR1/TH, and GIRK2/TH. Scale bars, 50 μm. (L) Immunofluorescent images for SEROTONIN(green)/TH(red)/NEUN(blue). Arrowheads indicate SEROTONIN+ cells. Scale bars, 100 μm. (M) The percentages of the SEROTONIN+ cells per surviving neurons (NEUN+). The values are the mean ± SD. There were no significant differences. See also Figure S4 and Table S6.
Figure 6
Figure 6
The Results of the Gene Expression Analysis of the iPSC-Derived Cells and Human Fetal Cells (A–D) The results of the microarray analysis comparing the unsorted versus CORIN+ cells on day 28 (A and B) and the CORIN+ cells on day 28 versus on day 42 (C and D). (A and C) Scatterplots. (B and D) Selected genes of differentially expressed transcripts comparing (B) day 28 CORIN+ versus day 28 unsorted cells and (D) day 28 CORIN+ versus day 42 CORIN+ cells are shown. (E) The results of the quantitative RT-PCR analysis in the CORIN+ cells and human fetal VM tissue. The expression of the VM tissue was set to 1. The values are the mean ± SD (n = 3 independent experiments). (F) The hierarchical clustering of the global gene expression data obtained from the iPSC-derived cells and human fetal VM tissue. See also Figure S5 and Tables S2 and S3–S5.

References

    1. Ausubel L.J., Lopez P.M., Couture L.A. GMP scale-up and banking of pluripotent stem cells for cellular therapy applications. Methods Mol. Biol. 2011;767:147–159. - PubMed
    1. Bergström R., Ström S., Holm F., Feki A., Hovatta O. Xeno-free culture of human pluripotent stem cells. Methods Mol. Biol. 2011;767:125–136. - PubMed
    1. Brederlau A., Correia A.S., Anisimov S.V., Elmi M., Paul G., Roybon L., Morizane A., Bergquist F., Riebe I., Nannmark U. Transplantation of human embryonic stem cell-derived cells to a rat model of Parkinson’s disease: effect of in vitro differentiation on graft survival and teratoma formation. Stem Cells. 2006;24:1433–1440. - PubMed
    1. Brundin P., Barbin G., Strecker R.E., Isacson O., Prochiantz A., Björklund A. Survival and function of dissociated rat dopamine neurones grafted at different developmental stages or after being cultured in vitro. Brain Res. 1988;467:233–243. - PubMed
    1. Brundin P., Pogarell O., Hagell P., Piccini P., Widner H., Schrag A., Kupsch A., Crabb L., Odin P., Gustavii B. Bilateral caudate and putamen grafts of embryonic mesencephalic tissue treated with lazaroids in Parkinson’s disease. Brain. 2000;123:1380–1390. - PubMed

Publication types

MeSH terms