. 2014 Mar 6;2(3):366-81.
doi: 10.1016/j.stemcr.2014.01.014. eCollection 2014 Mar 11.

Platform for induction and maintenance of transgene-free hiPSCs resembling ground state pluripotent stem cells

Affiliations

Platform for induction and maintenance of transgene-free hiPSCs resembling ground state pluripotent stem cells

Bahram Valamehr et al. Stem Cell Reports. .

Abstract

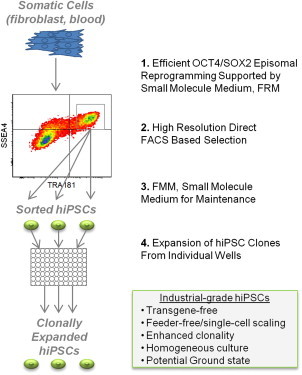
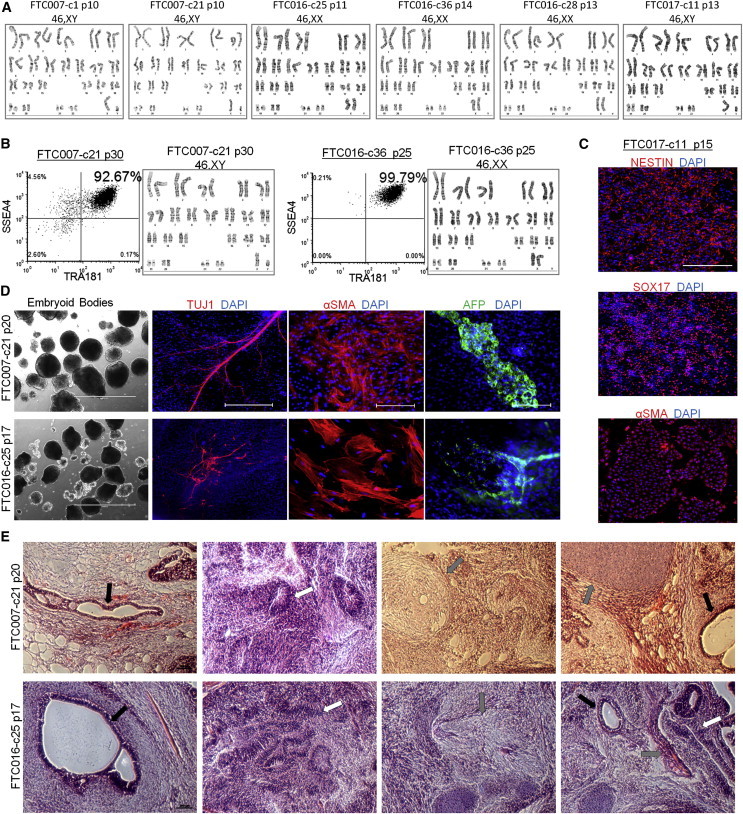
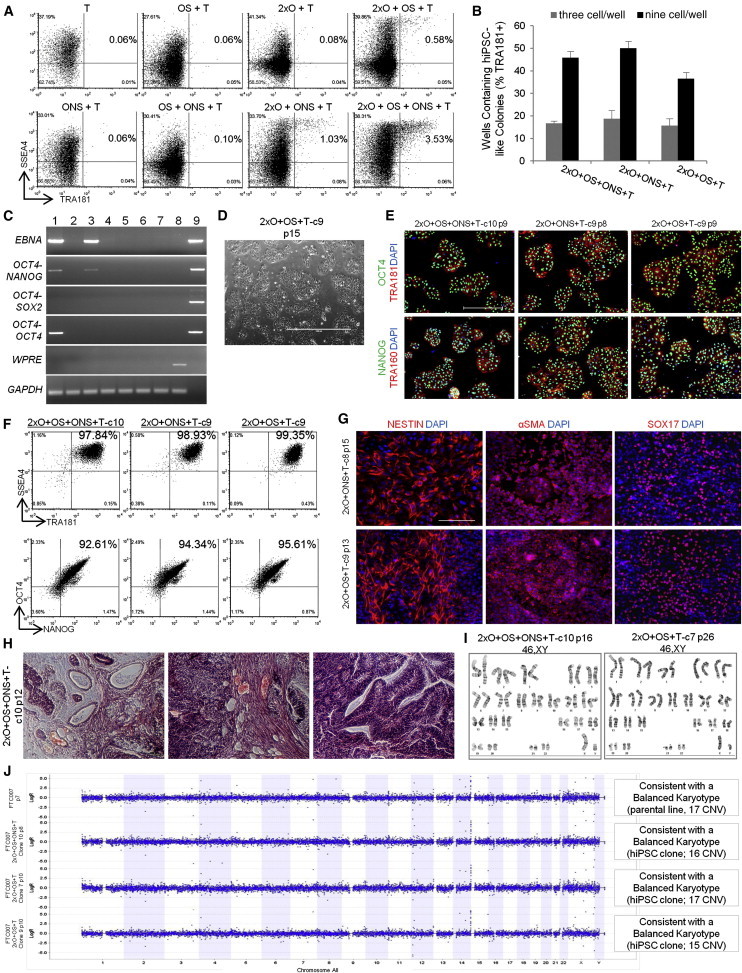
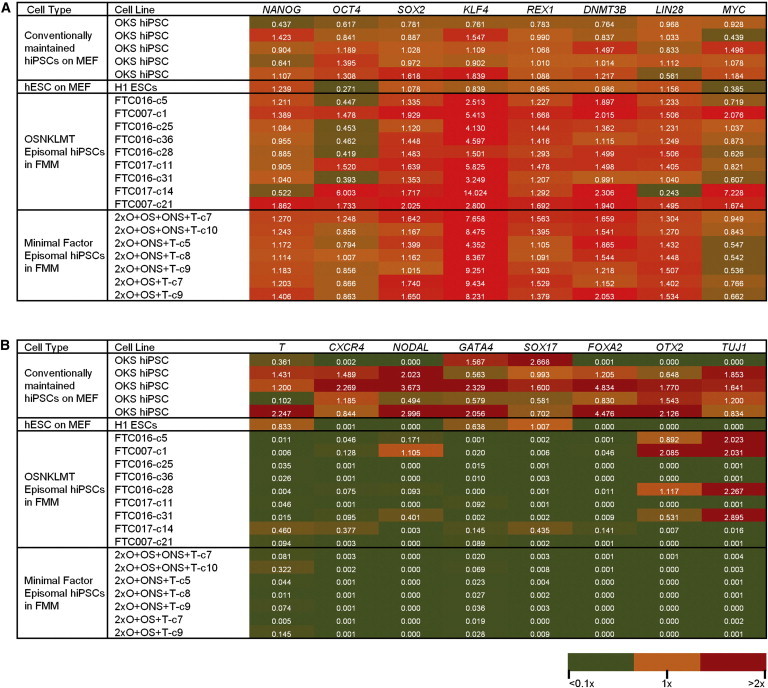
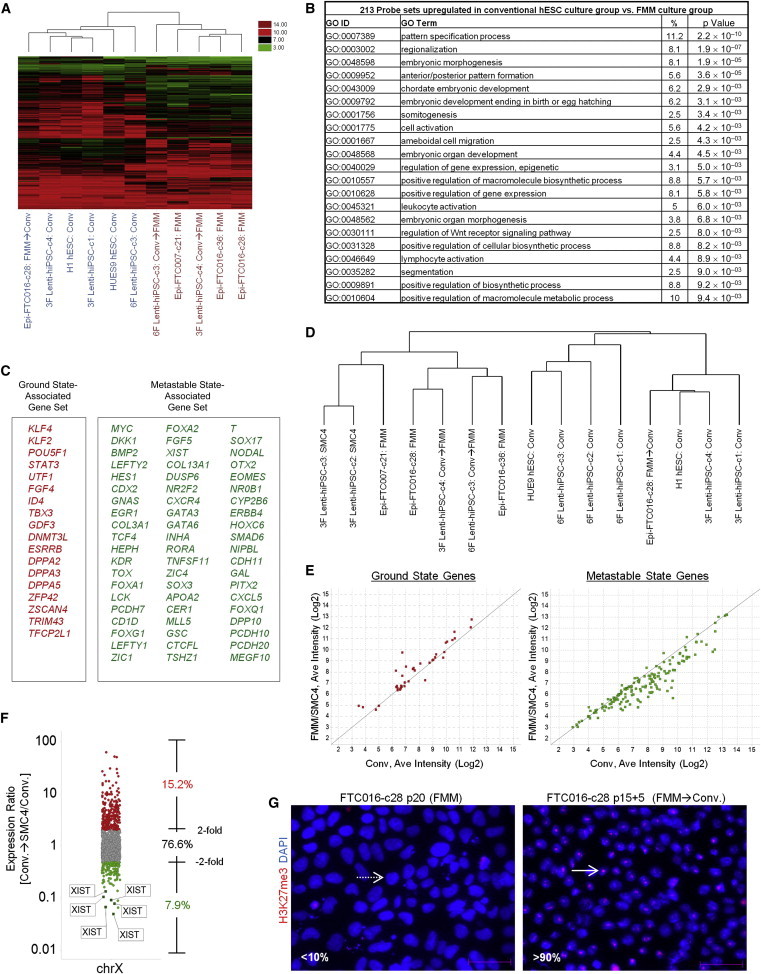
Cell banking, disease modeling, and cell therapy applications have placed increasing demands on hiPSC technology. Specifically, the high-throughput derivation of footprint-free hiPSCs and their expansion in systems that allow scaled production remains technically challenging. Here, we describe a platform for the rapid, parallel generation, selection, and expansion of hiPSCs using small molecule pathway inhibitors in stage-specific media compositions. The platform supported efficient and expedited episomal reprogramming using just OCT4/SOX2/SV40LT combination (0.5%-4.0%, between days 12 and 16) in a completely feeder-free environment. The resulting hiPSCs are transgene-free, readily cultured, and expanded as single cells while maintaining a homogeneous and genomically stable pluripotent population. hiPSCs generated or maintained in the media compositions described exhibit properties associated with the ground state of pluripotency. The simplicity and robustness of the system allow for the high-throughput generation and rapid expansion of a uniform hiPSC product that is applicable to industrial and clinical-grade use.


Figures

None
Graphical abstract
Figure 1
Figure 1
Multistage Medium Platform for Enhanced Reprogramming and hiPSC Maintenance (A) Lentiviral-generated hiPSC clones FTi088 and FTi096 cultured in SMC4. The spontaneous differentiation of clone FTi096 is minimized when transitioned to FMM for three passages shown by morphology (upper panels) and flow cytometry profile (lower panels). Scale bars, 1,000 μm. (B) Quantitative real-time PCR for transgene expression of viral element WPRE. Expression was normalized to GAPDH and relative to WPRE expression of parental fibroblast line 4 days post-lentiviral infection (Day 4 P.I.). Three independent experiments were performed with an SEM. (C) SSEA4 and TRA181 status of transgene-silenced lenti-induced hiPSCs in various components: removal of SB431542 (−TGF-βi), 100 ng/ml bFGF (+100 bFGF), and 10 ng/ml LIF (+10 LIF). Three independent experiments were performed with an SEM. (D) Fibroblast line was transfected with lentiviral construct containing gene set OKS, cultured, and sorted as indicated. Sort gate is highlighted in blue. At day 27, the cultures were resorted, seeded at normalized density, and maintained in respective media for an additional 9 days. Panels on the right are representative colonies. Scale bars, 500 μm. (E) Colony counts of day 36 staining as discussed in (D): p < 0.0005 between SMC4 versus SMC4 to FMM OCT4/NANOG colony number. Two independent experiments were performed for conventional (Conv.) and FMM, and three independent experiments were conducted for SMC4 to FMM and SMC4, with an SEM. See also Table S1.
Figure 2
Figure 2
Individual Episomal-Reprogrammed hiPSCs Are Efficiently Selected and Seeded in 96-Well Plates for Clonal Expansion (A) Schematic timing illustration of episomal induction, multistage media system, flow cytometry sorting, and clonal expansion. (B) Flow cytometry profile of episomal-induced reprogramming maintained in FRM-to-FMM transition in FF culture (outlined in A) at indicated days post-transfection. Sort-gating strategy used for each parental line (SSEA4+/TRA181+/CD30+ population) is illustrated in respective colors, corresponding to the bottom histogram panel representing the percentage of wells of 96-well plate containing individual hiPSC clones. Wells containing multiple clones or differentiated clones were not scored. Three independent experiments were performed with an SEM. The solid line represents the average percentage among all derivations with dotted lines representing SD, 22.3 ± 5.5. (C) Flow profile of FTC007 induced to reprogram 19 days posttransfection maintained in conventional medium in the presence of MEF cells. The induced population is taken from the same population of FTC007 in (B), however, treated in different culture thereafter. (D) Immunocytochemistry analysis of various pluripotency markers of sorted colonies in 96-well plate. Right corner panels represent DAPI staining. Scale bar, 500 μm. (E) Quantitative real-time PCR for NANOG expression for each well of a SSEA4/TRA181/CD30 direct sorted (FACS) 96-well plate at three cells per well. The expression range is between zero and four times expression relative to H1 human ESCs as described in the legend located on the right side and normalized to GAPDH. See also Figures S1, S2, and S3.
Figure 3
Figure 3
Episomal-Reprogrammed hiPSC Clones Maintain Their Undifferentiated State and Are Free of Transgene Sequence (A) Representative images of hiPSC clone during culture. Scale bars, 1,000 μm. (B) PCR analysis for episomal DNA derived from various hiPSC clones. Lane 1 shows FTC007-c1 p4, lane 2 shows FTC007-c21 p4, lane 3 shows FTC016-c25 p5, lane 4 shows FTC016-c36 p5, lane 5 shows FTC017-c11 p7, lane 6 shows FTC017-c14 p7, lane 7 shows FTC017-c17 p6 (a line maintaining episomal constructs used a positive control), lane 8 shows untransfected FTC007, lane 9 shows hiPSC generated using lentiviral constructs, and lane 10 shows episomal vector used as positive control. Input of 100 ng genomic DNA and 35 PCR cycles were used for all sets. (C) Quantitative real-time PCR analysis for endogenous pluripotent gene expression. Data were normalized to GAPDH and relative to HUES9 hESCs. Four independent experiments were performed, with an SEM. (D) Pluripotency markers detected by immunofluorescence. Scale bar, 200 μm. (E) Flow cytometry profile for selected hiPSC clones from various parental lines. See also Figure S3.
Figure 4
Figure 4
Genomic Stability and Pluripotency Are Maintained during Continuous Single-Cell and FF Culture (A) Cytogenetic analysis on 20–40 G-banded metaphase cells from various hiPSC clones maintained in FF and single-cell culture. (B) Flow cytometry profile and cytogenetic analysis of long-term-passaged hiPSC clones in FF and single-cell enzymatic-passaged culture. (C) Three to 4-day-directed differentiation of FTC017-c11. Scale bar, 200 μm. (D) Embryoid body formation and differentiation. Immunocytochemistry was conducted 28 days post-differentiation: ectoderm, Tuj1; mesoderm, α smooth muscle actin (aSMA); and endoderm, AFP. Scale bars, 1,000 μm (bright-field images), 200 μm (TUJ1 images), and 500 μm (SMA and AFP images). (E) Histological sections of teratoma derived from FTC007-c21 and FTC016-c25. Black arrows point to endoderm, white arrows point to ectoderm, and gray arrows point to mesoderm. Scale bar, 200 μm.
Figure 5
Figure 5
Derivation of hiPSC Clones with Minimal Number of Reprogramming Factors (A) Flow cytometry profile of reprogramming kinetics induced by various gene combinations at day 13 post-induction. (B) Histogram of hiPSC clones in wells of 96-well plate at three and nine cells per well. Three independent experiments were performed, with an SEM. (C) PCR analysis for episomal DNA derived from various hiPSC clones. Lane 1 shows 2xO+OS+ONS+T-c7 p6, lane 2 shows 2xO+OS+ONS+T-c10 p6, lane 3 shows 2xO+ONS+T-c5 p5, lane 4 shows 2xO+ONS+T-c9 p5, lane 5 shows 2xO+OS+T-c7 p6, lane 6 shows 2xO+OS+T-c9 p6, lane 7 shows untransfected FTC007, lane 8 shows hiPSC generated using lentiviral constructs, and lane 9 shows episomal vector used as positive control. Input of 100 ng genomic DNA and 35 PCR cycles were used for all sets. (D) Typical morphology. Scale bar, 1,000 μm. (E) Pluripotency markers detected by immunofluorescence. Scale bar, 1,000 μm. (F) Flow profile of hiPSC clones. (G) Directed differentiation of selected hiPSC clones 72–96 hr post-induction. Scale bar, 500 μm. (H) Histological sections of teratoma derived from hiPSC clone 2xO+OS+ONS+T-c10. Left panel shows endoderm, middle panel shows mesoderm, and right panel shows ectoderm. Scale bar, 200 μm. (I) Cytogenetic analysis of 20 G-banded metaphase cells from various hiPSC clones maintained in FF and single-cell culture. (J) Copy number variation as assessed by array-comparative genomic hybridization and SNP. Panel on the right represents interpretation summary of the data. CNV, copy number variation. See also Figure S4.
Figure 6
Figure 6
Relative Gene Expression Profile of Minimal Factor Episomal-Induced hiPSCs in FMM (A and B) Heatmap results derived from a Fluidigm dynamic array depicting relative gene expression levels of pluripotency (A) and differentiation (B) genes of conventionally maintained hiPSC lines, RNA from conventionally maintained H1 hESCs, and episomal hiPSC lines derived using various gene combinations maintained in FMM. Relative gene expression for each line is noted within each box and color coded based on three expression levels summarized in the legend (lower right). All sets were normalized to the average expression of two housekeeping genes (GAPDH and HPRT1) and referenced to the median expression level of six control conventional lines (OSK hiPSCs and H1 hESCs on MEF) representing 1× value for each gene. See also Figure S5.
Figure 7
Figure 7
FMM-Maintained hiPSCs Have Reduced Expression of Differentiated Genes and Increased Expression of Genes Associated with the Ground State (A) A total of 339 probe sets were differentially expressed between conventional and FMM culture by greater or less than 2.5-fold. Hierarchical clustering on the 339 probe sets using a complete linkage method based on Euclidean distance measurements was performed. Conventional culture is noted in blue, and FMM culture is noted in brown. (B) Gene ontology biological process enrichment analysis (D.A.V.I.D.) of the 213 probe sets upregulated 2.5-fold or greater with conventional culture (in comparison to FMM culture). (C) Gene lists representative of ground or metastable pluripotency states. List is derived from references noted in text. (D) Hierarchical clustering on the 227 probe sets corresponding to the genes in (C) using a complete linkage method based on Euclidean distance measurements. (E) RMA (log2)-normalized intensities for the probe sets corresponding to the genes in (C). Left panel represents 39 probe sets for ground state; right panel represents 188 probe sets for metastable state. Average conventional culture intensity levels are plotted on the x axis, whereas the average FMM/SMC4 intensity is on the y axis, and black line indicates equal expression. (F) Gene expression comparison of X chromosome-located genes between hiPSC clone derived and cultured in conventional medium culture and its counterpart adapted to SMC4 culture using all 1,688 Affymetrix probe sets mapped to the X chromosome. Probe sets associated with XIST gene expression are highlighted. (G) Representative images of HEK27me3 on hiPSC clone maintained in FMM or adapted to conventional culture for five passages. Dotted arrow in the left panel points to a representative nucleus absent of H3K27me3 staining, whereas solid arrow in the right panel points to a nucleus positive for H3K27me3 staining. Percentages of nucleus-positive staining are indicated in the lower-left side of each panel. Scale bar, 50 μm. See also Figures S5 and S6.

References

    1. Abujarour R., Valamehr B., Robinson M., Rezner B., Vranceanu F., Flynn P. Optimized surface markers for the prospective isolation of high-quality hiPSCs using flow cytometry selection. Sci. Rep. 2013;3:1179. - PMC - PubMed
    1. Beattie G.M., Lopez A.D., Bucay N., Hinton A., Firpo M.T., King C.C., Hayek A. Activin A maintains pluripotency of human embryonic stem cells in the absence of feeder layers. Stem Cells. 2005;23:489–495. - PubMed
    1. Chan Y.S., Göke J., Ng J.H., Lu X., Gonzales K.A., Tan C.P., Tng W.Q., Hong Z.Z., Lim Y.S., Ng H.H. Induction of a human pluripotent state with distinct regulatory circuitry that resembles preimplantation epiblast. Cell Stem Cell. 2013;13:663–675. - PubMed
    1. De Los Angeles A., Loh Y.H., Tesar P.J., Daley G.Q. Accessing naïve human pluripotency. Curr. Opin. Genet. Dev. 2012;22:272–282. - PMC - PubMed
    1. Fusaki N., Ban H., Nishiyama A., Saeki K., Hasegawa M. Efficient induction of transgene-free human pluripotent stem cells using a vector based on Sendai virus, an RNA virus that does not integrate into the host genome. Proc. Jpn. Acad., Ser. B, Phys. Biol. Sci. 2009;85:348–362. - PMC - PubMed

Publication types

MeSH terms

Substances