. 2014 Sep;143(1):81-95.
doi: 10.1111/imm.12296.

The fish oil ingredient, docosahexaenoic acid, activates cytosolic phospholipase A₂ via GPR120 receptor to produce prostaglandin E₂ and plays an anti-inflammatory role in macrophages

Affiliations

The fish oil ingredient, docosahexaenoic acid, activates cytosolic phospholipase A₂ via GPR120 receptor to produce prostaglandin E₂ and plays an anti-inflammatory role in macrophages

Yueqin Liu et al. Immunology. 2014 Sep.

Abstract

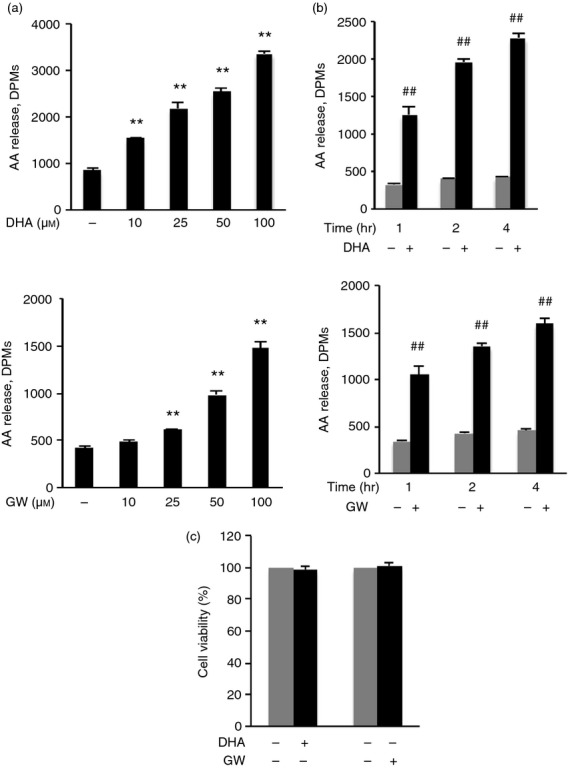
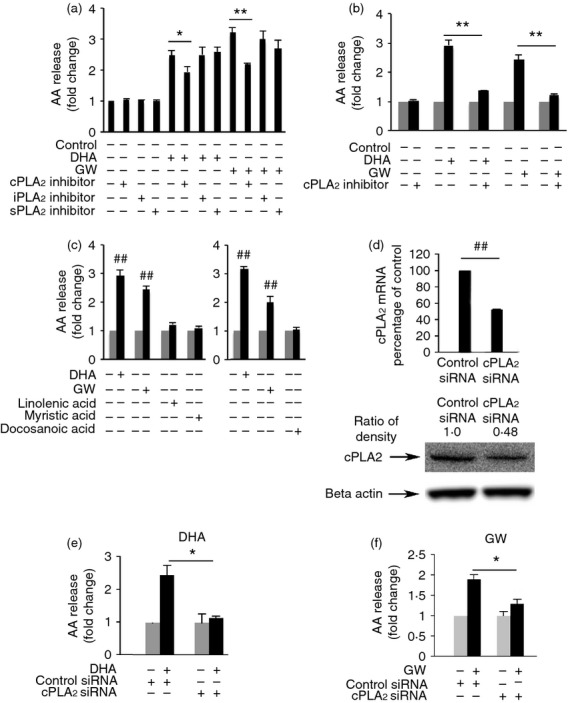
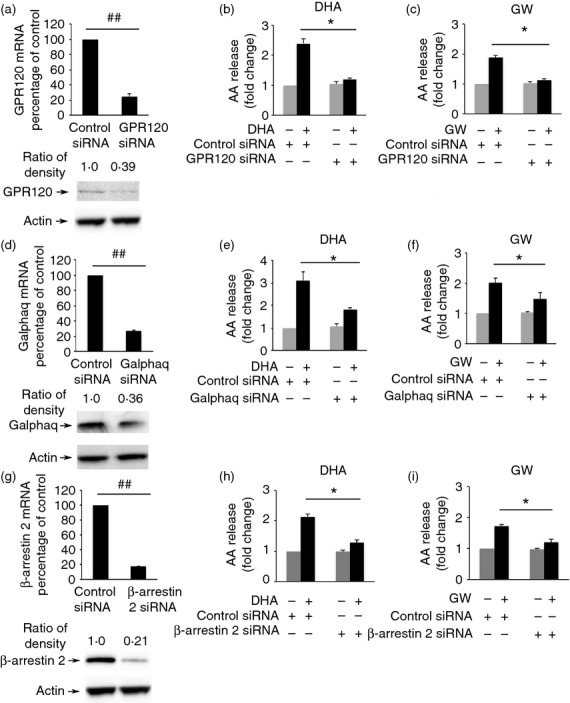
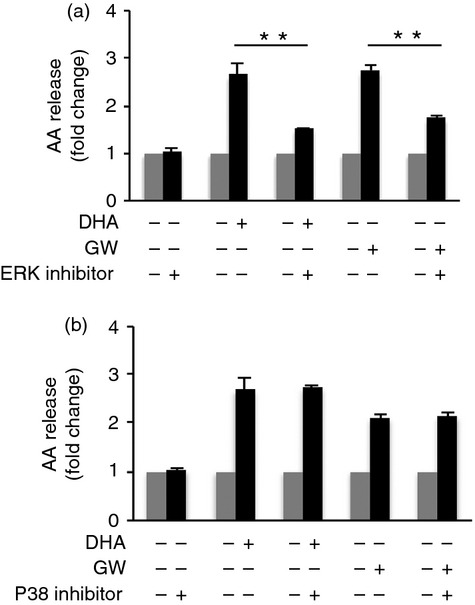
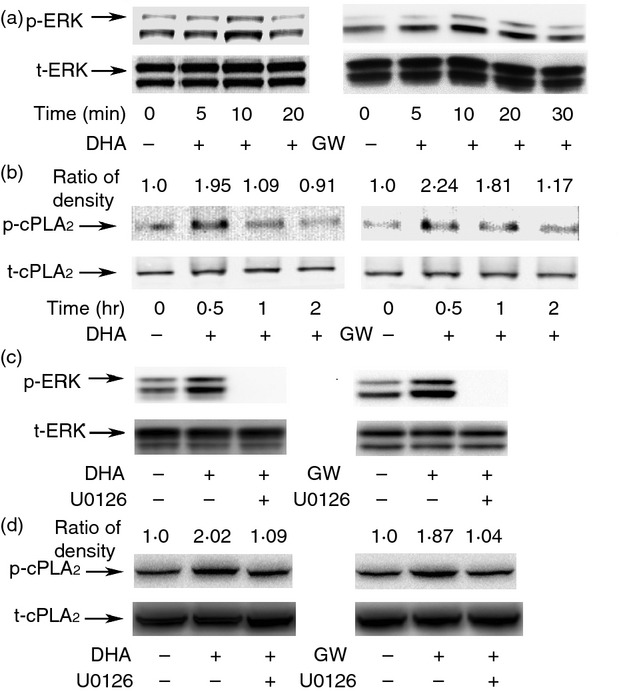
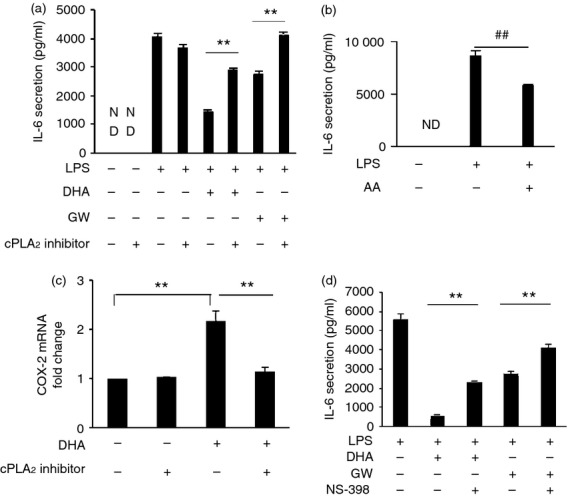
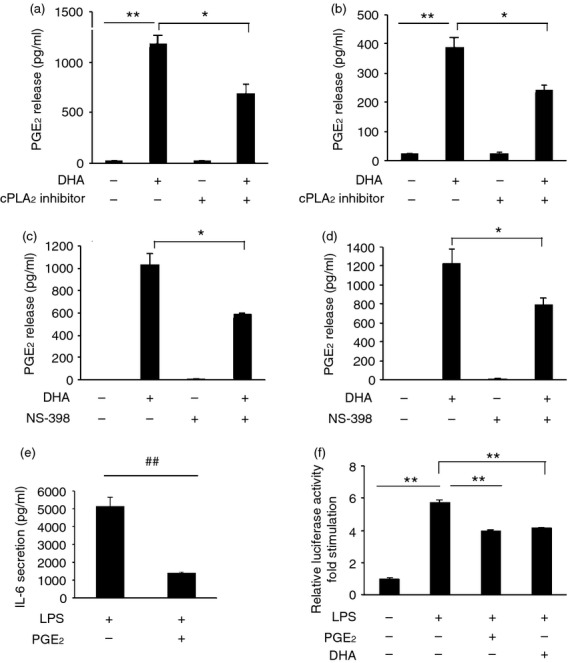
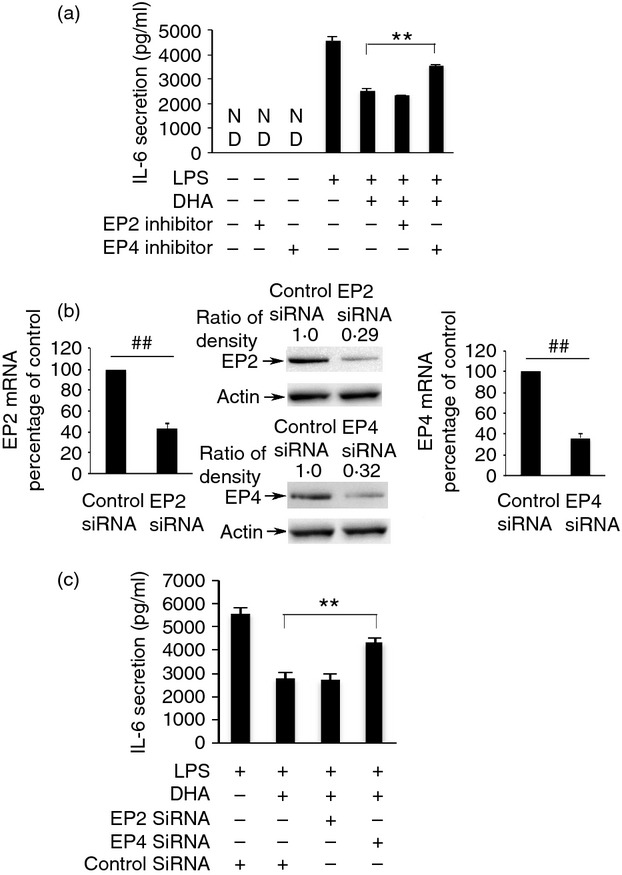
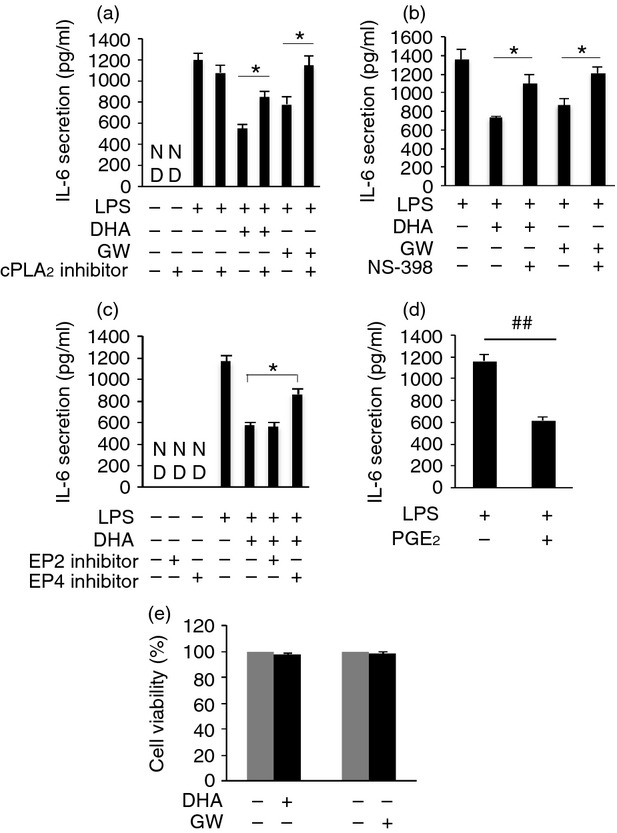
Docosahexaenoic acid (DHA) is one of the major ingredients of fish oil and has been reported to have anti-inflammatory properties mediated through the GPR120 receptor. Whether cytosolic phospholipase A2 (cPLA2 ) and lipid mediators produced from cPLA2 activation are involved in the anti-inflammatory role of DHA in macrophages has not been reported. We report here that DHA and the GPR120 agonist, GW9508, activate cPLA2 and cyclooxygenase 2 (COX-2), and cause prostaglandin E2 (PGE2) release in a murine macrophage cell line RAW264.7 and in human primary monocyte-derived macrophages. DHA and GW9508 activate cPLA2 via GPR120 receptor, G protein Gαq and scaffold protein β-arrestin 2. Extracellular signal-regulated kinase 1/2 activation is involved in DHA- and GW9508-induced cPLA2 activation, but not p38 mitogen-activated protein kinase. The anti-inflammatory role of DHA and GW9508 is in part via activation of cPLA2 , COX-2 and production of PGE2 as a cPLA2 inhibitor or a COX-2 inhibitor partially reverses the DHA- and GW9508-induced inhibition of lipopolysaccharide-induced interleukin-6 secretion. The cPLA2 product arachidonic acid and PGE2 also play an anti-inflammatory role. This effect of PGE2 is partially through inhibition of the nuclear factor-κB signalling pathway and through the EP4 receptor of PGE2 because an EP4 inhibitor or knock-down of EP4 partially reverses DHA inhibition of lipopolysaccharide-induced interleukin-6 secretion. Hence, DHA has an anti-inflammatory effect partially through induction of PGE2.

Keywords: cytokines; inflammation; lipid mediators; signal transduction.


Figures

Figure 1
Figure 1
Docosahexaenoic acid (DHA) and GW9508 induce arachidonic acid (AA) release in RAW264.7 cells. (a) The 3H-AA labelled cells were stimulated with indicated doses of DHA or GW9508 for 4 hr. Data are presented as the mean ± SEM (n = 3) of disintegrations per minute (DPMs) and are representative of the results from three independent experiments. **P < 0·01 compared with the vehicle control, as assessed by analysis of variance with the Holm–Sidak post hoc test. There is a linear dose–response of DHA or GW9508 concentration and AA release, as assessed by linear regression model. (b) 3H-AA labelled cells were stimulated with 100 μm DHA or GW9508 at the indicated times. Data are presented as the mean ± SEM (n = 3) of DPMs and are representative of the results from three independent experiments. ##P < 0·01 compared with vehicle control of each time point, as assessed by Student's t-test. (c) Determination of cell viability. Cells were stimulated with 100 μm DHA or GW9508 or vehicle for 7 hr. Data are shown as the mean ± SEM of percentage of absorbance of the formazan product at 490 nm of DHA- or GW9508- treated cells compared with that of vehicle control with four replicates and are representative results from three independent experiments.
Figure 2
Figure 2
Docosahexaenoic acid (DHA) and GW9508 induce arachidonic acid (AA) release through cytosolic phospholipase A2 (cPLA2) specifically in RAW264.7 cells. (a) Cells were pre-treated with a cPLA2 inhibitor, pyrrolidin derivative (1 μm), iPLA2 inhibitor, bromoenol lactone (1 μm), or the sPLA2 inhibitor, thioetheramide-PC (10 μm) for 1 hr, then stimulated with 100 μm DHA or GW9508 for 4 hr and AA release was assayed. (b) Cells were pre-treated with cPLA2 inhibitor (5 μm) for 1 hr, and then stimulated with 100 μm DHA or GW9508 for 4 hr and AA release was assayed. Data are presented as the mean ± SEM (n = 3) of the fold change, compared with the vehicle-treated cells and are representative of three independent experiments. *P < 0·05, **P < 0·01 as indicated, assessed by analysis of variance with Holm–Sidak post hoc test in (a, b). (c) DHA and GW9508 induced AA release specifically. Cells were treated with DHA, GW9508, unsaturated fatty acid, linolenic acid, or the saturated fatty acid, myristic acid or docosanoic acid for 4 hr, followed by AA release assay. Data are presented as the mean ± SEM (n = 3) of the fold change, compared to the vehicle-treated cells and are representative results of three independent experiments. ##P < 0·01 as compared to the vehicle-treated cells, as assessed by Student's t-test. (d) Knock-down efficiency of cPLA2 siRNA. Cells were transfected with either cPLA2 siRNA (100 nm) or Negative Control siRNA (100 nm) for 24 hr. The mRNA level of cPLA2 expression was determined by Taqman real-time PCR. Data are presented as the mean ± SEM (n = 3) of the percentage change compared with the negative control siRNA. ##P < 0·01 as indicated, as assessed by Student's t-test. The protein level of cPLA2 was determined by Western blot and was quantified. Data are representative from three independent experiments. (e, f) Knock-down of cPLA2 decreases DHA and GW9508 induced AA release. Cells were transfected with either cPLA2 siRNA or Negative Control siRNA for 24 hr, stimulated with 100 μm DHA or GW9508 for 4 hr and AA release was assayed. The results are presented as the mean ± SEM (n = 3) of fold stimulation compared with control and are representative of three independent experiments. *P < 0·05 as indicated, as assessed by analysis of variance with Holm–Sidak post hoc test.
Figure 3
Figure 3
Docosahexaenoic acid (DHA) and GW9508 induce cytosolic phospholipase A2 (cPLA2) activation through GPR120 receptor, Gαq protein and β-arrestin 2. (a, d, g). Knock-down efficiency of GPR120, Gαq and β-arrestin 2 small interfering RNA (siRNA). RAW264.7 cells were transfected with either GPR120 siRNA (100 nm), Gαq siRNA (100 nm), β-arrestin 2 siRNA (100 nm) or Negative Control siRNA (100 nm). The mRNA level of GPR120 (a), Gαq (d) and β-arrestin 2 (g) expression was determined by Taqman real-time PCR. Data are presented as the mean ± SEM (n = 3) of percentage change compared with negative control siRNA. ##P < 0·01 as indicated, as assessed by Student's t-test. The protein level of GPR120, Gαq and β-arrestin 2 was determined by Western blot and was quantified. Data are representative of three independent experiments. Knock-down of GPR120 (b, c), Gαq (e, f) and β-arrestin 2 (h, i) by siRNA decreases DHA- or GW9508-induced arachidonic acid (AA) release. RAW264.7 cells were transfected with either GPR120 siRNA, Gαq siRNA, β-arrestin 2 siRNA or Negative Control siRNA for 48 hr, stimulated with 100 μm DHA or GW9508 for 2 hr and then AA release was detected. Data are shown as the mean ± SEM (n = 3) of fold change compared to control and are representative of the results of three independent experiments. *P < 0·05 as indicated, as assessed by analysis of variance with Holm-Sidak post hoc test.
Figure 4
Figure 4
MEK1/2 inhibitor decreases DHA- or GW9508- induced AA release. (a) RAW264.7 cells were pretreated with the MEK1/2 inhibitor, U0126 (20 μM) or (b) the p38 inhibitor, SB203580 (10 μM) for 1 hr, then stimulated with 100 μM DHA or GW9508 for 2 hr and AA release was measured. Data are presented as the mean ± SEM (n=3) of fold change compared to vehicle control and are representative of three independent experiments. **p < 0.01 as indicated, as assessed by ANOVA analysis followed by the Holm-Sidak post hoc test.
Figure 5
Figure 5
Docosahexaenoic acid (DHA) and GW9508 activate cytosolic phospholipase A2 (cPLA2) through activation of extracellular signal-regulated kinase 1/2 (ERK1/2). (a) RAW264.7 cells were serum starved for 2 hr with Dulbecco's modified Eagle's medium containing 0·2% fetal bovine serum, then stimulated with 100 μm DHA or GW9508 for the indicated time. Phospho-ERK1/2 and total ERK1/2 were detected by immunoblot. (b) DHA and GW9508 cause phosphorylation of cPLA2. Cells were stimulated with 100 μm DHA or GW9508 for the indicated time. Cells were assayed by immunoblot with phospho-cPLA2 and total cPLA2 antibody. The ratio of density of phospho-cPLA2/total cPLA2 of DHA- or GW9508-treated group is compared with that of vehicle control, which is set as 1·0. (c) Cells were pre-treated with mitogen-activated protein kinase kinase 1/2 (MEK1/2) inhibitor, U0126 (20 μm), for 1 hr, then stimulated with 100 μm DHA or GW9508 for 10 min. Phospho-ERK1/2 and total ERK1/2 were detected by immunoblot. (d) Cells were stimulated with U0126 (20 μm) for 1 hr, then stimulated with 100 μm DHA or GW9508 for 0·5 hr. Cells were assayed by immunoblot with phospho-cPLA2 and total cPLA2 antibody. The ratio of density is shown as in 5b. The blots shown are from one of three independent experiments, each showing similar results.
Figure 6
Figure 6
Docosahexaenoic acid (DHA) and GW9508 inhibit lipopolysaccharide (LPS) -induced interleukin-6 (IL-6) secretion in part through activation of cytosolic phospholipase A2 (cPLA2) and COX-2. (a) RAW264.7 cells were pre-treated or not with cPLA2 inhibitor (5 μm) for 1 hr, then stimulated with DHA or GW9508 (100 μm) for 1 hr and finally stimulated with LPS (10 ng/ml) for 6 hr. Cell culture supernatants were collected and IL-6 secretion was determined by ELISA. Data are shown as the mean ± SEM (n = 3) of IL-6 secretion (pg/ml) and are representative of the results of three independent experiments. **P < 0·01 as indicated, as assessed by analysis of variance with Holm–Sidak post hoc test. ND = non-detectable. (b) Cells were pre-treated with arachidonic acid (20 μm) for 1 hr, then stimulated with LPS (10 ng/ml) for 6 hr. Cell culture supernatants were assayed for IL-6 secretion. Data are shown as the mean ± SEM (n = 3) of IL-6 secretion (pg/ml) and are representative result from three independent experiments. ##P < 0·01 as indicated, as assessed by Student's t test. ND = non-detectable. (c) Cells were pre-treated with cPLA2 inhibitor (5 μm) or not for 1 hr, then stimulated with DHA (100 μm) for 6 hr. Cyclooxygenase 2 (COX-2) mRNA expression was determined by Taqman real-time PCR. Data are shown as the mean ± SEM (n = 3) of fold change compared with vehicle-treated control and are representative of the results of three independent experiments. **P < 0·01 as indicated, as assessed by analysis of variance with Holm–Sidak post hoc test. (d) Cells were pre-treated or not with COX-2 inhibitor, NS-398 (3 μm) for 1 hr, then stimulated with DHA or GW9508 and LPS as in 6A. Cell culture supernatants were assayed for IL-6 secretion. Data are presented as the mean ± SEM (n = 3) of IL-6 secretion (pg/ml) and are representative of the results of three independent experiments. **P < 0·01 as indicated, as assessed by analysis of variance followed by Holm–Sidak post hoc test.
Figure 7
Figure 7
Docosahexaenoic acid (DHA) stimulates production of prostaglandin E2 (PGE2) and PGE2 decreases lipopolysaccharide (LPS) induced interleukin 6 (IL-6) secretion, which is partially through inhibition of nuclear factor (NF-κB) signalling pathway. (a) RAW264.7 cells and (b) human primary monocyte-derived macrophages were pre-treated or not with cytosolic phospholipase A2 (cPLA2) inhibitor (5 μm) for 1 hr, then stimulated with DHA (100 μm) for 6 hr. Cell culture supernatants were collected and PGE2 release was assayed. Data are shown as the mean ± SEM (n = 3) of prostaglandin E2 (PGE2) release (pg/ml) and are representative results of three independent experiments in RAW264.7 cells and of three different donors in primary monocyte-derived macrophages. **P < 0·01 or *P < 0·05 as indicated, as assessed by analysis of variance with Holm–Sidak post-hoc test. (c) RAW264.7 cells and (d) human primary monocyte-derived macrophages were pre-treated or not with cyclooxygenase 2 (COX-2) inhibitor, NS-398 (3 μm), for 1 hr followed by stimulation with DHA (100 μm) for 1 hr. Cell culture supernatants were collected and PGE2 release was assayed. Data are shown as in (a, b). *P < 0·05 as indicated, as assessed by analysis of variance with Holm–Sidak post hoc test. (e) RAW264.7 cells were pre-treated with PGE2 (100 nm) for 1 hr and then stimulated with 10 ng/ml LPS for 6 hr. Cell culture supernatants were assayed for IL-6 secretion. Data are shown as the mean ± SEM (n = 3) of IL-6 secretion (pg/ml) and are representative of data from three independent experiments. ##P < 0·01 as indicated, as assessed by Student's t-test. (f) RAW264.7 cells were co-transfected with an NF-κB luciferase reporter construct and a Renilla luciferase construct. After 24 hr, cells were pre-treated with 100 nm PGE2 or 100 μm DHA for 1 hr, then stimulated with 10 ng/ml LPS for 6 hr. After stimulation, the cells were lysed in passive lysis buffer and reporter gene activity was measured. Firefly luciferase of NF-κB promoter was normalized to Renilla luciferase activity and data are presented as the mean ± SEM of fold stimulation and are representative results of three independent experiments. **P < 0·01 as indicated, as assessed by analysis of variancefollowed by Holm-Sidak post hoc test.
Figure 8
Figure 8
EP4 receptor of ptostaglandin E2 (PGE2) is involved in the anti-inflammatory effect of docosahexaenoic acid (DHA). (a) RAW264.7 cells were pre-treated with an EP2 inhibitor, AH6809 (3 μm), or an EP4 inhibitor, GW627368X (2 μm) for 1 hr, then stimulated with 100 μm DHA for 1 hr and finally stimulated with 10 ng/ml lipopolysaccharide (LPS) for 6 hr. Cell culture supernatants were collected and assayed for IL-6 secretion. Data shown are the mean ± SEM (n = 3) of IL-6 secretion (pg/ml) and are representative of the results of three independent experiments. **P < 0·01 as indicated, as assessed by analysis of variance with Holm–Sidak post hoc test, ND = non-detectable. (b) Knock-down efficiency of EP2 or EP4 siRNA. RAW264.7 cells were transfected with EP2 siRNA (100 nm), EP4 siRNA (100 nm) or Negative Control siRNA (100 nm). Total RNA was isolated from transfected cells. The mRNA level of EP2 and EP4 expression was determined by Taqman real time PCR. The results are presented as the mean ± SEM (n = 3) of percentage change compared to negative control siRNA. ##P < 0·01 as indiated, as assessed by Student's t-test. The protein level of EP2 and EP4 was detected by Western blot and was quantified. Data are representative results of three independent experiments, each showing similar results. (c) RAW264.7 cells were transfected with either EP2 siRNA (100 nm), EP4 siRNA (100 nm) or Negative Control siRNA (100 nm) for 48 hr, stimulated with 100 μm DHA for 1 hr, then stimulated with lipopolysaccharide (LPS; 10 ng/ml) for 6 hr. Cell culture supernatants were assayed for IL-6 secretion. Data are presented as the mean ± SEM (n = 3) of IL-6 secretion (pg/ml) and are representative of the results of three independent experiments. **P < 0·01 as indicated, as assessed by analysis of variance and Holm–Sidak post hoc test.
Figure 9
Figure 9
Cytosolic phospholipase A2 (cPLA2) activation, cyclooxygenase 2 (COX-2) activation, prostaglandin E2 (PGE2) induction and EP4 receptor are involved in the anti-inflammatory effect of docosahexaenoic acid (DHA) or GW9508 in human primary monocyte-derived macrophages. (a–c) Human primary monocyte-derived macrophages were pre-treated or not with cytosolic phospholipase A2 (cPLA2) inhibitor (5 μm) (a) or COX-2 inhibitor (3 μm) (b) or EP2 inhibitor (3 μm), or EP4 inhibitor (2 μm) (c) for 1 hr, then stimulated with DHA or GW9508 (100 μm) for 1 hr and finally stimulated with lipopolysaccharide (LPS) (10 ng/ml) for 6 hr. Cell culture supernatants were collected and assayed for interlukin-6 (IL-6) secretion. Data are presented as the mean ± SEM (n = 3) of IL-6 secretion (pg/ml) and are representative of the results from three different donors. *P < 0·05 as indicated, as assessed by analysis of variance with Holm–Sidak post hoc test. ND = non-detectable. (d) Human primary monocyte-derived macrophages were pre-treated with 100 nm PGE2 for 1 hr, and then stimulated with 10 ng/ml LPS for 6 hr. Cell culture supernatants were assayed for IL-6 secretion. Data are shown as the mean ± SEM (n = 3) of IL-6 secretion (pg/ml) and are representative of data from three different donors. ##P < 0·01 as indicated, as assessed by Student's t-test. (e) Determination of cell viability. Human primary monocyte-derived macrophages were stimulated with 100 μm DHA or GW9508 or vehicle for 7 hr. Data are shown as the mean ± SEM of percentage of absorbance of the formazan product at 490 nm of DHA- or GW9508-treated cells as compared with that of vehicle control with four replicates. The data shown are representative results from three different donors.

References

    1. Fritsche K. Fatty acids as modulators of the immune response. Annu Rev Nutr. 2006;26:45–73. - PubMed
    1. Zhang MJ, Spite M. Resolvins: anti-inflammatory and proresolving mediators derived from omega-3 polyunsaturated fatty acids. Annu Rev Nutr. 2012;32:203–27. - PubMed
    1. Calder PC. Omega-3 fatty acids and inflammatory processes. Nutrients. 2010;2:355–74. - PMC - PubMed
    1. Calder PC. Long-chain fatty acids and inflammation. Proc Nutr Soc. 2012;71:284–9. - PubMed
    1. Yates CM, Calder PC, Ed Rainger G. Pharmacology and therapeutics of omega-3 polyunsaturated fatty acids in chronic inflammatory disease. Pharmacol Ther. 2014;141:272–82. - PubMed

MeSH terms

LinkOut - more resources