. 2014 Sep;34(9):676-85.
doi: 10.1089/jir.2013.0118. Epub 2014 Mar 27.

High-density nucleosome occupancy map of human chromosome 9p21-22 reveals chromatin organization of the type I interferon gene cluster

Affiliations

High-density nucleosome occupancy map of human chromosome 9p21-22 reveals chromatin organization of the type I interferon gene cluster

Jonathan E Freaney et al. J Interferon Cytokine Res. 2014 Sep.

Abstract

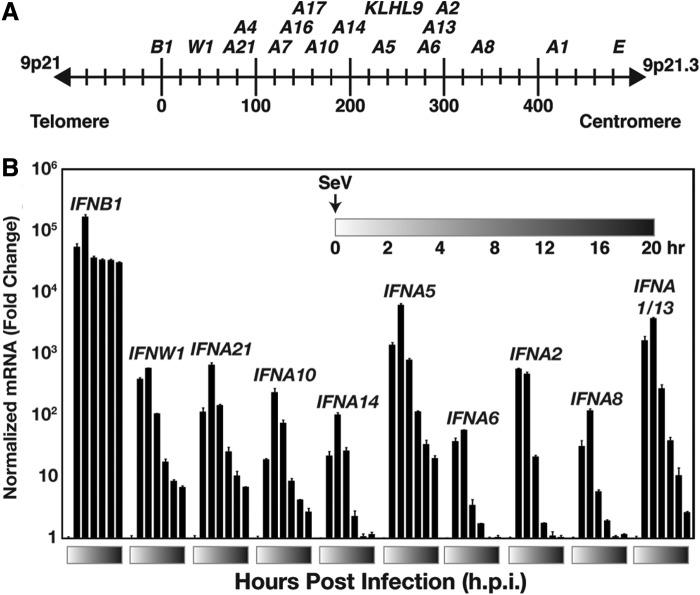
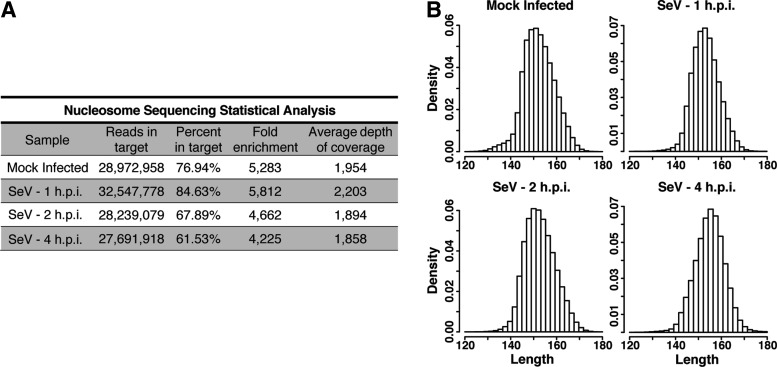
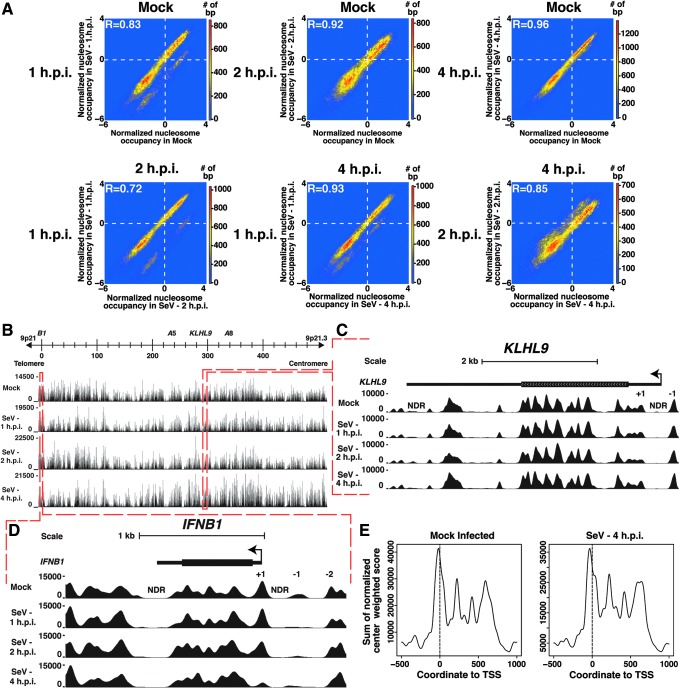
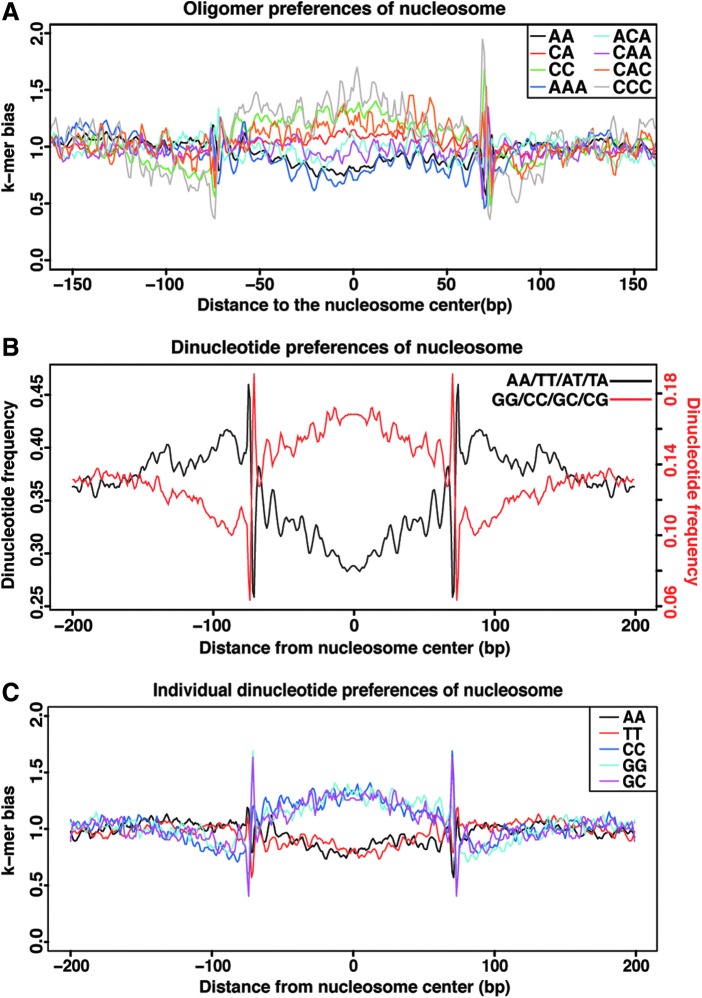
Genome-wide investigations have dramatically increased our understanding of nucleosome positioning and the role of chromatin in gene regulation, yet some genomic regions have been poorly represented in human nucleosome maps. One such region is represented by human chromosome 9p21-22, which contains the type I interferon gene cluster that includes 16 interferon alpha genes and the single interferon beta, interferon epsilon, and interferon omega genes. A high-density nucleosome mapping strategy was used to generate locus-wide maps of the nucleosome organization of this biomedically important locus at a steady state and during a time course of infection with Sendai virus, an inducer of interferon gene expression. Detailed statistical and computational analysis illustrates that nucleosomes in this locus exhibit preferences for particular dinucleotide and oligomer DNA sequence motifs in vivo, which are similar to those reported for lower eukaryotic nucleosome-DNA interactions. These data were used to visualize the region's chromatin architecture and reveal features that are common to the organization of all the type I interferon genes, indicating a common nucleosome-mediated gene regulatory paradigm. Additionally, this study clarifies aspects of the dynamic changes that occur with the nucleosome occupying the transcriptional start site of the interferon beta gene after virus infection.


Figures

<b>FIG. 1.</b>
FIG. 1.
Virus-induced expression of the type I IFN gene cluster. (A) Illustration of the human chromosome on 9p21–22 depicting ∼450-kb type I IFN gene cluster. The type I IFN genes and KLHL9, the sole non-IFN gene in the region, are indicated. (B) Type I IFN gene induction by Sendai virus infection in Namalwa cells. Cells were mock-infected or infected (5 pfu/cell), and 5×10⁶ cells were harvested at each time point for RNA isolation, and RT-PCR was performed with IFN gene-specific primer pairs as indicated or GAPDH for normalization. Error bars denote standard deviation for triplicate PCRs. See also Supplementary Fig. S2. (Supplementary Data are available online at www.liebertpub.com/jir).
<b>FIG. 2.</b>
FIG. 2.
Enrichment and sequencing of nucleosome protected DNA fragments in the type I IFN gene cluster. (A) Statistical analysis of sequence data. See text for details. (B) Plot of the insert length distributions for the nucleosome protected sequences with length between 120 and 180 bp in each sample.
<b>FIG. 3.</b>
FIG. 3.
Comparison of nucleosome maps reveals distinct chromatin organization in constitutive versus virus-activated genes. (A) Density plots comparing the normalized nucleosome occupancy per base pair in the mock-infected cells versus the infected cells. Color is used to represent the number of base pairs with occupancy scores mapping to that point in the graph. Values above zero indicate nucleosome enrichment relative to the locus-wide average. The Pearson correlation (R) between the maps is indicated. (B) Nucleosome occupancy in the human type I IFN gene cluster. Individual plots of nucleosome occupancy per base pair across the ∼450-kb locus are shown for the mock-infected cells and for the Sendai virus-infected cells at 1, 2, and 4 h.p.i. A scale bar representing the positions of relevant genes is illustrated above. (C) Magnified view of the KLHL9 region. The KLHL9 gene is illustrated as a solid line, the TSS and directionality indicated by an arrow, and the gene body indicated with a box. Each row below depicts nucleosome occupancy per base pair for mock infected and 1, 2, and 4 h SeV infected. Positions of 5′ and 3′ NDRs and +1 and −1 nucleosomes flanking the TSS are indicated. (D) Magnified view of the IFNB1 region. The IFNB1 gene is illustrated as a solid line, the TSS and directionality indicated by an arrow, and the gene body indicated with a box. Each row below depicts nucleosome occupancy per base pair. Positions of 5′ and 3′ NDRs and +1, −1, and −2 nucleosomes flanking the TSS are indicated. (E) Common nucleosome organization in the type I IFN gene promoters. Normalized nucleosome occupancy scores are plotted with the TSS designated “0” for the IFNB1, IFNW1, and 13 IFNA genes. See also Supplementary Fig. S2.
<b>FIG. 4.</b>
FIG. 4.
Rotational positioning and nucleotide preferences of nucleosomes in the type I IFN gene cluster. (A) Frequency of dinucleotide and trinucleotide occurrences as a function of distance relative to the calculated nucleosome center, revealing signatures of rotational positioning in vivo. The y-axis represents the frequency of nucleosome dyads at a given distance normalized to expected nucleotide frequency. The 10-bp-spaced peaks represent helical rotational preferences of oligomers relative to the nucleosome surface. (B) Position-dependent dinucleotide sequence preferences in the type I IFN gene cluster. Well-positioned nucleosomes (3,996) determined from center-weighted scores were analyzed for the occurrence of AA/AT/TT/TA (black) and CC/CG/GC/GG (red) dinucleotides at each position of the alignment with a 3-bp moving average. (C) Representation of the most influential individual dinucleotide preferences in the type I IFN gene cluster. The frequency of nucleotide dimers is plotted relative to a nucleosome dyad inferred from mapped sequence reads. See also Supplementary Fig. S3.

References

    1. Agalioti T, Lomvardas S, Parekh B, Yie J, Maniatis T, Thanos D. 2000. Ordered recruitment of chromatin modifying and general transcription factors to the IFN-beta promoter. Cell 103(4):667–678 - PubMed
    1. Apostolou E, Thanos D. 2008. Virus infection induces NF-kappaB-dependent interchromosomal associations mediating monoallelic IFN-beta gene expression. Cell 134(1):85–96 - PubMed
    1. Badis G, Chan ET, van Bakel H, Pena-Castillo L, Tillo D, Tsui K, Carlson CD, Gossett AJ, Hasinoff MJ, Warren CL, Gebbia M, Talukder S, Yang A, Mnaimneh S, Terterov D, Coburn D, Li Yeo A, Yeo ZX, Clarke ND, Lieb JD, Ansari AZ, Nislow C, Hughes TR. 2008. A library of yeast transcription factor motifs reveals a widespread function for Rsc3 in targeting nucleosome exclusion at promoters. Mol Cell 32(6):878–887 - PMC - PubMed
    1. Bashiardes S, Veile R, Helms C, Mardis ER, Bowcock AM, Lovett M. 2005. Direct genomic selection. Nat Methods 2(1):63–69 - PubMed
    1. Bernstein BE, Liu CL, Humphrey EL, Perlstein EO, Schreiber SL. 2004. Global nucleosome occupancy in yeast. Genome Biol 5(9):R62. - PMC - PubMed

Associated data