Review
. 2014 Mar;22(1):29-48.
doi: 10.1016/j.jfda.2014.01.003. Epub 2014 Feb 1.

Raman spectroscopy in the analysis of food and pharmaceutical nanomaterials

Affiliations
Review

Raman spectroscopy in the analysis of food and pharmaceutical nanomaterials

Ying-Sing Li et al. J Food Drug Anal. 2014 Mar.

Abstract

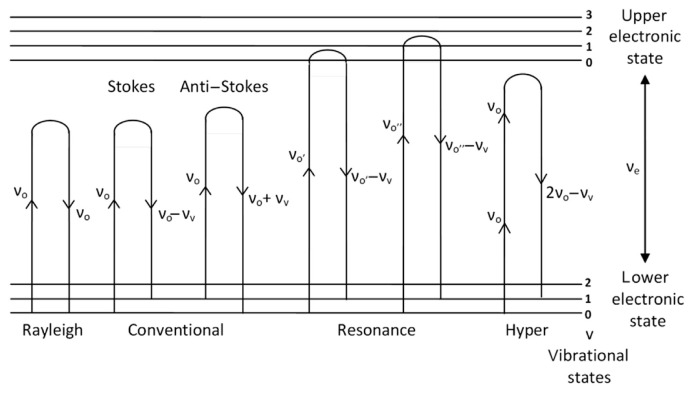
Raman scattering is an inelastic phenomenon. Although its cross section is very small, recent advances in electronics, lasers, optics, and nanotechnology have made Raman spectroscopy suitable in many areas of application. The present article reviews the applications of Raman spectroscopy in food and drug analysis and inspection, including those associated with nanomaterials. Brief overviews of basic Raman scattering theory, instrumentation, and statistical data analysis are also given. With the advent of Raman enhancement mechanisms and the progress being made in metal nanomaterials and nanoscale metal surfaces fabrications, surface enhanced Raman scattering spectroscopy has become an extra sensitive method, which is applicable not only for analysis of foods and drugs, but also for intracellular and intercellular imaging. A Raman spectrometer coupled with a fiber optics probe has great potential in applications such as monitoring and quality control in industrial food processing, food safety in agricultural plant production, and convenient inspection of pharmaceutical products, even through different types of packing. A challenge for the routine application of surface enhanced Raman scattering for quantitative analysis is reproducibility. Success in this area can be approached with each or a combination of the following methods: (1) fabrication of nanostructurally regular and uniform substrates; (2) application of statistic data analysis; and (3) isotopic dilution.

Keywords: Food; Nanomaterials; Pharmaceuticals; Raman cell imaging; Raman spectroscopy.


Conflict of interest statement

Conflicts of interest

The authors declare that there are no conflicts of interest.

Figures

Fig. 1
Fig. 1
Rayleigh scattering, conventional, resonance and hyper Raman scatterings involved in vibrational and electronic energy levels. Note that different excitation frequencies are required to generate different Raman effects.
Fig. 2
Fig. 2
Schematic layout of a typical Fourier transform (FT)-Raman spectrometer. D = detector; L = laser; MI = Michelson interferometer; O = objective lens; RF = Rayleigh filter; S = sample.
Fig. 3
Fig. 3
Schematic layout of a typical dispersive micro-Raman spectrometer. CCD = charge coupled device; DG = diffraction grating; DM = dove mirror; L = laser; M = monochromator; MS = microscope; O = objective lens; OF = optical filters; S = sample; SL = slits.
Fig. 4
Fig. 4
Raman map obtained from the surface of a tablet containing 500 mg paracetamol and 8 mg codeine.
Fig. 5
Fig. 5
Three different types of fiber optic probes: (A) fiber bundle probe, (B) double-fiber probe, and (C) single fiber probe. The lower images represent the cross-sectional view. The shaded fiber represents the excitation fiber in (A) and (B).
Fig. 6
Fig. 6
Optical guiding system for a single fiber probe.
Fig. 7
Fig. 7
Coherent anti-Stokes Raman (CARS) image of TiO2 nanoparticles on a section of the primary lamellae (main panel) and three-dimensional projection showing a nanoaggregate on the secondary lamellae (inset). NP with arrow = TiO2 nanoparticles; PC = pillar cell; PL = primary lamellae; PV = pavement cell (epithelium); SL = secondary lamellae. Note. From “Bioavailability of nanoscale metal oxides TiO2, CeO2, and ZnO to fish,” by B.D. Johnston, T.M. Scown, J. Moger, et al, 2010, Environ Sci Technol, 44, p. 1141–51. Copyright 2010, American Chemical Society. Reprinted with permission.
Fig. 8
Fig. 8
Classification of pesticides using the first two principal components (PCs). Note. From “Detection of pesticides in fruits by surface-enhanced Raman spectroscopy coupled with gold nanostructures.,” by B. Liu, P. Zhou, X. Liu, et al, 2013, Food Process Tech, 6, p. 710–8. Copyright 2012, Springer Science and Business Media. Reprinted with permission.
Fig. 9
Fig. 9
Transmission electron microscope (TEM) micrograph and size distribution of gold nanorods. Note. From “Gold nanorods as surface enhanced Raman spectroscopy substrates for sensitive and selective detection of ultra-low levels of dithiocarbamate pesticides,” by B. Saute, R. Premasiri, L. Ziegler, et al, 2012, Analyst, 137, p. 5082–7. Copyright 2012, The Royal Society of Chemistry. Reprinted with permission.
Fig. 10
Fig. 10
Surface enhanced Raman scattering (SERS) spectra of a series of concentrations of ciprofloxacin (20–200 ppm). Note. From [109]. Copyright 2009, John Wiley & Sons, Ltd. Printed with permission.
Fig. 11
Fig. 11
Schematic of sandwich immunoassays. Note. From “Magnetic-field-assisted rapid ultrasensitive immunoassays using Fe3O4/ZnO/Au nanorices as Raman probes,” by X. Hong, X Chu. P. Zou, et al, 2010, Biosens Bioelectron, 26, p. 918–22. Copyright 2010, Elsevier. Reprinted with permission.
Fig. 12
Fig. 12
Single walled carbon nanotubes (SWNTs) with different Raman colors. (A) schematic SWNTs with three different isotope compositions (C13-SWNT, C12/C13-SWNT, C12-SWNT) conjugated with different targeting ligands. (B) Solution phase Raman spectra of the three SWNT conjugates under 785 nm laser excitation. Different G-band peak positions were observed. At the same SWNT concentration, the peak height of C12-SWNT (Hipco) was approximately two times higher than that of C13-SWNT and approximately four times higher than that of C12/C13-SWNT. For mixtures used in biological experiments, concentrations of the three SWNTs were adjusted to give similar G-band peak intensities of the three colors, as shown in this figure. Note. From “Multiplexed multicolor Raman imaging of live cells with isotopically modified single walled carbon nanotubes,” by Z. Liu, X. Li, S.M. Tabakman, et al, 2008, J Am Chem Soc, 130, p. 13540–1. Copyright 2008, American Chemical Society. Reprinted with permission.
Fig. 13
Fig. 13
From left to right within each row: bright and dark-field images (20× magnification) and accompanying Raman spectra of chronic lymphocytic leukemia (CLL) cells stained with anti-CD19 and nanoparticle conjugates. (A) CLL cells stained with Giemsa and labeled with anti-CD19-SERS nanoparticles; (B) CLL cells stained with Giemsa and incubated with anti-CD4 antibody-SERS conjugates; and (C) CLL cells stained with Giemsa and incubated with control SERS nanoparticles (unconjugated particles). The Giemsa stain produces the dark features in the column of images on the left, Rayleigh scattering produces the bright features in the column of images in the middle, and Raman scattering produces the signals in the spectra in right hand column. Note. From “Detection of chronic lymphocytic leukemia cell surface markers using surface enhanced Raman scattering gold nanoparticles,” by Z. Nguyen, X. Li, S.M. Tabakman et al, 2010, Cancer Lett, 292, p. 91–7. Copyright 2009, Elsevier. Reprinted with permission.

References

    1. Aillon KL, Xie Y, El-Gendy N, et al. Effects of nanomaterial physicochemical properties on in vivo toxicity. Adv Drug Delivery Rev. 2009;61:457–66. - PMC - PubMed
    1. Hong J, Peralta-Videa JR, Gardea-Torresdey JL. Nanomaterials in agricultural production: benefits and possible threats? In: Shamim N, Sharma VK, editors. Sustainable nanotechnology and the environment: advances and achievements. Washington, DC: American Chemical Society; 2013. pp. 73–91.
    1. Gazit E, Mitraki A. Plenty of room for biology at the bottom: an introduction to bionanotechnology. 2nd ed. London: Imperial College Press; 2007.
    1. Freitas RA. Nanomedicine, volume I: basic capabilities. Georgetown, TX: Landes Bioscience; 1999.
    1. De Jong WH, Borm PJ. Drug delivery and nano particles: applications and hazards. Int J Nanomed. 2008;3:133–49. - PMC - PubMed

MeSH terms

Substances

LinkOut - more resources