. 2014 Mar 27:15:89.
doi: 10.1186/1471-2105-15-89.

TSSAR: TSS annotation regime for dRNA-seq data

Affiliations

TSSAR: TSS annotation regime for dRNA-seq data

Fabian Amman et al. BMC Bioinformatics. .

Abstract

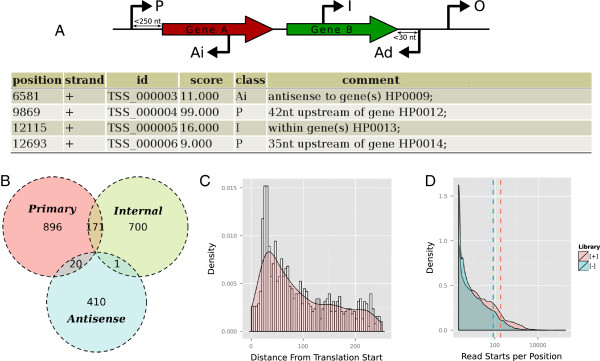
Background: Differential RNA sequencing (dRNA-seq) is a high-throughput screening technique designed to examine the architecture of bacterial operons in general and the precise position of transcription start sites (TSS) in particular. Hitherto, dRNA-seq data were analyzed by visualizing the sequencing reads mapped to the reference genome and manually annotating reliable positions. This is very labor intensive and, due to the subjectivity, biased.

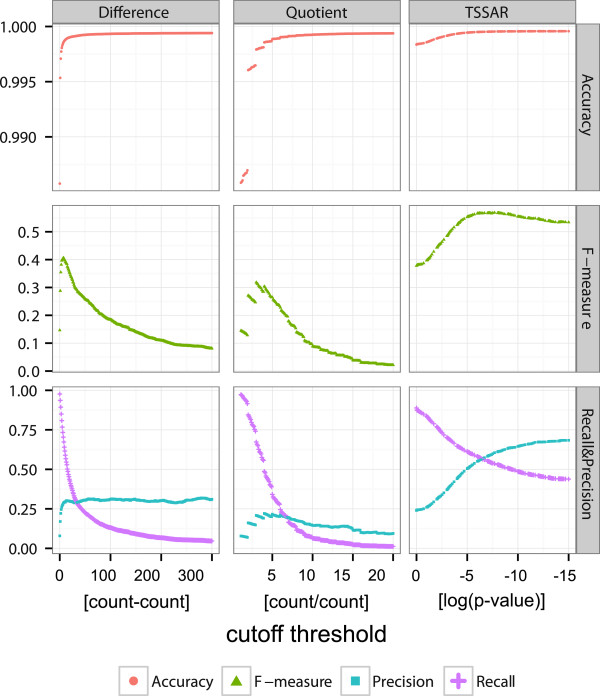
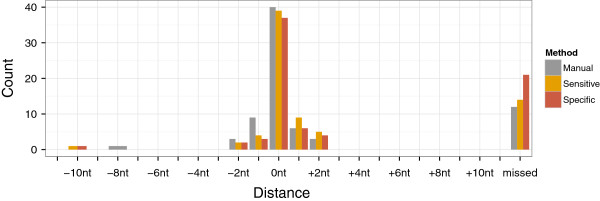
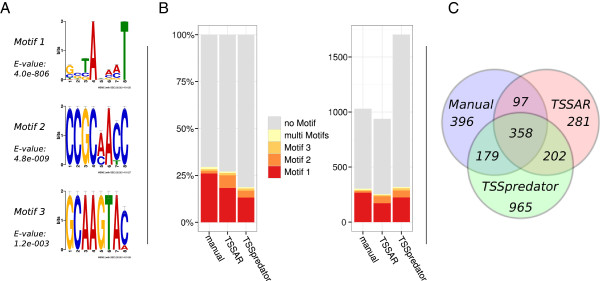
Results: Here, we present TSSAR, a tool for automated de novo TSS annotation from dRNA-seq data that respects the statistics of dRNA-seq libraries. TSSAR uses the premise that the number of sequencing reads starting at a certain genomic position within a transcriptional active region follows a Poisson distribution with a parameter that depends on the local strength of expression. The differences of two dRNA-seq library counts thus follow a Skellam distribution. This provides a statistical basis to identify significantly enriched primary transcripts.We assessed the performance by analyzing a publicly available dRNA-seq data set using TSSAR and two simple approaches that utilize user-defined score cutoffs. We evaluated the power of reproducing the manual TSS annotation. Furthermore, the same data set was used to reproduce 74 experimentally validated TSS in H. pylori from reliable techniques such as RACE or primer extension. Both analyses showed that TSSAR outperforms the static cutoff-dependent approaches.

Conclusions: Having an automated and efficient tool for analyzing dRNA-seq data facilitates the use of the dRNA-seq technique and promotes its application to more sophisticated analysis. For instance, monitoring the plasticity and dynamics of the transcriptomal architecture triggered by different stimuli and growth conditions becomes possible.The main asset of a novel tool for dRNA-seq analysis that reaches out to a broad user community is usability. As such, we provide TSSAR both as intuitive RESTful Web service ( http://rna.tbi.univie.ac.at/TSSAR) together with a set of post-processing and analysis tools, as well as a stand-alone version for use in high-throughput dRNA-seq data analysis pipelines.


Figures

Figure 1
Figure 1
Post-processing and Visualization. (A) Similar, but more restrictive, to the scheme in [4] each annotated transcription start site is classified according to its genomic context: If a TSS is positioned within 250 nt upstream of an annotated gene, it is classified as Primary. TSS within an annotated gene is labeled Internal. A TSS which is on the opposite strand of an annotated gene is classified as Antisense. This class further splits into Ai and Ad, for internal antisense and downstream antisense, respectively. The latter is reserved for a TSS which points in the opposite reading direction and is less than 30 nt downstream of an annotated gene. A TSS that falls in none of these classes is reported to be Orphan. (B) As a matter of fact, one TSS can have several labels as it might fall into more than one of the aforementioned classes. The TSSAR Web service summarizes the counts of the overlapping main classes graphically. (C) For TSS which are annotated as ’Primary’ the 5’UTR lengths are deduced and the corresponding distribution is plotted. (D) To assess the efficiency of the TEX treatment, the distribution of read starts per position is provided as a helpful indicator. If the enrichment in the [+]-library worked efficiently, we expect fewer read start sites, each of which will have more reads. Hence the distribution is flattened on the left side and bulged at the right side. The corresponding distribution and the mean (dashed line) is expected to be shifted to the right compared to the [–]-library.
Figure 2
Figure 2
Regions of non-convergence. Regions where the applied zero-inflated Poisson regression does not converge are omitted from the analysis and need manual inspection. Since the basic unit which cannot converge is the step size (equals a tenth part of the windows size) there is a correlation between the parameter window size and the percentage of the genome which can not be modeled. The H. pylori dRNA-seq data (see section Evaluation) shows that for all practical useful window sizes below 5,000 nt, less then 1% of the genome eludes analysis.
Figure 3
Figure 3
Evaluation of TSSARperformance. Comparison of the prediction power of TSSAR against two fixed-cutoff approaches Difference and Quotient. For each method different cutoff thresholds were applied. The difference, quotient and logarithm of the p-value are plotted along the x-axis. Please note, for comparability the log(p-value) is plotted in descending order from left to right. The resulting predictions were evaluated by calculating the recall rate, precision, F-measure and accuracy. The dynamic approach of TSSAR clearly outperforms the remaining in all aspects. Since only TSSAR applies a clustering of consecutive TSS positions, this effect was separately examined, results can be found in Additional file 1: Figure S5.
Figure 4
Figure 4
Recall experimental validated TSS. Comparison of 74 experimentally validated TSS described in literature [4] with TSSAR results. The Manual TSS annotation recovered 40, 15 and 6 TSS with a 0, ±1 and ±2 nt offset, respectively. Here 12 TSS were annotated more than 10 nt away from the experimentally determined position (summarized as missed in the plot). TSSAR was run with a Sensitive and a Specific parameter set (p-value cutoff 0.05 and 0.0001; noise cutoff 1 and 3, respectively). With sensitive parameters 39 TSS (53%) were annotated on the exact same position. Of the remaining TSS 13 and 7 were annotated with ±1 and ±2 nt variance, respectively, whereas 14 TSS (19%) were annotated more than 10 nt away. The specific TSSAR prediction annotated 37, 9 and 6 TSS with 0, ±1 and ±2 nt offset, respectively, relative to the experimentally validated position. In this case 21 TSS (28%) were annotated more than 10 nt away, and therefore annotated as missed. The results of the same analysis including also our naïve benchmark approaches can be found in Additional file 1: Figure S3.
Figure 5
Figure 5
Comparison TSSARand TSSpredator. To assess the performance of TSSAR and TSSpredator we used dRNA-seq data of S. maltophilia[33]. Thereby, the enrichment of cis-regulatory DNA motifs upstream of the predicted TSS was used as a surrogate for sensitivity. Furthermore, the individual results were compared to a manual annotation. Panel A shows the significantly enriched sequence motifs. Panel B shows the relative enrichment and the total count of this motifs in the sets of all TSS predicted by TSSAR, TSSpredator and by a manual analysis. Panel C depicts the overlap of the TSS annotated by the different methods.

References

    1. Croucher NJ, Thomson NR. Studying bacterial transcriptomes using RNA-seq. Curr Opin Microbiol. 2010;13(5):619–624. doi: 10.1016/j.mib.2010.09.009. - DOI - PMC - PubMed
    1. Cho BK, Zengler K, Qiu Y, Park YS, Knight EM, Barrett CL, Gao Y, Palsson BØ. The transcription unit architecture of the Escherichia coli genome. Nat Biotechnol. 2009;27(11):1043–1049. doi: 10.1038/nbt.1582. - DOI - PMC - PubMed
    1. Wurtzel O, Sapra R, Chen F, Zhu Y, Simmons B, Sorek R. A single-base resolution map of an archaeal transcriptome. Genome Res. 2010;20:133–141. doi: 10.1101/gr.100396.109. - DOI - PMC - PubMed
    1. Sharma C, Hoffmann S, Darfeuille F, Reignier J, Findeiß S, Sittka A, Chabas S, Reiche K, Hackermüller J, Reinhardt R, Stadler PF, Vogel J. The primary transcriptome of the major human pathogen Helicobacter pylori. Nature. 2010;464(7286):250–255. doi: 10.1038/nature08756. - DOI - PubMed
    1. Schmidtke C, Findeiß S, Sharma C, Kuhfuß J, Hoffmann S, Vogel J, Stadler P, Bonas U. Genome-wide transcriptome analysis of the plant pathogen Xanthomonas identifies sRNAs with putative virulence functions. Nucleic Acids Res. 2012;40(5):2020–2031. doi: 10.1093/nar/gkr904. - DOI - PMC - PubMed

Publication types

LinkOut - more resources