. 2014 Apr;18(4):568-89.
doi: 10.1111/jcmm.12290. Epub 2014 Mar 28.

Comparative proteomic analysis of human lung telocytes with fibroblasts

Affiliations

Comparative proteomic analysis of human lung telocytes with fibroblasts

Yonghua Zheng et al. J Cell Mol Med. 2014 Apr.

Abstract

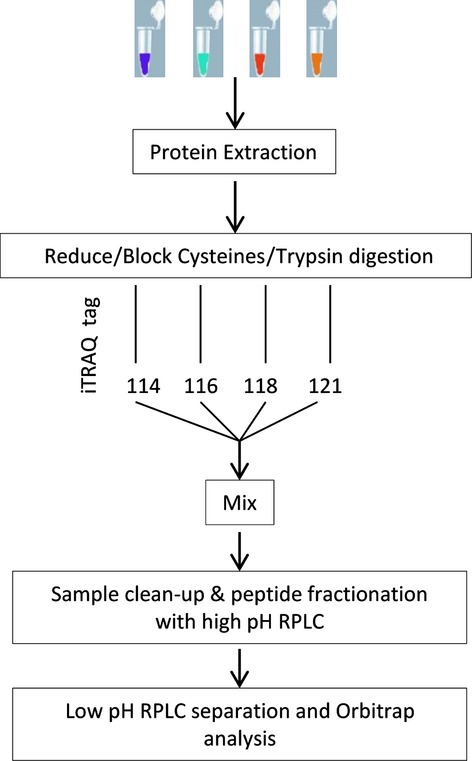
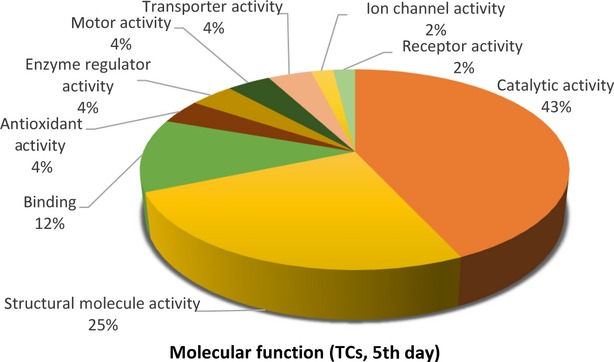
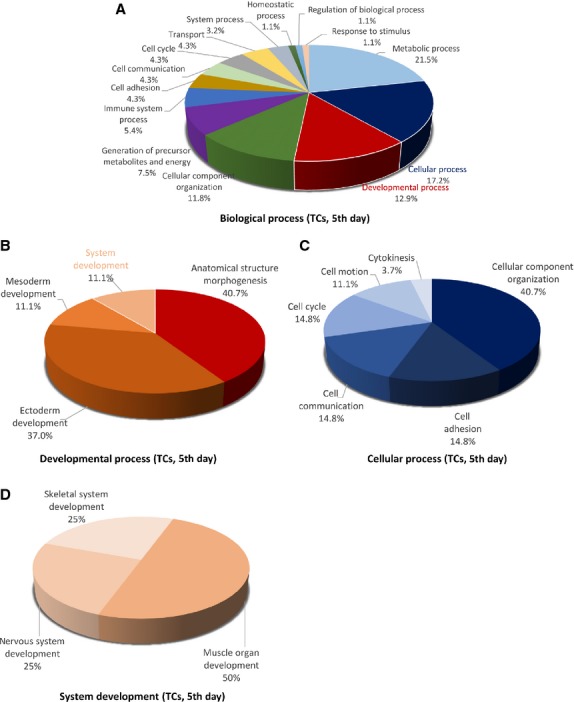
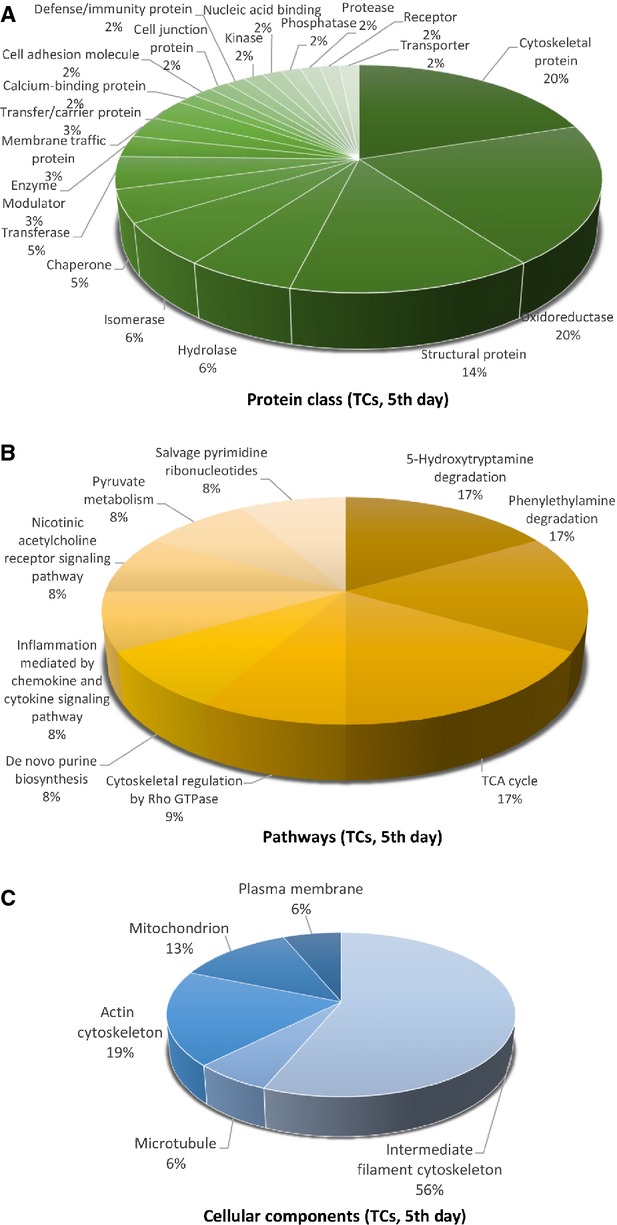
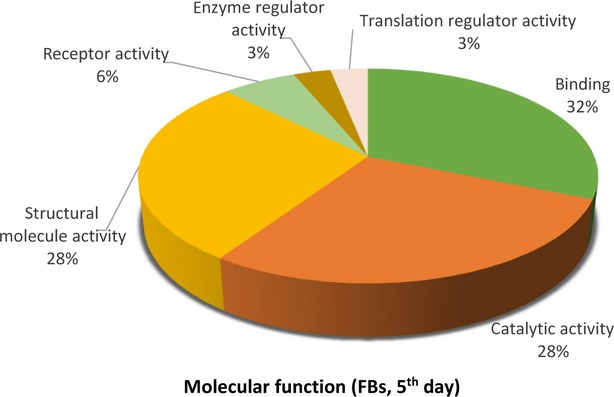
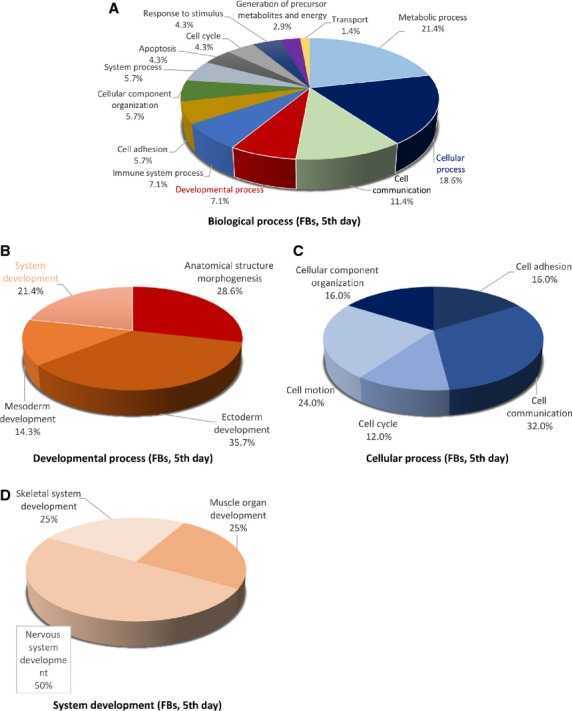
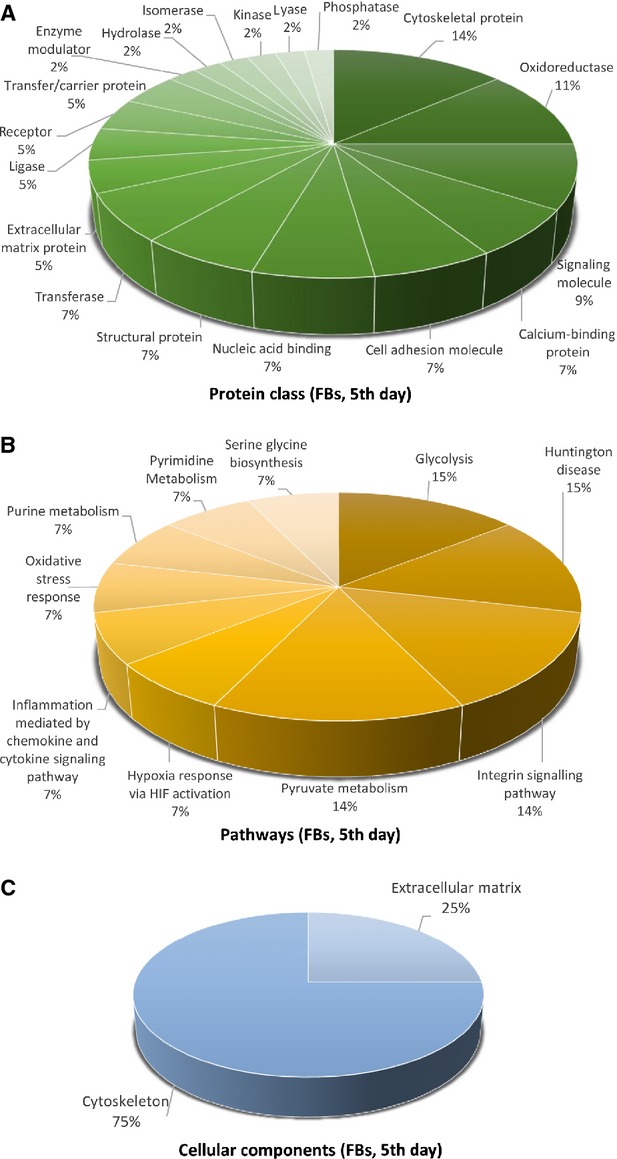
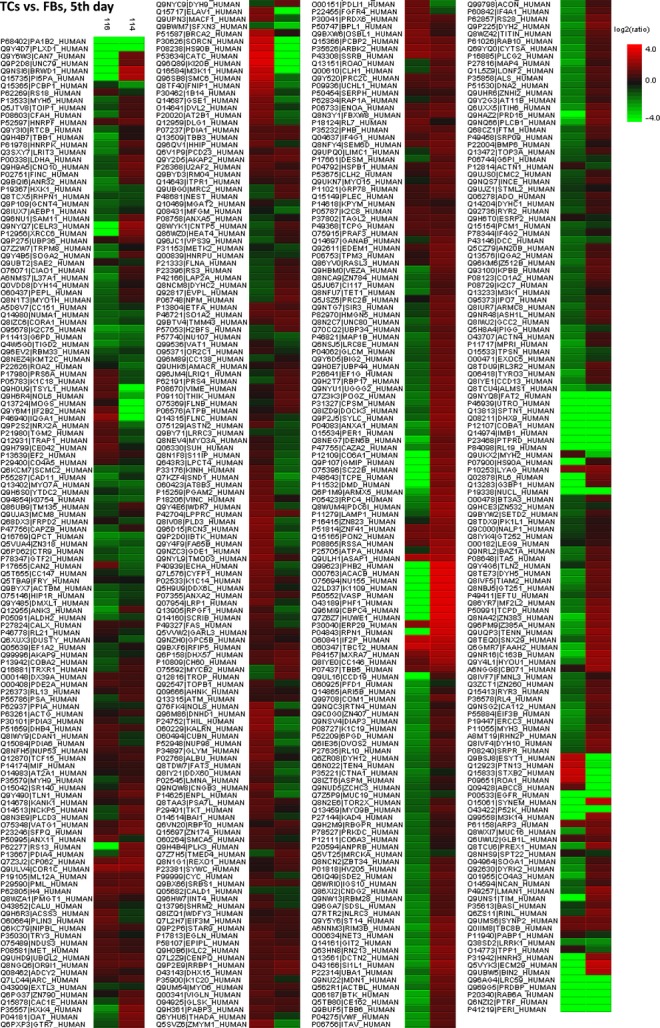
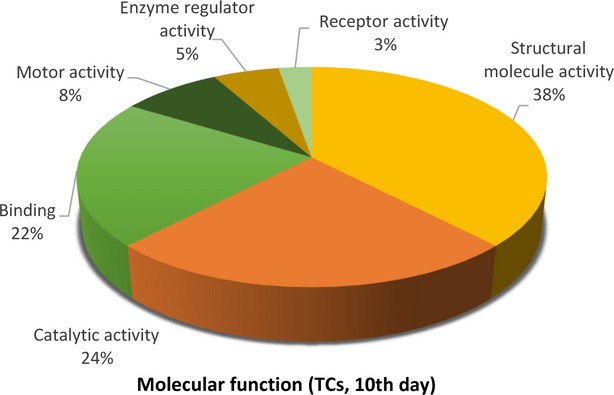
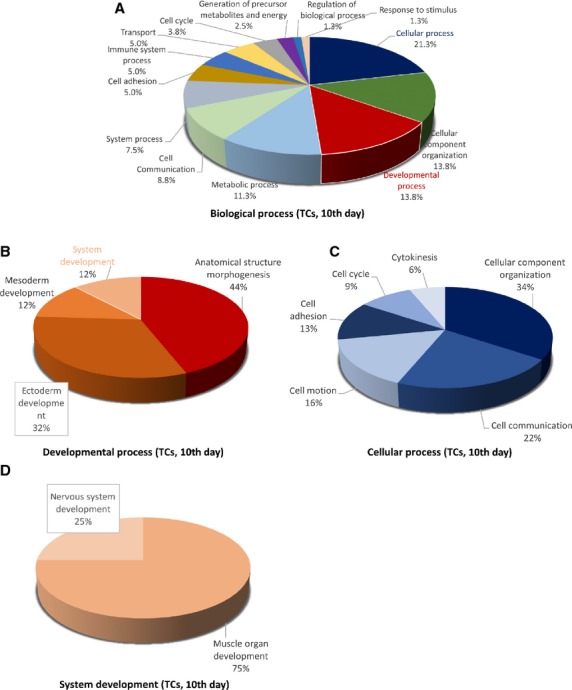
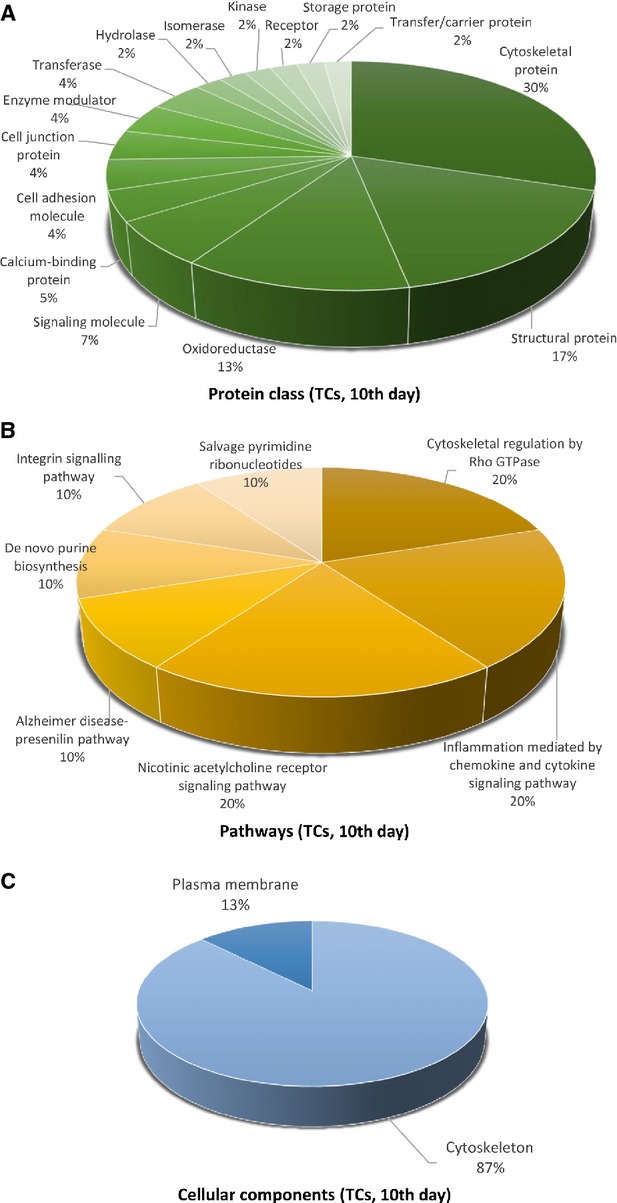
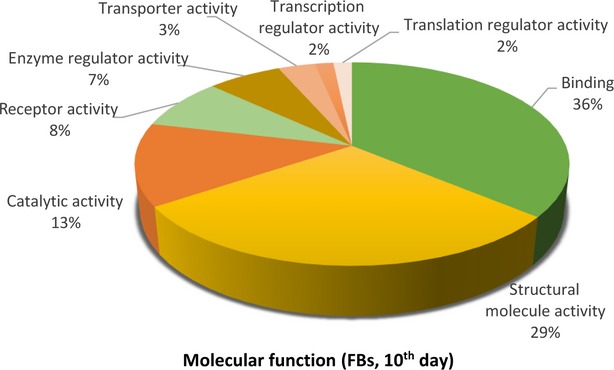
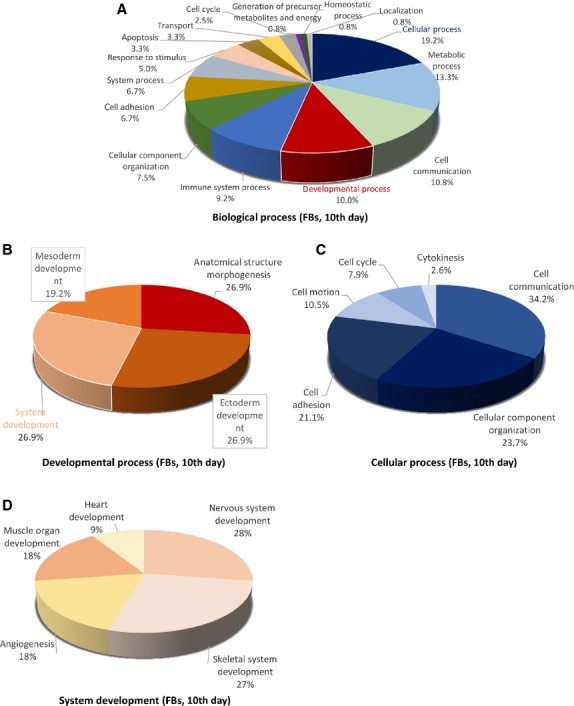
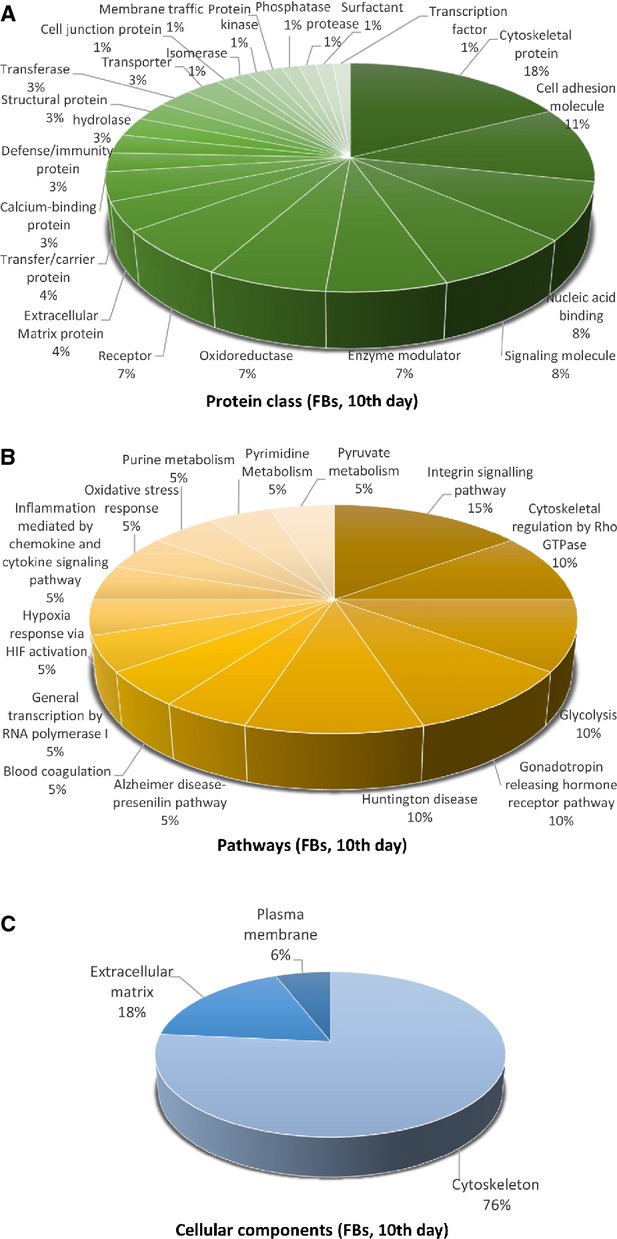
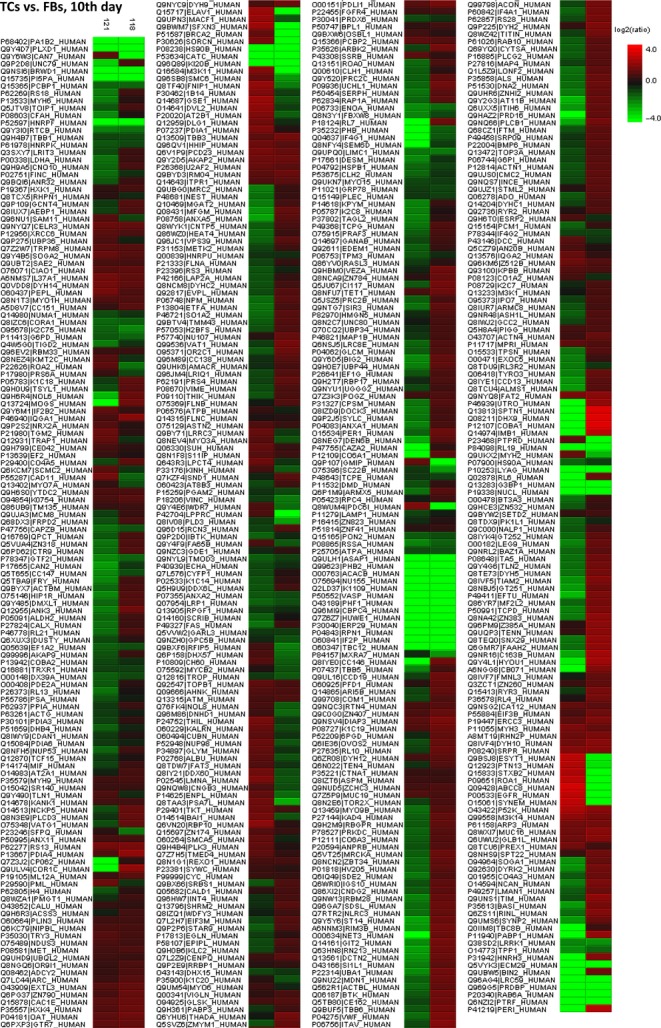
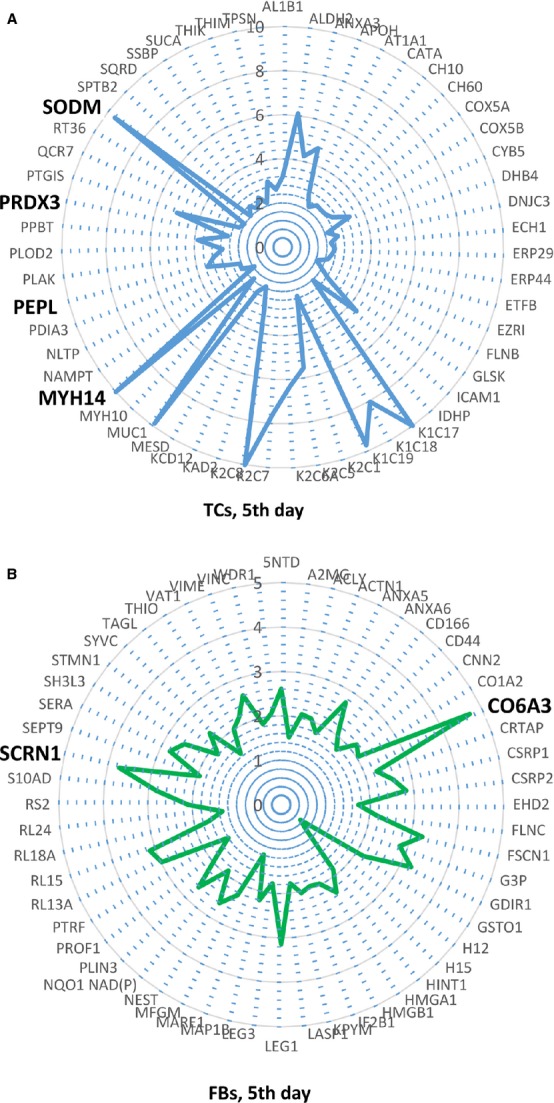
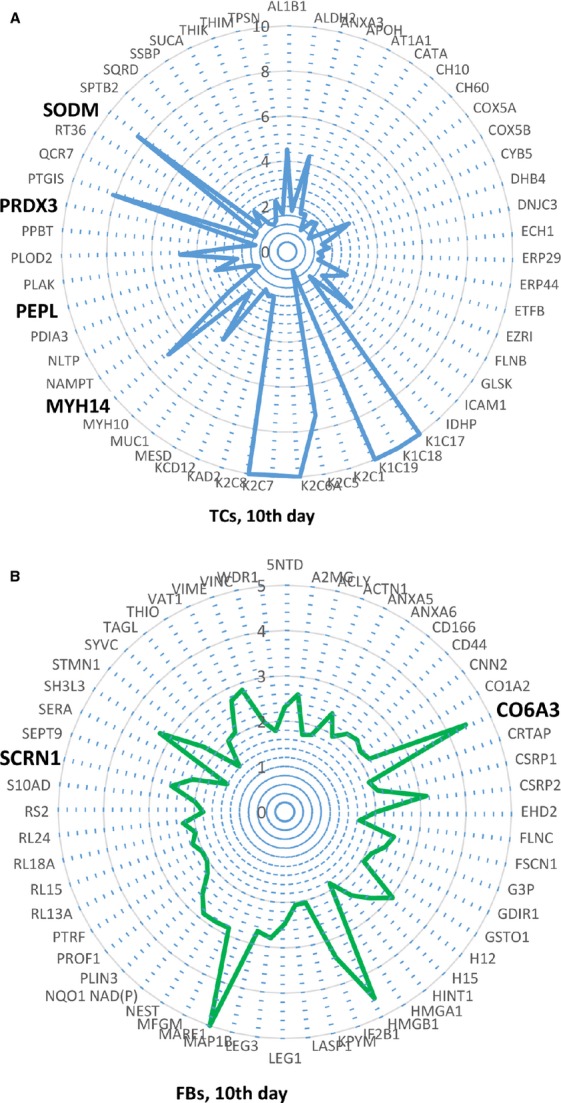
Telocytes (TCs) were recently described as interstitial cells with very long prolongations named telopodes (Tps; www.telocytes.com). Establishing the TC proteome is a priority to show that TCs are a distinct type of cells. Therefore, we examined the molecular aspects of lung TCs by comparison with fibroblasts (FBs). Proteins extracted from primary cultures of these cells were analysed by automated 2-dimensional nano-electrospray ionization liquid chromatography tandem mass spectrometry (2D Nano-ESI LC-MS/MS). Differentially expressed proteins were screened by two-sample t-test (P < 0.05) and fold change (>2), based on the bioinformatics analysis. We identified hundreds of proteins up- or down-regulated, respectively, in TCs as compared with FBs. TC proteins with known identities are localized in the cytoskeleton (87%) and plasma membrane (13%), while FB up-regulated proteins are in the cytoskeleton (75%) and destined to extracellular matrix (25%). These identified proteins were classified into different categories based on their molecular functions and biological processes. While the proteins identified in TCs are mainly involved in catalytic activity (43%) and as structural molecular activity (25%), the proteins in FBs are involved in catalytic activity (24%) and in structural molecular activity, particularly synthesis of collagen and other extracellular matrix components (25%). Anyway, our data show that TCs are completely different from FBs. In conclusion, we report here the first extensive identification of proteins from TCs using a quantitative proteomics approach. Protein expression profile shows many up-regulated proteins e.g. myosin-14, periplakin, suggesting that TCs might play specific roles in mechanical sensing and mechanochemical conversion task, tissue homoeostasis and remodelling/renewal. Furthermore, up-regulated proteins matching those found in extracellular vesicles emphasize TCs roles in intercellular signalling and stem cell niche modulation. The novel proteins identified in TCs will be an important resource for further proteomic research and it will possibly allow biomarker identification for TCs. It also creates the premises for understanding the pathogenesis of some lung diseases involving TCs.

Keywords: LC-MS/MS; fibroblasts; isobaric tags for relative and absolute quantification (iTRAQ); lung; proteomics; telocytes.


Figures

Figure 1
Figure 1
Proteomic process flow chart illustrating the steps involved in the differential analysis of TCs and FBs proteome in cell culture
Figure 2
Figure 2
Pie chart representation of the distribution of identified proteins in TCs (cell culture, 5th day) according to their molecular functions. Categorizations were based on information provided by the online resource PANTHER classification system.
Figure 3
Figure 3
Pie chart representation of the distribution of identified proteins in TCs (cell culture, 5th day) according to their biological processes (A), cellular processes (B), developmental processes (C) and system development (D) involvement.
Figure 4
Figure 4
Pie chart representation of the distribution of identified proteins in TCs (cell culture, 5th day) according to their protein class (A), pathways (B) and cellular components (C) classifications.
Figure 5
Figure 5
Pie chart representation of the distribution of identified proteins in FBs (cell culture, 5th day) according to their molecular functions. Categorizations were based on information provided by the online resource PANTHER classification system.
Figure 6
Figure 6
Pie chart representation of the distribution of identified proteins in FBs (cell culture, 5th day) according to their biological processes (A), cellular processes (B), developmental processes (C) and system development (D) involvement.
Figure 7
Figure 7
Pie chart representation of the distribution of identified proteins in FBs (cell culture, 5th day) according to their protein class (A), pathways (B) and cellular components (C) classifications.
Figure 8
Figure 8
Heat map depicting significance results between TCs and FBs (cell culture, 5th day). Experimental samples are clustered on the horizontal axis and protein spots on the vertical axis. Red indicates increased and green decreased expression ratio, while black squares indicate no change in protein abundance. The colour gradient indicates the magnitude of fold change.
Figure 9
Figure 9
Pie chart representation of the distribution of identified proteins in TCs (cell culture, 10th day) according to their molecular functions. Categorizations were based on information provided by the online resource PANTHER classification system.
Figure 10
Figure 10
Pie chart representation of the distribution of identified proteins in TCs (cell culture, 10th day) according to their biological processes (A), cellular processes (B), developmental processes (C) and system development (D) involvement.
Figure 11
Figure 11
Pie chart representation of the distribution of identified proteins in TCs (cell culture, 10th day) according to their protein class (A), pathways (B, and cellular components (C) classifications.
Figure 12
Figure 12
Pie chart representation of the distribution of identified proteins in FBs (cell culture, 10th day) according to their molecular functions. Categorizations were based on information provided by the online resource PANTHER classification system.
Figure 13
Figure 13
Pie chart representation of the distribution of identified proteins in FBs (cell culture, 10th day) according to their biological processes (A), cellular processes (B), developmental processes (C) and system development (D) involvement.
Figure 14
Figure 14
Pie chart representation of the distribution of identified proteins in FBs (cell culture, 10th day) according to their protein class (A), pathways (B) and cellular components (C) classifications.
Figure 15
Figure 15
Heat map depicting significance results between TCs and FBs (cell culture, 10th day). Experimental samples are clustered on the horizontal axis and protein spots on the vertical axis. Red indicates increased and green decreased expression ratio, while black squares indicate no change in protein abundance. The colour gradient indicates the magnitude of fold change.
Figure 16
Figure 16
(–B) Radars of differential protein expression at 5th day in cell culture for top proteins of TCs (A) and FBs (B). For display purposes, high values of fold change was limited to 10 in A and to 5 in B, respectively. For proteins with fold change greater than 2, the corresponding fold change value was taken into account, even if lower than 2.
Figure 17
Figure 17
(A, B) Radars of differential protein expression at 10th day in cell culture for top proteins of TCs (A) and FBs (B). For display purposes, high values of fold change was limited to 10 in A and to 5 in B respectively. For proteins with fold change greater than 2, the corresponding fold change value was taken into account, even if lower than 2.

References

    1. Popescu LM, Faussone-Pellegrini MS. TELOCYTES - a case of serendipity: the winding way from Interstitial Cells of Cajal (ICC), via Interstitial Cajal-Like Cells (ICLC) to TELOCYTES. J Cell Mol Med. 2010;14:729–40. - PMC - PubMed
    1. Popescu LM, Manole CG, Gherghiceanu M, et al. Telocytes in human epicardium. J Cell Mol Med. 2010;14:2085–93. - PMC - PubMed
    1. Suciu L, Popescu LM, Gherghiceanu M, et al. Telocytes in human term placenta: morphology and phenotype. Cells Tissues Organs. 2010;192:325–39. - PubMed
    1. Hinescu ME, Gherghiceanu M, Suciu L, et al. Telocytes in pleura: two- and three-dimensional imaging by transmission electron microscopy. Cell Tissue Res. 2011;343:389–97. - PMC - PubMed
    1. Manole CG, Cismasiu V, Gherghiceanu M, et al. Experimental acute myocardial infarction: telocytes involvement in neo-angiogenesis. J Cell Mol Med. 2011;15:2284–96. - PMC - PubMed

Publication types

LinkOut - more resources