

Creb coactivators direct anabolic responses and enhance performance of skeletal muscle
- PMID: 24674967
- PMCID: PMC4193935
- DOI: 10.1002/embj.201386145
Creb coactivators direct anabolic responses and enhance performance of skeletal muscle
Abstract
During the stress response to intense exercise, the sympathetic nervous system (SNS) induces rapid catabolism of energy reserves through the release of catecholamines and subsequent activation of protein kinase A (PKA). Paradoxically, chronic administration of sympathomimetic drugs (β-agonists) leads to anabolic adaptations in skeletal muscle, suggesting that sympathetic outflow also regulates myofiber remodeling. Here, we show that β-agonists or catecholamines released during intense exercise induce Creb-mediated transcriptional programs through activation of its obligate coactivators Crtc2 and Crtc3. In contrast to the catabolic activity normally associated with SNS function, activation of the Crtc/Creb transcriptional complex by conditional overexpression of Crtc2 in the skeletal muscle of transgenic mice fostered an anabolic state of energy and protein balance. Crtc2-overexpressing mice have increased myofiber cross-sectional area, greater intramuscular triglycerides and glycogen content. Moreover, maximal exercise capacity was enhanced after induction of Crtc2 expression in transgenic mice. Collectively these findings demonstrate that the SNS-adrenergic signaling cascade coordinates a transient catabolic stress response during high-intensity exercise, which is followed by transcriptional reprogramming that directs anabolic changes for recovery and that augments subsequent exercise performance.
Figures

Effect of β-agonist on Crtc2 and Crtc3 subcellular localization. Immunoblots of Crtc2, Crtc3, phospho-Creb/Atf1, total Creb or tubulin from cytoplasmic and nuclear extracts of cultured primary myotubes treated with 100 nM isoproterenol (Iso) for 0, 15, 30, 45 or 60 min.
Immunofluorescence of endogenous Crtc2 (green) and nuclear staining with DAPI (DNA, blue) in murine C2C12 myotubes treated with vehicle (DMSO) or 100 nM Iso for 15 min. Scale bar, 20 μm.
Transient transfection assays in primary mouse myocytes with a CRE-luciferase reporter gene and an expression vector for Crtc2, Crtc3 alone or with A-Creb. Myocytes were also stimulated with isoproterenol, clenbuterol (clen) or DMSO for 4 h prior to luciferase assay as indicated. Propranolol was incubated 30 min prior to stimulation, each bar is the mean ± s.e.m. of 4 wells.
Relative fold induction of Nr4a1, Nr4a3, Irs2 and Sik1 RNA transcripts by rtPCR from primary myocytes treated with DMSO, 100 nM isoproterenol (Iso), transduced with control adenovirus or virus expressing either Crct2 or Crtc3. Values were normalized to Rpl-23. Each bar is the mean ± s.e.m. of 4 wells.

Levels of norepinephrine and epinephrine from plasma or in quadriceps muscle normalized to total protein from mice either at rest or 30 min post-exercise. Each bar is mean ± s.e.m., n = 4 male mice at 8 weeks of age. P-value calculated by a two-tailed unpaired t-test.
Levels of cAMP in quadriceps muscle. Values were normalized to total protein in the indicated animals rested or 30 min post-exercise. Each bar is mean ± s.e.m., n = 4 male mice at 8 weeks of age. P-value calculated by a two-tailed unpaired t-test.
Immunoblots showing levels of phospho-Creb/Atf1, Creb, Crtc2, Crtc3 and tubulin from animal rested or 30 min post-exercise.
Fold induction of Pgc-1α, Nr4a1 and Nr4a3 transcripts in quadriceps muscle from the indicated animals after 30 min of intense exercise. Transcript levels were measured by qRT-PCR, and values were normalized to Rpl-23 mRNA and expressed relative to those present in resting control animals; each bar is mean ± s.e.m. n = 4 male mice at 8 weeks of age. P-values calculated by a two-tailed unpaired t-test.
Crtc3 overrides the suppression of gene expression by the adrenergic antagonist propranolol in exercised animals. Fold induction of Pgc-1α and Sik1 mRNAs was determined by qRT-PCR from the tibialis anterior (TA) muscle. Crtc3 expression was induced by electroporation of the Crtc3 plasmid into the tibialis anterior muscle. Propranolol or saline were injected i.p. 30 min before exercise. Values were normalized to levels of Rpl-23 transcripts and are expressed relative to those in control (saline/resting) TA muscle; each bar is the mean ± s.e.m. of 4 mice. One-way ANOVA was conducted and P-values were calculated with Tukey's post hoc test and are represented by *P < 0.05, **P < 0.01 and ***P < 0.001 versus saline.

Fold induction of Nr4a1 and Nr4a3 RNA transcripts, quantified by qRT-PCR, in primary myotubes treated with 40 mM KCl, isoproterenol (Iso), Iso plus KCl or vehicle (DMSO) for 45 min. Values were normalized to those of Rpl-23 mRNA and were expressed relative to DMSO control; each bar is the mean ± s.e.m. of 4 wells. One-way ANOVA was conducted and P-values were calculated with Tukey's post hoc test and are represented by ***P < 0.001 versus vehicle (DMSO).
Fold induction of Nr4a1 and Nr4a3 transcripts, quantified by qRT-PCR, in primary myotubes treated with 40 mM KCl plus Iso for 45 min, and in myotubes transduced with adenovirus expressing GFP, Crtc2 or Crtc3 for 24 h. One-way ANOVA was conducted, and P-values were calculated with Tukey's post hoc test and are represented by **P < 0.01 and ***P < 0.001 versus Ad-Control.
Immunoblot analyses of levels of phospho-Creb, total Creb, Crtc2, Crtc3 and tubulin in total lysates of primary myotubes stimulated for 0, 15, 30, 60, 90 or 120 min with either 100 nM Isoproterenol or isoproterenol and 40 mM KCl.
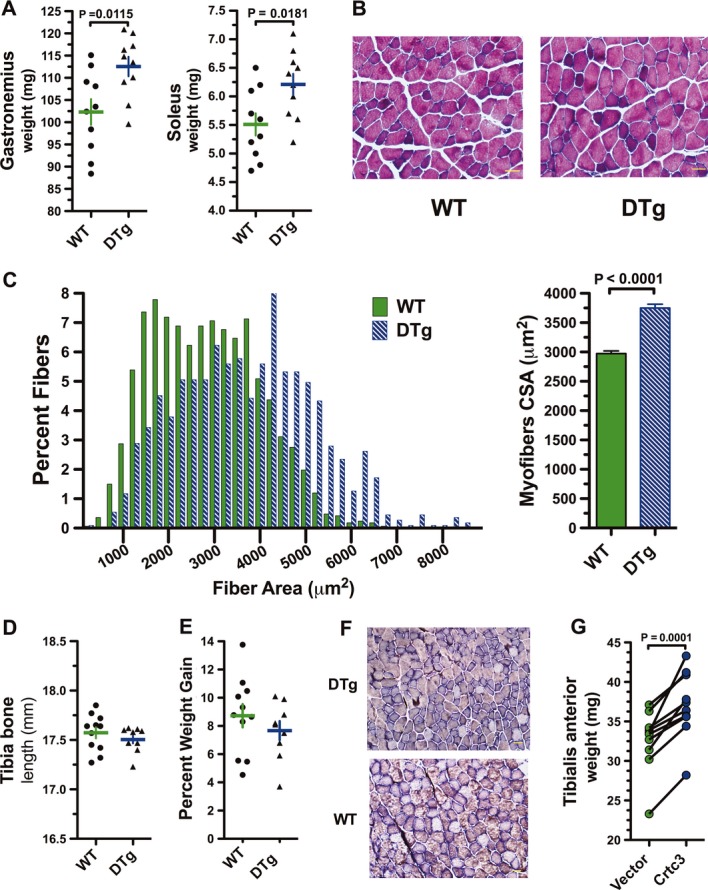
Gastrocnemius and soleus muscle weight in wild-type (WT) and double transgenic (DTg) mice 36 days post-Dox administration. Data are represented as a scatter plot with the mean ± s.e.m. indicated, n = 10 mice. P-values calculated by a two-tailed unpaired t-test.
Histological analysis of myofibers from gastrocnemius muscle sections with hematoxylin and eosin (H & E) staining. Scale bar: 100 μm.
Distribution of cross-sectional areas (CSAs) of WT and DTg mice after Dox (left panel) and mean CSAs of muscle fibers (right panel). Data are represented as mean ± s.e.m. P-values calculated by a two-tailed unpaired t-test.
Tibia bone length of WT and DTg mice after dox. Data are represented as a scatter plot with the mean ± s.e.m. indicated, n = 10 per group.
Percent weight gain of WT and DTg mice after Dox. Data are represented as a scatter plot with the mean ± s.e.m. indicated, n = 10 per group.
Histological analysis of myofibers from gastrocnemius muscle sections by myosin ATPase staining. Scale bar: 500 μm.
Wet weight of TA muscles after 10 days of Crtc3 expression. The muscle was electroporated with either empty vector or with a Crtc3 expression plasmid. Each line represent the difference in mass relative to the contralateral muscle of each animal, n = 10 per group. P-values calculated by a two-tailed paired t-test.

Fluorescence microscopy of primary myotubes transduced with adenovirus expressing GFP alone (Ad-Control) or Crtc2 and GFP (Ad-Crtc2).
Immunoblots of MHC and tubulin from primary myotubes transduced with adenovirus expressing GFP alone (Ad-Control) or Crtc2 and GFP (Ad-Crtc2).
Total protein and DNA were isolated and quantified from control, Crtc2- or Crtc3-expressing myotubes and expressed as total protein divided by DNA. Data are represented as mean ± s.e.m. (n = 4 wells per group). One-way ANOVA was conducted and P-values were calculated with Tukey's post hoc test and are represented by **P < 0.01 versus Ad Control.
Relative fold induction of Sik1 RNA transcripts by rtPCR from primary myocytes transduced with control adenovirus or adenovirus expressing Crct2 or Crtc3. Values were normalized to Rpl-23 mRNA. Each bar is the mean ± s.e.m. of 4 wells. One-way ANOVA was conducted and P-values were calculated with Tukey's post hoc test and are represented by ***P < 0.001 versus Ad Control.
Immunoblots of phospho-HDAC4, phospho-HDAC 5/7 or tubulin from extracts of primary myotubes transduced with control adenovirus or adenovirus expressing Crtc2.
Immunoblots of phospho-HDAC4, phospho-HDAC 5/7 or tubulin from extracts of gastrocnemius muscle isolated from double transgenic mice after 0, 3 or 7 days of Dox administration.
Immunoblots of phospho-HDAC4, phospho-HDAC 5/7, total HDAC 4, total HDAC5, Murf1, myogenin, Creb or tubulin from nuclear (left) and cytoplasmic (right) extracts of primary myotubes transduced with control adenovirus or adenovirus expressing Crtc3. Sample replicates for Ad control and Ad Crtc3 are shown.

Relative fold induction of Pgc1-α4 transcripts by qRT-PCR from primary myocytes transduced with control adenovirus or adenovirus expressing Crct2 or Crtc3. Values were normalized to Rpl-23 mRNA. Each bar is the mean ± s.e.m. of 4 wells. One-way ANOVA was conducted and P-values were calculated with Tukey's post hoc test and are represented **P < 0.01 versus Ad Control.
Transient transfection assays in myocytes with a −51 to +500 Pgc1α proximal or distal promoter-luciferase reporter genes. Myocytes were also stimulated with isoproterenol or DMSO vehicle control for 4 h prior to luciferase assay as indicated. Each bar is the mean fold induction ± s.e.m. of three experiments. One-way ANOVA was conducted and P-values were calculated with Tukey's post hoc test and are represented by *P < 0.05, **P < 0.01 and ***P < 0.001 versus Iso.
Chromatin immunoprecipitation (ChIP) of the Pgc-1α distal, Pgc-1α proximal and Gapdh promoters with anti-Creb, anti-Phospho-Creb, anti-Crtc2 or anti-Crtc3 in isoproterenol stimulated mouse myotubes. Myotubes were stimulated with isoproterenol prior to ChIP as indicated. Pre-immunoprecipitation (Pre-IP) control DNA (left) and no antibody control (right).
Relative fold induction of Pgc1-α4, Pdpk1, Akt1 and Igf1 transcripts by qRT-PCR from gastrocnemius muscle isolated from double transgenic mice or wild-type mice after 7 days of Dox administration. Values were normalized to Rpl-23 mRNA. Each bar is the mean ± s.e.m. of 4 wells, of two animals. One-way ANOVA was conducted and P-values were calculated with Tukey's post hoc test and are represented by *P < 0.05, **P < 0.01 and ***P < 0.001 versus Ad Control.
Relative fold induction of Pdpk1, Akt1 and Igf1 RNA transcripts by qRT-PCR from primary myocytes transduced with adenovirus control or adenovirus expressing Crct2 or Crtc3. Values were normalized to Rpl-23 mRNA. Each bar is the mean ± s.e.m. of 4 wells.
Immunoblots of Pdpk1, Akt1 and tubulin from primary myotubes expressing Crtc2 or Crtc3.
Immunoblots of phospho-Ser 308 of AKT1/2 and tubulin from myocytes expressing Crtc2 or Crtc3.
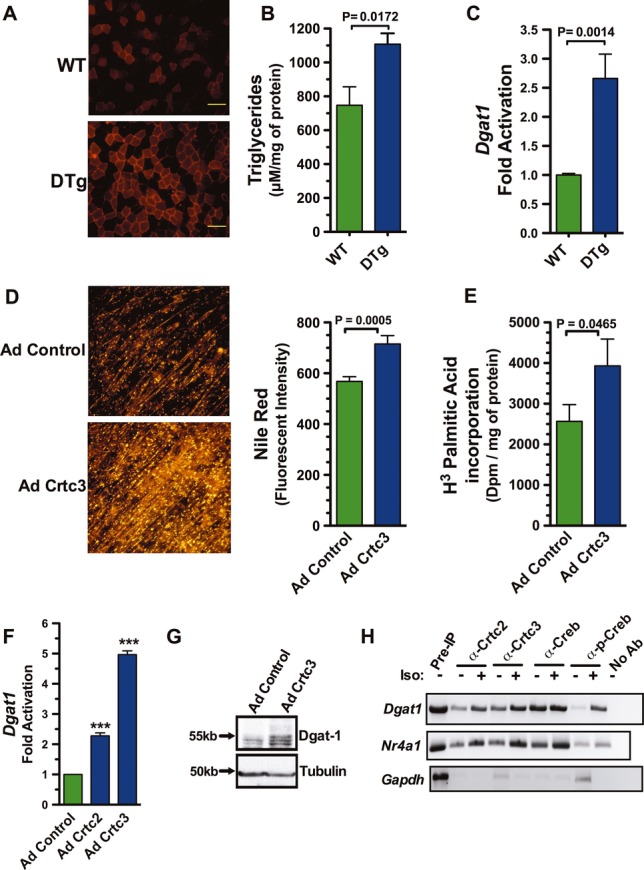
Histological analysis of neutral lipids with Nile Red in muscle sections of WT and DTg mice after Dox treatment. Scale bar: 100 μm.
Triglyceride levels in gastrocnemius muscle of WT and DTg mice after dox. Data are represented as a scatter plot with the mean ± s.e.m. indicated, n = 6 per group. P-value calculated by a two-tailed unpaired t-test.
Relative fold induction of Dgat1 mRNA by qRT-PCR from gastrocnemius muscle isolated from double-transgenic or WT mice after 7 days of Dox treatment. Values were normalized to Rpl-23. Each bar is the mean ± s.e.m. of 4 wells, of two animals. P-value calculated by a two-tailed unpaired t-test.
Neutral lipids visualized in primary myotubes expressing Crct3 by Nile Red (left) and quantified by fluorescent intensity (right). Each bar is the mean ± s.e.m. of 4 wells. P-value calculated by a two-tailed unpaired t-test.
Incorporation of 3H- palmitatic acid in primary myotubes expressing Crct3. Each bar is the mean ± s.e.m. of 4 wells. P-value calculated by a two-tailed unpaired t-test.
Relative fold induction of Dgat1 mRNA, quantified by qRT-PCR analyses of primary skeletal myocytes transduced with adenovirus expressing Crtc2 or Crct3 versus myocytes transduced with control adenovirus. Values were normalized to levels of Rpl-23 transcripts. One-way ANOVA was conducted and P-values were calculated with Tukey's post hoc test and are represented by ***P < 0.001 versus Ad Control.
Immunoblots of Dgat1 and tubulin proteins in myotubes expressing Crtc3.
Chromatin immunoprecipitation (ChIP) of the Dgat1, Nr4a1 and Gapdh promoters using anti-Creb, anti-Phospho-Creb, anti-Crtc2 or anti-Crtc3. Myotubes were stimulated with isoproterenol (+) or DMSO (−) for 45 min prior to ChIP. Pre-immunoprecipitation (Pre-IP) control DNA (left) and no antibody control (right).

Percentage of glycogen depleted in quadriceps muscle of mice post-exercise. Glycogen levels were normalized to total protein for each mouse at rest or 30 min after exercise. Each bar is the mean ± s.e.m. of n = 4 male mice at 8 weeks of age. P-value calculated by a two-tailed unpaired t-test.
Glycogen levels in the gastrocnemius muscle of WT and DTg mice after Dox treatment. Each bar is the mean ± s.e.m. of glycogen normalized to total protein of 8 animals. P-value calculated by a two-tailed unpaired t-test.
Glycogen levels in primary myocytes after treatment with clenbuterol or vehicle (DMSO) for 30 min. Each bar is the mean glycogen ± s.e.m. of 4 wells normalized to total protein. P-value calculated by a two-tailed unpaired t-test.
Glycogen levels in primary myocytes transduced with adenovirus expressing Crtc2, Crtc3 or GFP control for 48 h and then stimulated with clenbuterol for 30 min. Each bar is the mean glycogen ± s.e.m. of 4 wells normalized to total protein. P-value calculated by a two-tailed unpaired t-test.
Percentage of glycogen depleted in quadriceps muscle of Crtc2-expressing mice post-exercise. Glycogen levels were quantitated and normalized to total protein during rest or immediately after exercise or 60 min post-exercise. Each bar is the mean ± s.e.m. of n = 3 male mice at 10–12 weeks of age. One-way ANOVA was conducted and P-values were calculated with Tukey's post hoc test and are represented by ***P < 0.001 versus Rest control.

Exercise protocol for evaluating within-animal performance. Exercise capacity was assessed by determining the maximal speed achieved when the speed increased by 2 m/min every 2 min until exhaustion.
Maximal exercise capacity before and after Dox administration. Maximal exercise capacity was determined by averaging the maximum speed achieved in three independent trails of an exercise stress test before and after Dox treatment for 2 weeks. Each symbol is the mean percent increase in the speed for each mouse, n = 5 mice per experimental group. P-values calculated by a two-tailed paired t-test.
Blood lactate concentration in response to exercise before and after Dox administration. Each symbol is the mean blood lactate concentration of each experimental group, n = 5 mice per group. P-values calculated by a two-tailed paired t-test.
References
-
- Agbenyega ET, Wareham AC. Effect of clenbuterol on normal and denervated muscle growth and contractility. Muscle Nerve. 1990;13:199–203. - PubMed
-
- Akimoto T, Pohnert SC, Li P, Zhang M, Gumbs C, Rosenberg PB, Williams RS, Yan Z. Exercise stimulates Pgc-1alpha transcription in skeletal muscle through activation of the p38 MAPK pathway. J Biol Chem. 2005;280:19587–19593. - PubMed
-
- d'Albis A, Couteaux R, Janmot C, Mira JC. Myosin isoform transitions in regeneration of fast and slow muscles during postnatal development of the rat. Dev Biol. 1989;135:320–325. - PubMed
Publication types
MeSH terms
Substances
Grants and funding
LinkOut - more resources
Full Text Sources
Other Literature Sources
Molecular Biology Databases
Research Materials
Miscellaneous
