. 2014 Mar 27;10(3):e1004033.
doi: 10.1371/journal.ppat.1004033. eCollection 2014 Mar.

An immunomics approach to schistosome antigen discovery: antibody signatures of naturally resistant and chronically infected individuals from endemic areas

Affiliations

An immunomics approach to schistosome antigen discovery: antibody signatures of naturally resistant and chronically infected individuals from endemic areas

Soraya Gaze et al. PLoS Pathog. .

Abstract

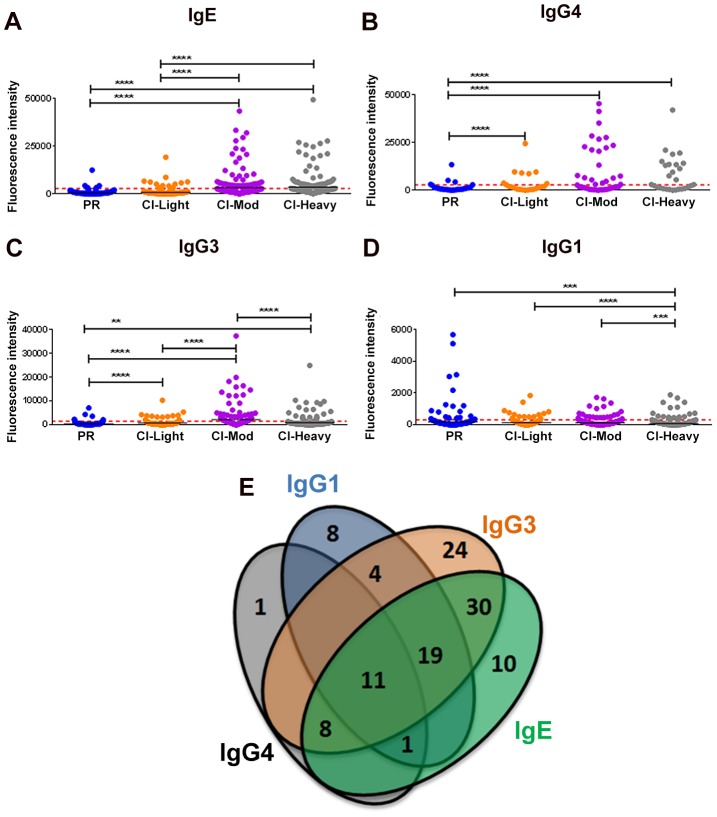
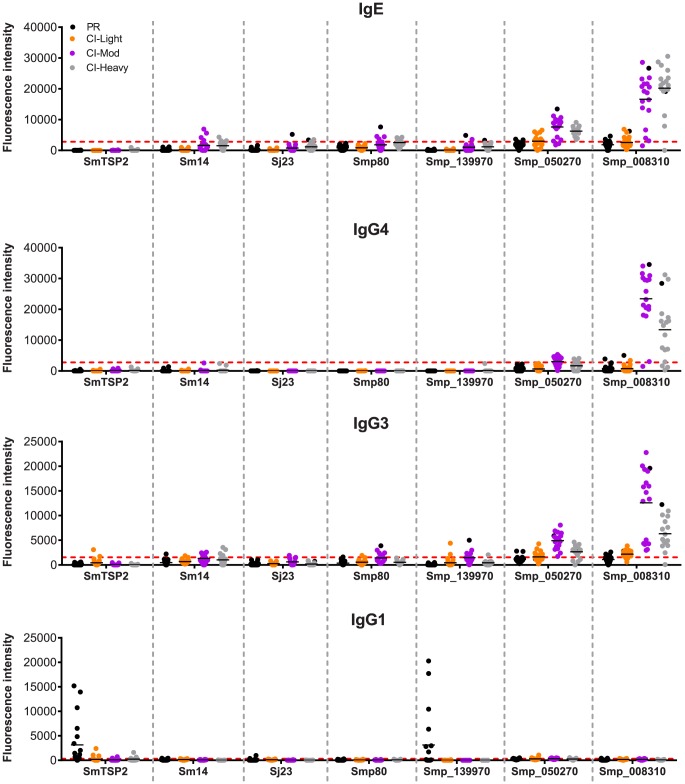
Schistosomiasis is a neglected tropical disease that is responsible for almost 300,000 deaths annually. Mass drug administration (MDA) is used worldwide for the control of schistosomiasis, but chemotherapy fails to prevent reinfection with schistosomes, so MDA alone is not sufficient to eliminate the disease, and a prophylactic vaccine is required. Herein, we take advantage of recent advances in systems biology and longitudinal studies in schistosomiasis endemic areas in Brazil to pilot an immunomics approach to the discovery of schistosomiasis vaccine antigens. We selected mostly surface-derived proteins, produced them using an in vitro rapid translation system and then printed them to generate the first protein microarray for a multi-cellular pathogen. Using well-established Brazilian cohorts of putatively resistant (PR) and chronically infected (CI) individuals stratified by the intensity of their S. mansoni infection, we probed arrays for IgG subclass and IgE responses to these antigens to detect antibody signatures that were reflective of protective vs. non-protective immune responses. Moreover, probing for IgE responses allowed us to identify antigens that might induce potentially deleterious hypersensitivity responses if used as subunit vaccines in endemic populations. Using multi-dimensional cluster analysis we showed that PR individuals mounted a distinct and robust IgG1 response to a small set of newly discovered and well-characterized surface (tegument) antigens in contrast to CI individuals who mounted strong IgE and IgG4 responses to many antigens. Herein, we show the utility of a vaccinomics approach that profiles antibody responses of resistant individuals in a high-throughput multiplex approach for the identification of several potentially protective and safe schistosomiasis vaccine antigens.


Conflict of interest statement

The authors have declared that no competing interests exist.

Figures

Figure 1
Figure 1. Isotype and subclass-specific antibody recognition profiles of PR and CI individuals to schistosome antigens printed on the proteome microarray.
The average adjusted signal intensity for IgE (A), IgG4 (B), IgG3 (C) and IgG1 (D) antibody responses of individual protein microarray features Cohorts of individuals that are putatively resistant (PR) to S. mansoni infection, or have low (CI-Light), moderate (CI-Mod) and heavy (CI-Heavy) intensity infections (based on eggs per gram of feces) were graphed. Red lines denote the cut-offs for each antibody isotype/subclass calculated by determining the average of the signal intensity for control spots on the microarray that contained no DNA (No DNA controls). Statistical analysis was performed using one-way ANOVA with Dunn's multiple comparisons test. *p<0.05; **p<0.01, ***p<0.001, ****p<0.0001. Venn diagrams (E) representing the combined data of Figures 1A-D. Values in the diagram show the protein microarray features recognized by each isotype/subclass.
Figure 2
Figure 2. IgE reactivity profiles of resistant and susceptible human cohorts to Schistosoma proteins printed on a proteome microarray.
Heatmap showing IgE responses of individual subjects (columns) in each cohort to 79 recombinant antigens (rows) printed on the microarray. Green represents no immunoreactivity through to red symbolizing strong immunoreactivity. The bar graph depicts the average signal intensity of each cohort. Proteins are ordered based on SI mean, highest to lowest, in the groups. Human cohorts represented: Putative Resistant (n = 20), CI-Light (n = 30), CI-Mod (n = 18) and CI-Heavy (n = 17) non-endemic Brazilian volunteers (n = 12), non-endemic North American volunteers (n = 12). The red line is the cut-off for reactivity, calculated as one standard deviation of the mean of the no-DNA control spots printed on the array and probed with anti-IgE. All of the proteins showed significant differences between at least two of the schistosome exposed groups (PR, CI-Light, CI-Mod and CI-Heavy) as calculated by Kruskal-Wallis test with Dunn's multiple comparison post-test (Table S4).
Figure 3
Figure 3. IgG4 reactivity profiles of resistant and susceptible human cohorts to Schistosoma proteins printed on a proteome microarray.
Heatmap showing IgG4 responses of individual subjects (columns) in each cohort to 23 recombinant antigens (rows) printed on the microarray. Green represents no immunoreactivity through to red symbolizing strong immunoreactivity. The bar graph depicts the average signal intensity for each cohort. Proteins are ordered based on SI mean, highest to lowest, in the groups. Human cohorts represented: Putative Resistant (n = 20), CI-Light (n = 30), CI-Mod (n = 18) and CI-Heavy (n = 17) non-endemic Brazilian (n = 12) and non-endemic North Americans (n = 12). The red line is the cut-off for reactivity, calculated as one standard deviation of the mean of the no-DNA control spots printed on the array and probed with anti-IgG4. NS represents no significant differences between endemic groups calculated by Kruskall Wallis with Dunn's multiple comparison test. All other proteins showed significant differences between at least two of the schistosome exposed groups (PR, CI-Light, CI-Mod and CI-Heavy) (Table S4).
Figure 4
Figure 4. IgG3 reactivity profiles of resistant and susceptible human cohorts to Schistosoma proteins printed on a proteome microarray.
Heatmap showing IgG3 responses of individual subjects (columns) in each cohort to 98 recombinant antigens (rows) printed on the microarray. Green represents no immunoreactivity through to red symbolizing strong immunoreactivity. The bar graph depicts the average signal intensity with mean standard deviation of each cohort. Proteins are ordered based on SI mean, highest to lowest, in the groups. Human cohorts represented: Putative Resistant (n = 20), CI-Light (n = 29), CI-Mod (n = 17) and CI-Heavy (n = 17). non-endemic Brazilian (n = 10), non-endemic North Americans (n = 12). The red line is the cut-off for reactivity, calculated as one standard deviation of the mean of the no-DNA control spots printed on the array and probed with anti-IgG3. NS represents no significant differences between endemic groups calculated by Kruskall Wallis with Dunn's multiple comparison test. All other proteins showed significant differences between at least two of the schistosome exposed groups (PR, CI-Light, CI-Mod and CI-Heavy) (Table S4).
Figure 5
Figure 5. IgG1 reactivity profiles of resistant and susceptible human cohorts to Schistosoma proteins printed on a proteome microarray.
Heatmap showing IgG1 responses of individual subjects (columns) in each cohort to 45 recombinant antigens (rows) printed on the microarray. Green represents no immunoreactivity through to red symbolizing strong immunoreactivity. The bar graph depicts the average signal intensity with mean standard deviation of each cohort. Proteins are ordered based on SI mean, highest to lowest, in the groups. Human cohorts represented: non-endemic Brazilian (n = 12), Putative Resistant (n = 20), CI-Light (n = 30), CI-Mod (n = 18) and CI-Heavy (n = 17). The red line is the cut-off for reactivity, calculated as one standard deviation of the mean of the no-DNA control spots printed on the array and probed with anti-IgG1. NS represents no significant differences between endemic groups calculated by Kruskall Wallis with Dunn's multiple comparison test. All other proteins showed significant differences between at least two of the exposed groups (PR, CI-Light, CI-Mod and CI-Heavy) (Table S4).
Figure 6
Figure 6. Immunoreactivity of Schistosoma proteins by multi-dimensional cluster analysis.
(A) Multi-dimensional clustered distribution of all proteins according to the antibody isotype/subclass responses in distinct cohorts. To identify clusters containing proteins with the same antibody reactivity profiles, a distance matrix estimated from the pairwise Euclidian distance of log transformed signal intensity (SI) was generated for each antigen based on the cut-off values for each antibody isotype/subclass in the different cohorts. Proteins formed 7 clusters, defined by the following colors: cluster 1 - black (4 proteins); cluster 2 – blue (11 proteins); cluster 3 – grey (5 proteins); cluster 4 – green (31 proteins); cluster 5 – magenta (47 proteins); cluster 6 – orange (11 proteins) and cluster 7 – red (106 proteins). (B) Two-dimensional depiction of the average signal intensity for each clustered interaction separated by antibody isotype/subclass and cohort. The dotted line represents the cut-off based on the no-DNA control spots. Proteins with signal intensity below the cut-off were set to zero to decrease background noise. Identities of proteins within clusters are provided in Tables S1 and S2 and Figure S5.
Figure 7
Figure 7. Immunoreactivity of current schistosomiasis vaccine antigens printed on the microarray.
Signal intensity values depicting isotype/subclass-specific antibody responses of individual subjects in each cohort to proteins corresponding to known schistosomiasis vaccine antigens and other select RTS proteins that were spotted on the microarray - Sm-TSP-2, Sm-14, Sj-23 and Smp80. Three new RTS antigens from S. mansoni were also included: Smp_139970, Smp_050270 and Smp_008310. Only groups from the schistosomiasis endemic area are represented: Putative Resistant (PR - blue), S. mansoni chronically infected with low (CI-Light – orange), moderate (CI-Mod - purple) and high (CI-Heavy - gray) intensity infections. The red line is the cut-off calculated as one standard deviation of the no-DNA control spots printed on the array and probed for each specific antibody isotype/subclass.

References

    1. van der Werf MJ, de Vlas SJ, Brooker S, Looman CWN, Nagelkerke NJD, et al. (2003) Quantification of clinical morbidity associated with schistosome infection in sub-Saharan Africa. Acta Trop 86: 125–139. - PubMed
    1. King CH, Dickman K, Tisch DJ (2005) Reassessment of the cost of chronic helmintic infection: a meta-analysis of disability-related outcomes in endemic schistosomiasis. Lancet 365: 1561–1569. - PubMed
    1. King CH, Dangerfield-Cha M (2008) The unacknowledged impact of chronic schistosomiasis. Chronic Illn 4: 65–79. - PubMed
    1. Steinmann P, Keiser J, Bos R, Tanner M, Utzinger J (2006) Schistosomiasis and water resources development: systematic review, meta-analysis, and estimates of people at risk. Lancet Infect Dis 6: 411–425. - PubMed
    1. Gray DJ, McManus DP, Li Y, Williams GM, Bergquist R, et al. (2010) Schistosomiasis elimination: lessons from the past guide the future. Lancet Infect Dis 10: 733–736. - PubMed

Publication types

MeSH terms