Randomized Controlled Trial
. 2014 Mar 28;343(6178):1478-85.
doi: 10.1126/science.1248429.

Early childhood investments substantially boost adult health

Affiliations
Randomized Controlled Trial

Early childhood investments substantially boost adult health

Frances Campbell et al. Science. .

Abstract

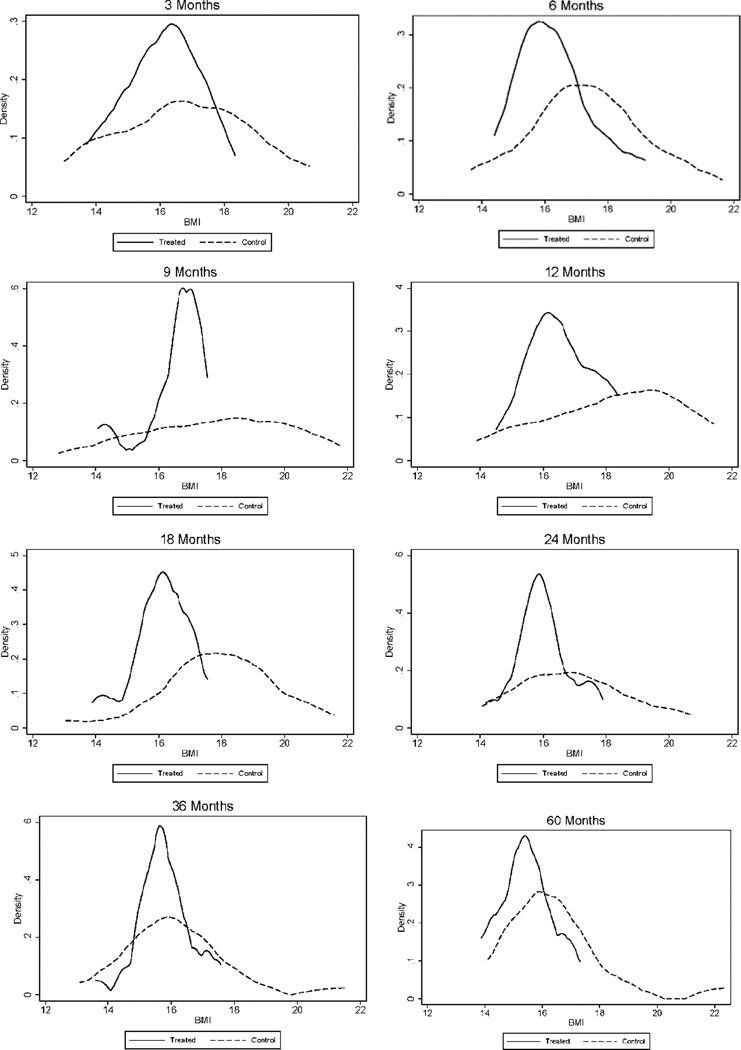
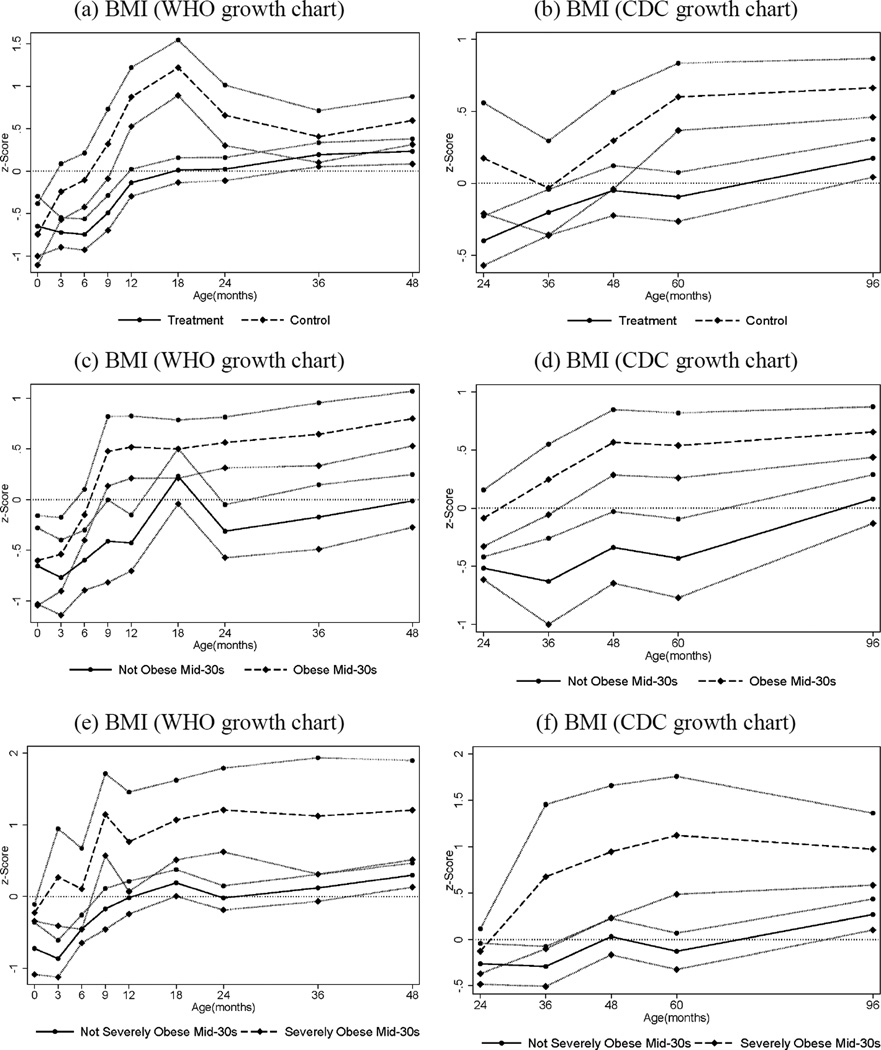
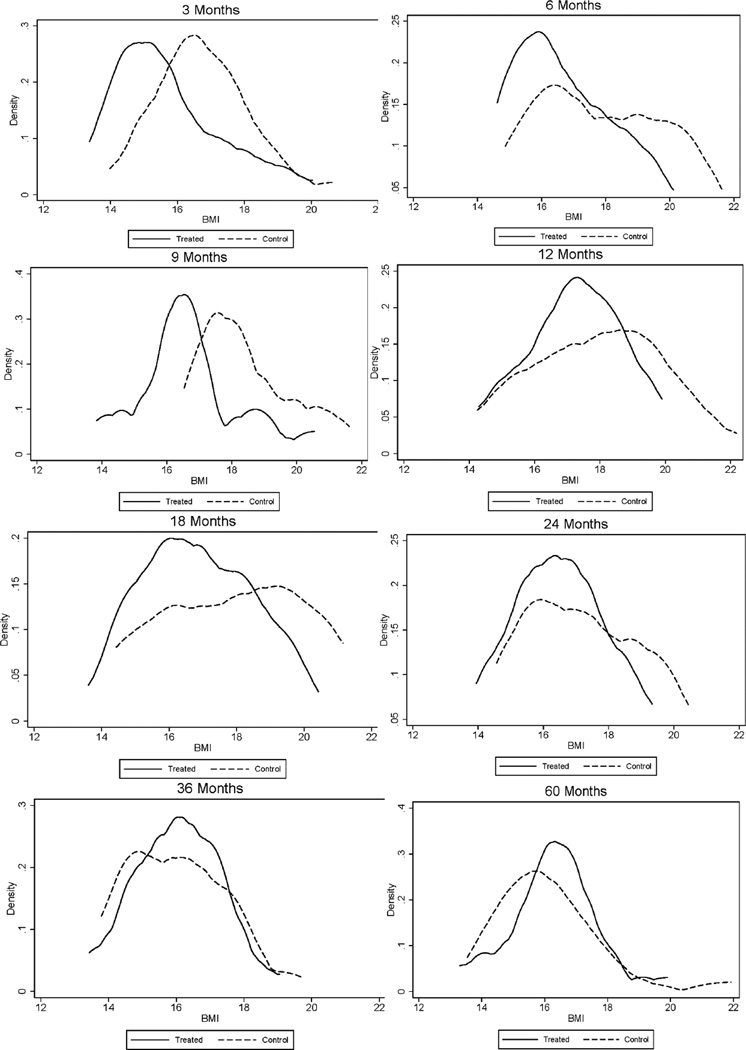
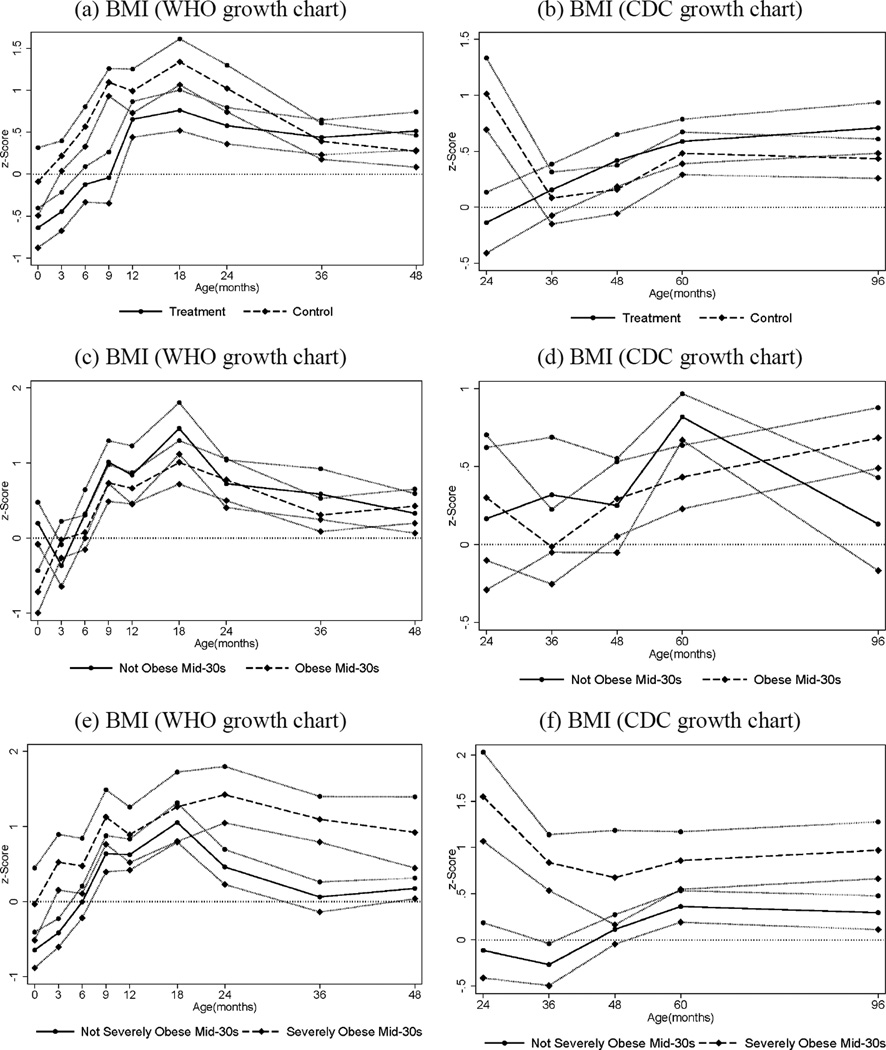
High-quality early childhood programs have been shown to have substantial benefits in reducing crime, raising earnings, and promoting education. Much less is known about their benefits for adult health. We report on the long-term health effects of one of the oldest and most heavily cited early childhood interventions with long-term follow-up evaluated by the method of randomization: the Carolina Abecedarian Project (ABC). Using recently collected biomedical data, we find that disadvantaged children randomly assigned to treatment have significantly lower prevalence of risk factors for cardiovascular and metabolic diseases in their mid-30s. The evidence is especially strong for males. The mean systolic blood pressure among the control males is 143 millimeters of mercury (mm Hg), whereas it is only 126 mm Hg among the treated. One in four males in the control group is affected by metabolic syndrome, whereas none in the treatment group are affected. To reach these conclusions, we address several statistical challenges. We use exact permutation tests to account for small sample sizes and conduct a parallel bootstrap confidence interval analysis to confirm the permutation analysis. We adjust inference to account for the multiple hypotheses tested and for nonrandom attrition. Our evidence shows the potential of early life interventions for preventing disease and promoting health.


Figures

Fig. 1
Fig. 1
Body Mass Index (BMI) ages 0–5 by Treatment Status, Males. The black solid line depicts the density for treated males; the black dashed line depicts the density for control males. The graphs display non-parametric kernel estimates of the probability density function based on the Epanechnikov kernel. The kernel K is K (u) = ¾ (1-u2)1[|u|≤1], where 1[·] is an indicator function.
Fig. 2
Fig. 2
Body Mass Index ages 0–4 (figures a, c, e) and 2–8 (figures b, d, f), by Treatment and Obesity Status at Mid-30s, Males. The graphs show BMI z -scores at different points in childhood (0, 3, 6, 9, 12, 18, 24, 36, 48, 60, and 96 months) by treatment and control status (panels a–b), by obesity status (BMI≥30) in adulthood (panels c–d), and by severe obesity status (BMI≥35) in adulthood (panels e–f). Solid and dashed lines represent mean BMI by age for different groups while the bands around each line represent standard errors for the corresponding means (one standard error above and below). Figures (a), (c) and (e) use the WHO (World Health Organization) growth charts to construct the z -scores; figures (b), (d) and (f) use the CDC (Center for Disease Control) growth charts. The CDC recommends the use of the WHO growth charts for less than 2 years of age (see www.cdc.gov/growthcharts/who_charts.htm).
Fig. 3
Fig. 3
Body Mass Index (BMI) ages 0–5 by Treatment Status, Females. The black solid line depicts the density for treated males; the black dashed line depicts the density for control males. The graphs display non-parametric kernel estimates of the probability density function based on the Epanechnikov kernel. The kernel K is K (u) = ¾ (1-u2)1[|u|≤1], where 1[·] is an indicator function.
Fig. 4
Fig. 4
Body Mass Index ages 0–4 (figures a, c, e) and 2–8 (figures b, d, f), by Treatment and Obesity Status at Mid-30s, Females. The graphs show BMI z -scores at different points in childhood (0, 3, 6, 9, 12, 18, 24, 36, 48, 60, and 96 months) by treatment and control status (panels a–b), by obesity status (BMI≥30) in adulthood (panels c–d), and by severe obesity status (BMI ≥35) in adulthood (panels e –f). Solid and dashed lines represent mean BMI by age for different groups while the bands around each line represent standard errors for the corresponding means (one standard error above and below). Figures (a), (c) and (e) use the WHO (World Health Organization) growth charts to construct the z -scores; figures (b), (d) and (f) use the CDC (Center for Disease Control) growth charts. The CDC recommends the use of the WHO growth charts for less than 2 years of age (see www.cdc.gov/growthcharts/who_charts.htm).

References

    1. Alwan A, Armstrong T, Bettcher D, Branca F, Chisholm D, Ezzati M, Garfield R, MacLean D, Mathers C, Mendis S, Poznyak V, Riley L, Tang KC, Wild C. Global status report on noncommunicable diseases 2010: Description of the global burden of NCDs, their risk factors and determinants. Geneva, Switzerland: World Health Organization; 2011.
    1. Emanuel E. Prevention and Cost Control. Science. 2012;337:1433–1433. - PubMed
    1. Cutler DM, Nikhil SR. If Slow Rate Of Health Care Spending Growth Persists, Projections May Be Off By $770 Billion. Health Affairs. 2013;32 - PubMed
    1. Antos JR, Pauly MV, Wilensky GR. Bending the Cost Curve through Market-Based Incentives. New England Journal of Medicine. 2012;367:954–958. - PubMed
    1. Ginsburg PB, Ichiseki H, Punwani N. Correspondence: Bending the Health Care Cost Curve. New England Journal of Medicine. 2012;367:2454–2456. - PubMed

Publication types