. 2014 Mar 27;9(3):e93229.
doi: 10.1371/journal.pone.0093229. eCollection 2014.

Quantitative stratification of diffuse parenchymal lung diseases

Affiliations

Quantitative stratification of diffuse parenchymal lung diseases

Sushravya Raghunath et al. PLoS One. .

Abstract

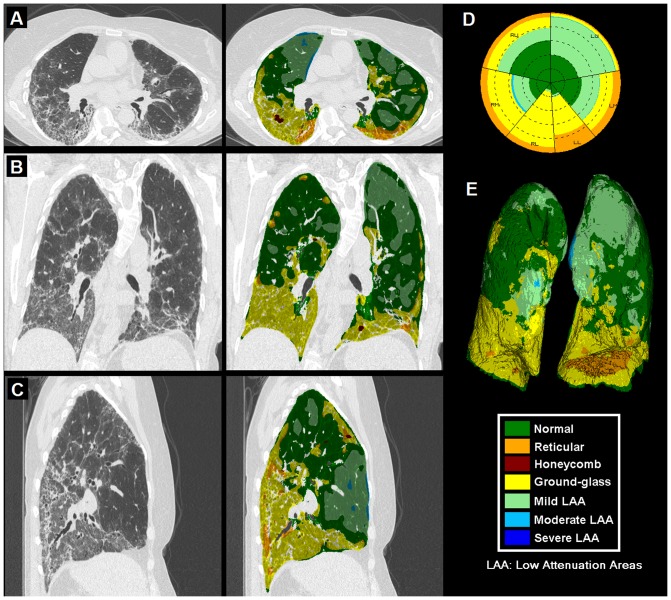
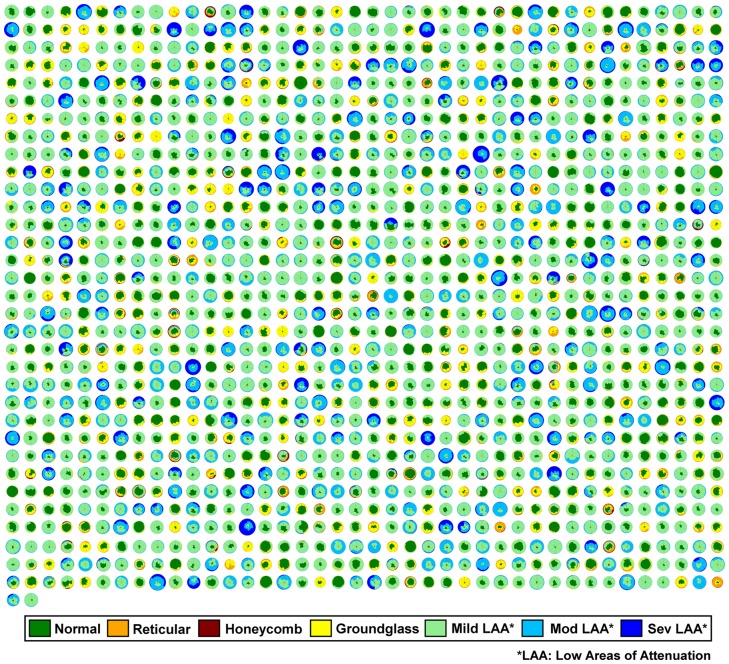
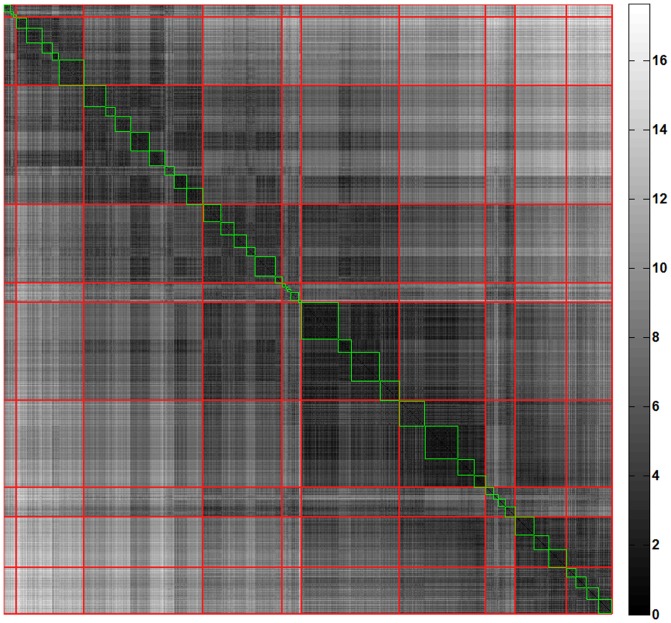
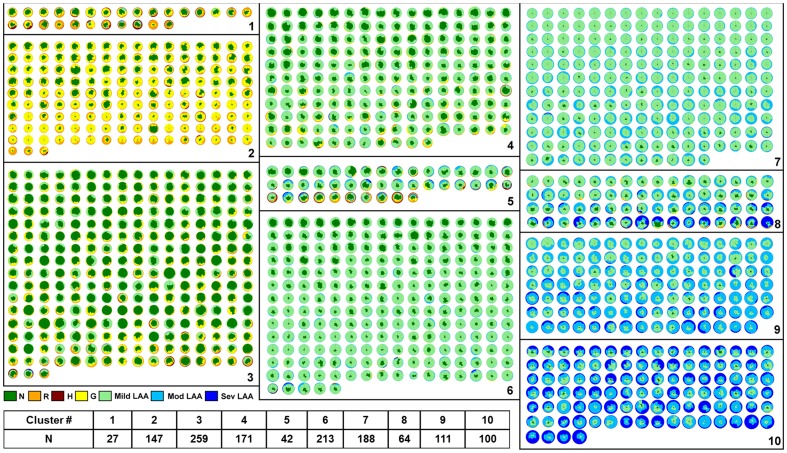
Diffuse parenchymal lung diseases (DPLDs) are characterized by widespread pathological changes within the pulmonary tissue that impair the elasticity and gas exchange properties of the lungs. Clinical-radiological diagnosis of these diseases remains challenging and their clinical course is characterized by variable disease progression. These challenges have hindered the introduction of robust objective biomarkers for patient-specific prediction based on specific phenotypes in clinical practice for patients with DPLD. Therefore, strategies facilitating individualized clinical management, staging and identification of specific phenotypes linked to clinical disease outcomes or therapeutic responses are urgently needed. A classification schema consistently reflecting the radiological, clinical (lung function and clinical outcomes) and pathological features of a disease represents a critical need in modern pulmonary medicine. Herein, we report a quantitative stratification paradigm to identify subsets of DPLD patients with characteristic radiologic patterns in an unsupervised manner and demonstrate significant correlation of these self-organized disease groups with clinically accepted surrogate endpoints. The proposed consistent and reproducible technique could potentially transform diagnostic staging, clinical management and prognostication of DPLD patients as well as facilitate patient selection for clinical trials beyond the ability of current radiological tools. In addition, the sequential quantitative stratification of the type and extent of parenchymal process may allow standardized and objective monitoring of disease, early assessment of treatment response and mortality prediction for DPLD patients.


Conflict of interest statement

Competing Interests: The authors have read the journal's policy and have the following conflicts: Srinivasan Rajagopalan, Brian J. Bartholmai, Ronald A. Karwoski and Richard A. Robb have a patent pending with the title: Systems and Methods for Analyzing in Vivo Tissue Volumes Using Medical Imaging Data, application number: PCT/US2012/036802 and filing date: May 7, 2012. This does not alter the authors' adherence to PLOS ONE policies on sharing data and materials.

Figures

Figure 1
Figure 1. Representative CT lung volume characterized into parenchymal patterns by Computer Aided Lung Informatics for Pathology Evaluation and Rating (CALIPER).
It illustrates colored overlay in axial (A), coronal (B) and sagittal (C) sections with glyph (D) and 3D rendering (E). The color key for the seven patterns is also shown.
Figure 2
Figure 2. 1322 LTRC patients represented as glyphs.
The classified parenchymal patterns are represented in the indicated colors. The radius of the glyphs is proportional to the lung volumes; the COPD cases with extensive low attenuation areas likely due to emphysema are visually larger than more normal or fibrotic cases with considerable regions of reticular or honeycombing.
Figure 3
Figure 3. The permuted dissimilarity matrix (1322×1322) representing the abnormality based pairwise dissimilarities (brighter the shade higher the dissimilarity).
The green blocks illustrate the first-pass clusters and the red diagonal blocks represent the final ten stratified clusters.
Figure 4
Figure 4. The ten stratified groups of 1322 patients represented as glyphs.
The groups were the result of quantitative unsupervised clustering based on dissimilarity metric that captures the distribution of classified parenchymal patterns.
Figure 5
Figure 5. The plot shows the mean population values of the semi-quantitative visual radiology scores (assigned by LTRC radiologist) for each parenchymal abnormality in each cluster.
The error bar is the standard error of mean of scores across the patients in the cluster.
Figure 6
Figure 6. The cluster-specific mean physiologic measures (FEV1/FVC ratio, percentage predicted values of DLCO, TLC, FEV1, and FVC) for the ten stratified groups.
The error bars indicate the standard errors of mean. The numbers within parenthesis in the horizontal axis represent the number of cluster-specific cases used in the mean, standard error computation. The post-ANOVA pairwise t-test for the indicated five variables is shown as the staircase diagram with green fill for significant differences after Bonferroni correction. At least one variable is statistically significant across the clusters except for between groups (1, 2) and (5, 8).
Figure 7
Figure 7. The correspondence of fibrotic and obstructive clusters with established indices and disease classification.
The Gender, Age and Physiology (GAP) based one-year mortality predictions for clusters 1, 2 and 3 in Figure 3 (A). The distribution of the old GOLD category (B) and new GOLD category (C) distribution across the obstructive clusters: 6, 7, 8, 9 and 10. The mean distribution of BODE indices across the obstructive clusters (D) and, the mean score distribution of SGRQ patient questionnaire scores of patients across all the clusters (E). The number of samples available in each cluster is noted in the horizontal axis. The error bars indicate the standard error of mean.

References

    1. Olson AL, Swigris JJ, Lezotte DC, Norris JM, Wilson CG, et al. (2007) Mortality from pulmonary fibrosis increased in the United States from 1992 to 2003. American Journal of Respiratory and Critical Care Medicine 176: 277–284. - PubMed
    1. Mannino DM, Buist AS (2007) Global burden of COPD: risk factors, prevalence, and future trends. Lancet 370: 765–773. - PubMed
    1. Raghu G, Collard HR, Egan JJ, Martinez FJ, Behr J, et al. (2011) An official ATS/ERS/JRS/ALAT statement: idiopathic pulmonary fibrosis: evidence-based guidelines for diagnosis and management. Am J Respir Crit Care Med 183: 788–824. - PMC - PubMed
    1. Travis WD, Costabel U, Hansell DM, King TE Jr, Lynch DA, et al. (2013) An official American Thoracic Society/European Respiratory Society statement: Update of the international multidisciplinary classification of the idiopathic interstitial pneumonias. Am J Respir Crit Care Med 188: 733–748. - PMC - PubMed
    1. Hansell DM (2013) Classification of diffuse lung diseases: why and how. Radiology 268: 628–640. - PubMed

Publication types

MeSH terms