. 2014 Jun;24(6):1039-50.
doi: 10.1101/gr.166983.113. Epub 2014 Mar 27.

Subtelomeric CTCF and cohesin binding site organization using improved subtelomere assemblies and a novel annotation pipeline

Affiliations

Subtelomeric CTCF and cohesin binding site organization using improved subtelomere assemblies and a novel annotation pipeline

Nicholas Stong et al. Genome Res. 2014 Jun.

Abstract

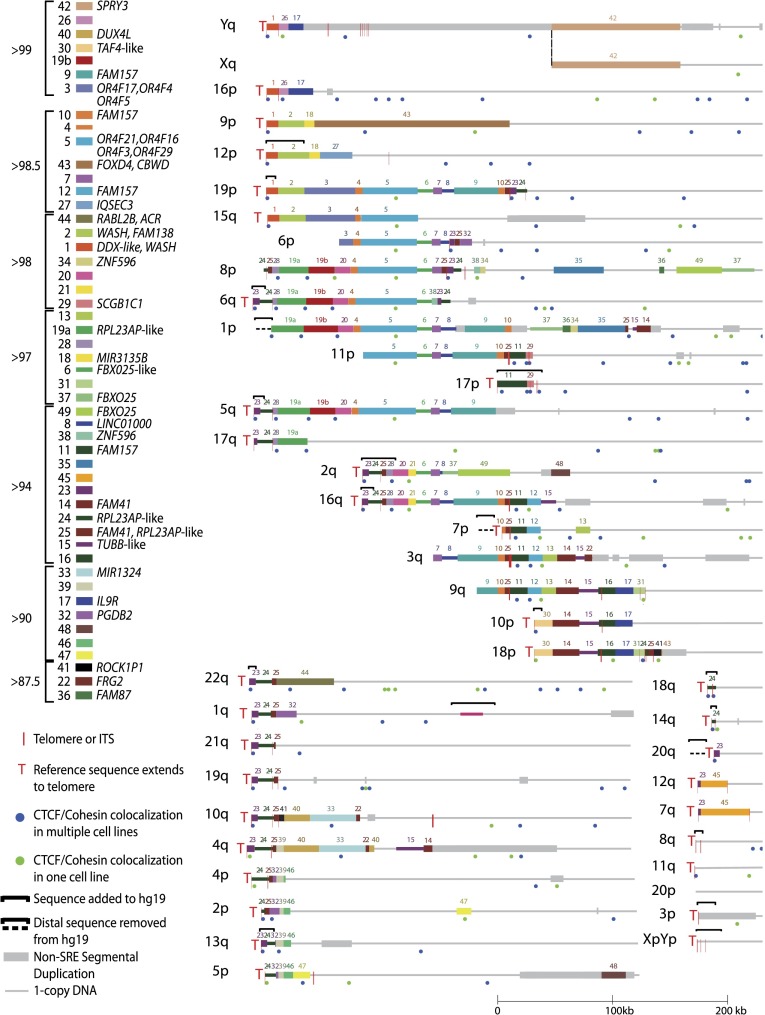
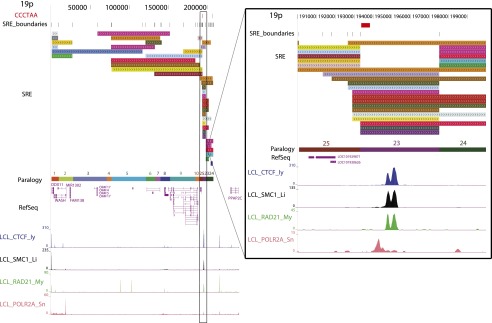
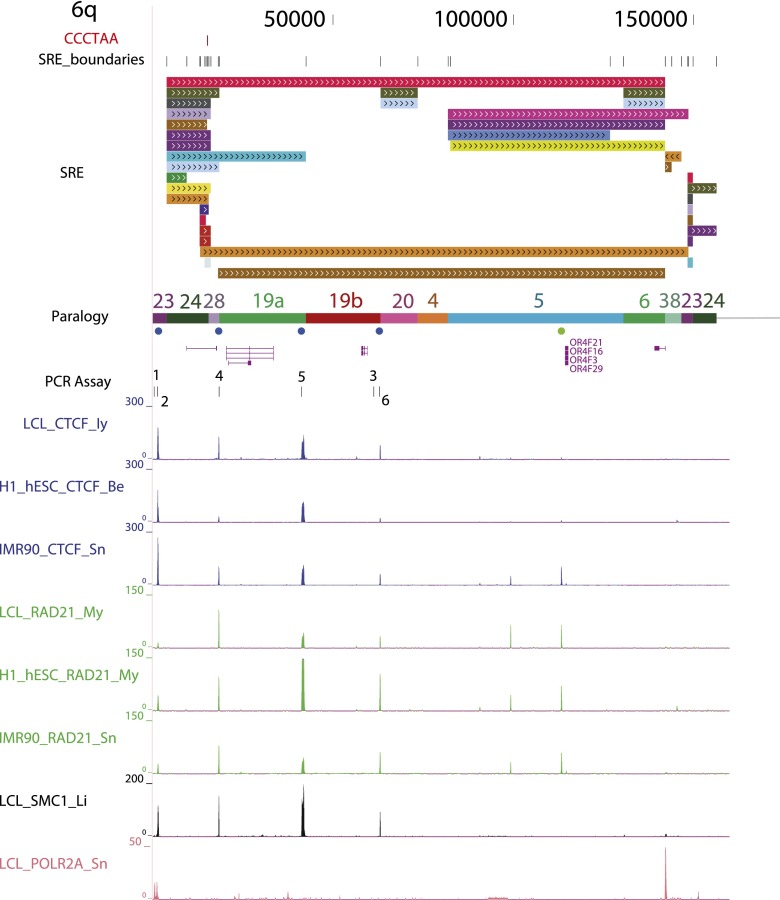
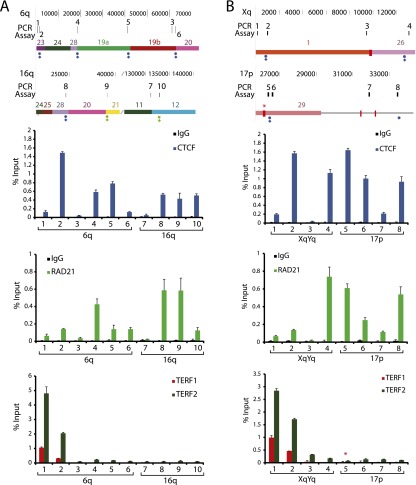
Mapping genome-wide data to human subtelomeres has been problematic due to the incomplete assembly and challenges of low-copy repetitive DNA elements. Here, we provide updated human subtelomere sequence assemblies that were extended by filling telomere-adjacent gaps using clone-based resources. A bioinformatic pipeline incorporating multiread mapping for annotation of the updated assemblies using short-read data sets was developed and implemented. Annotation of subtelomeric sequence features as well as mapping of CTCF and cohesin binding sites using ChIP-seq data sets from multiple human cell types confirmed that CTCF and cohesin bind within 3 kb of the start of terminal repeat tracts at many, but not all, subtelomeres. CTCF and cohesin co-occupancy were also enriched near internal telomere-like sequence (ITS) islands and the nonterminal boundaries of subtelomere repeat elements (SREs) in transformed lymphoblastoid cell lines (LCLs) and human embryonic stem cell (ES) lines, but were not significantly enriched in the primary fibroblast IMR90 cell line. Subtelomeric CTCF and cohesin sites predicted by ChIP-seq using our bioinformatics pipeline (but not predicted when only uniquely mapping reads were considered) were consistently validated by ChIP-qPCR. The colocalized CTCF and cohesin sites in SRE regions are candidates for mediating long-range chromatin interactions in the transcript-rich SRE region. A public browser for the integrated display of short-read sequence-based annotations relative to key subtelomere features such as the start of each terminal repeat tract, SRE identity and organization, and subtelomeric gene models was established.


Figures

Figure 1.
Figure 1.
Sequence organization of updated subtelomere sequence assemblies. The assemblies are oriented with the telomere on the left and aligned to maximize paralogous blocks of SREs following the methods described in Linardopoulou et al. (2005). Regions of the assemblies differing from hg19 are indicated by the black brackets above the altered region of the assembly. An internal gap in the 1q assembly is indicated by the magenta line segment. The pseudoautosomal region of Xq and Yq shares the same reference sequence and is indicated by the thick gray line distal to the dotted line. Blocks 43 and 44 are shown as subtelomere paralogs because they are duplicated at the 2q site of an ancestral telomere fusion; other internal paralogies are not shown or analyzed here. A selection of named transcripts mapping primarily to the indicated blocks is listed; a much larger number of uncharacterized transcripts and ncRNAs is not shown here but is annotated on the subtelomere browser. The average percentage of identity shared by copies of paralogous blocks is indicated by the groupings to the left of the color key. The positions of telomeres, ITSs, and CTCF/cohesion colocalization sites in the three cell types examined in detail are as indicated in the figure.
Figure 2.
Figure 2.
Subtelomere annotation features. The first 250 kb of the 19p subtelomere assembly is shown to illustrate key features of subtelomere sequence organization annotated on our browser. Coordinate 1 on the browser corresponds to the centromeric end of the terminal repeat tract [i.e., the last (CCCTAA)n repeat unit before subtelomere DNA starts]. The 207-kb-long SRE region on 19p is subdivided into duplication modules (“duplicons”) defined by segments of similarity (>90% nucleotide identity, >1 kb in length) between 19p and other subtelomeres (Ambrosini et al. 2007). Each rectangle represents a separate duplicon. Duplicated segments are identified by chromosome (color) as described previously (Ambrosini et al. 2007); additional details included on the live browser but omitted for the sake of clarity include the subject subtelomere identity, starting and ending coordinates of the duplicon in the subject subtelomere sequence, and the percentage of nucleotide sequence similarity of non-RepeatMasked sequences from the duplicon segment of the subject subtelomere to 19p (vader.wistar.upenn.edu/humansubtel). Each SRE boundary is indicated on a single track (SRE_boundaries), as are the internal telomere-like sequence (ITS) islands as defined in Methods (red ticks in the CCCTAA track). Gene models for transcripts included in the RefSeq (shown) (Pruitt et al. 2012) and Ensembl (hidden in this figure) (Flicek et al. 2012) transcript databases were mapped using Spidey (Wheelan et al. 2001). The paralogy track corresponds to the blocks, as shown in Figure 1. Enrichment profiles for four ChIP-seq data sets originally mapped only to subterminal DNA sequences (Deng et al. 2012) are displayed. (Inset) Close-up view of an internal SRE boundary region showing the association of the boundaries with an ITS (red rectangle on top line) and enrichment peaks for CTCF, cohesin subunits SMC1A and RAD21, and RNA polymerase II large subunit (POLR2A).
Figure 3.
Figure 3.
Example of an annotated subtelomere with CTCF and cohesin binding enrichment peaks from multiple cell types. The first 160 kb of 6q is shown in our browser. The PCR assay track marks the primer sites used for ChIP-qPCR (see Fig. 4). In addition to the ChIP-seq data sets shown in Figure 2 for LCLs (Deng et al. 2012), enrichment profiles for CTCF and RAD21 are shown following mapping of the ENCODE Project ChIP-seq data sets from the pluripotent human embryonic stem cell line H1-hESC and the primary fibroblast cell line IMR90.
Figure 4.
Figure 4.
ChIP-qPCR analysis of subtelomeric DNA protein binding sites predicted by ChIP-seq data set mappings. Candidate sites of CTCF, cohesin, TERF1, and TERF2 binding were analyzed by ChIP-qPCR. Segments of the 6q and 16q (A) and the Xq and 17p (B) subtelomeres are shown, with the coordinates (in bp) shown at the top and the subtelomere paralogy regions indicated on the respective segments. The positions of ITSs are indicated by red rectangles extending from the segments; an ITS with called TERF1 and TERF2 ChIP-seq enrichment peaks is marked with a red asterisk. The positions of colocalized CTCF and cohesin (RAD21) peaks called in LCLs are shown as green dots (if not called in other cell types) and as blue dots (if also called in ES and/or IMR90 cells). A diamond beneath a dot indicates a site where no ChIP-seq peak was called when only uniquely mapping reads were considered. Numbered ticks show the positions of primer sets used in the ChIP-qPCR experiments, and correspond to the numbered ChIP-qPCR results shown for CTCF, RAD21, and TERF1 and TERF2 graphed as the percentage of input DNA. The bar graphs represent the average of percentage input (mean ± SD) for each ChIP from three independent ChIP experiments. Ticks numbered 1 and 2 are qPCR assays for DNA immediately adjacent to the telomere, used here as positive controls for TERF1 and TERF2 binding (primer positions 1 and 2) and a positive control for a previously validated subtelomeric CTCF/RAD21 colocalization site (primer position 2).

References

    1. Altschul S 1997. Gapped BLAST and PSI-BLAST: a new generation of protein database search programs. Nucleic Acids Res 25: 3389–3402 - PMC - PubMed
    1. Ambrosini A, Paul S, Hu S, Riethman H 2007. Human subtelomeric duplicon structure and organization. Genome Biol 8: R151. - PMC - PubMed
    1. Arnoult N, Van Beneden A, Decottignies A 2012. Telomere length regulates TERRA levels through increased trimethylation of telomeric H3K9 and HP1α. Nat Struct Mol Biol 19: 948–956 - PubMed
    1. Azzalin CM, Reichenbach P, Khoriauli L, Giulotto E, Lingner J 2007. Telomeric repeat containing RNA and RNA surveillance factors at mammalian chromosome ends. Science 318: 798–801 - PubMed
    1. Baird DM, Jeffreys AJ, Royle NJ 1995. Mechanisms underlying telomere repeat turnover, revealed by hypervariable variant repeat distribution patterns in the human Xp/Yp telomere. EMBO J 14: 5433–5443 - PMC - PubMed

Publication types