. 2014 Mar 27;10(3):e1004263.
doi: 10.1371/journal.pgen.1004263. eCollection 2014 Mar.

Coronary heart disease-associated variation in TCF21 disrupts a miR-224 binding site and miRNA-mediated regulation

Affiliations

Coronary heart disease-associated variation in TCF21 disrupts a miR-224 binding site and miRNA-mediated regulation

Clint L Miller et al. PLoS Genet. .

Abstract

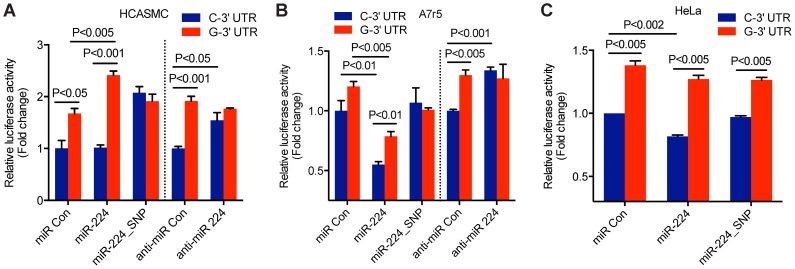
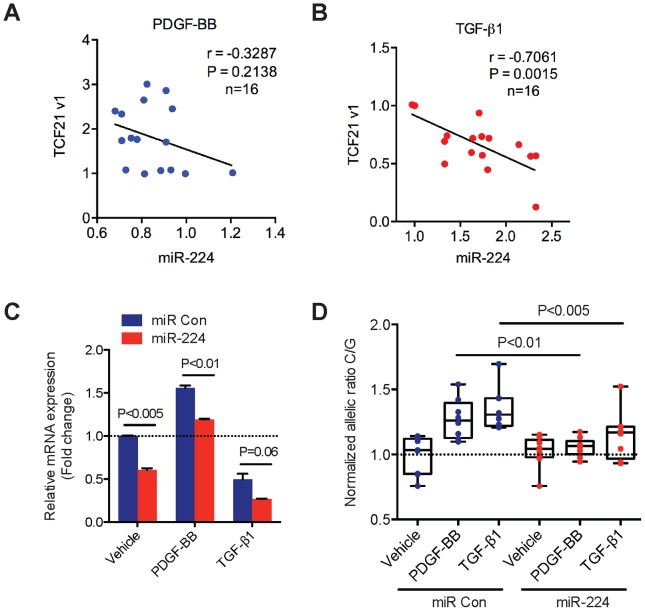
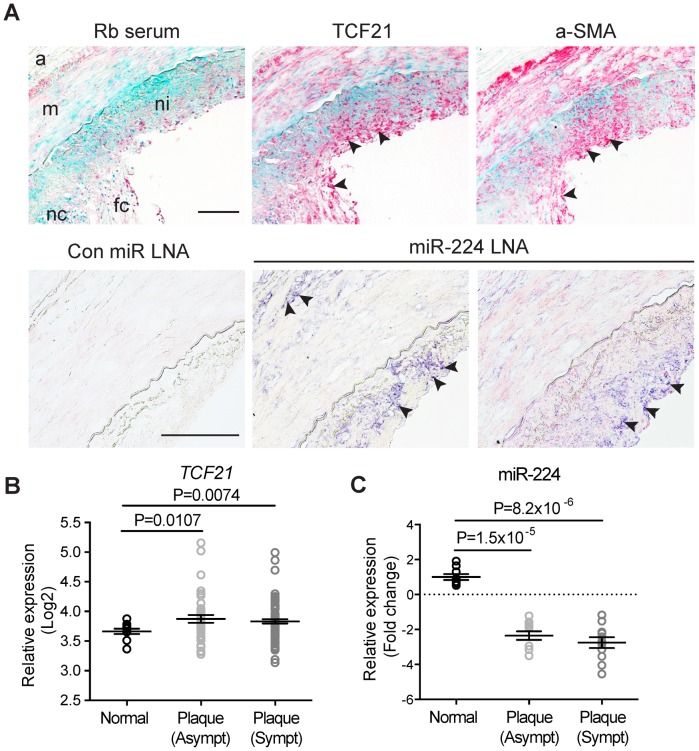
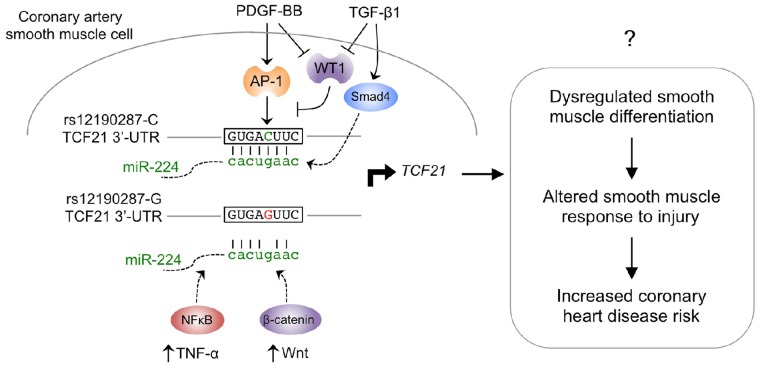
Genome-wide association studies (GWAS) have identified chromosomal loci that affect risk of coronary heart disease (CHD) independent of classical risk factors. One such association signal has been identified at 6q23.2 in both Caucasians and East Asians. The lead CHD-associated polymorphism in this region, rs12190287, resides in the 3' untranslated region (3'-UTR) of TCF21, a basic-helix-loop-helix transcription factor, and is predicted to alter the seed binding sequence for miR-224. Allelic imbalance studies in circulating leukocytes and human coronary artery smooth muscle cells (HCASMC) showed significant imbalance of the TCF21 transcript that correlated with genotype at rs12190287, consistent with this variant contributing to allele-specific expression differences. 3' UTR reporter gene transfection studies in HCASMC showed that the disease-associated C allele has reduced expression compared to the protective G allele. Kinetic analyses in vitro revealed faster RNA-RNA complex formation and greater binding of miR-224 with the TCF21 C allelic transcript. In addition, in vitro probing with Pb2+ and RNase T1 revealed structural differences between the TCF21 variants in proximity of the rs12190287 variant, which are predicted to provide greater access to the C allele for miR-224 binding. miR-224 and TCF21 expression levels were anti-correlated in HCASMC, and miR-224 modulates the transcriptional response of TCF21 to transforming growth factor-β (TGF-β) and platelet derived growth factor (PDGF) signaling in an allele-specific manner. Lastly, miR-224 and TCF21 were localized in human coronary artery lesions and anti-correlated during atherosclerosis. Together, these data suggest that miR-224 interaction with the TCF21 transcript contributes to allelic imbalance of this gene, thus partly explaining the genetic risk for coronary heart disease associated at 6q23.2. These studies implicating rs12190287 in the miRNA-dependent regulation of TCF21, in conjunction with previous studies showing that this variant modulates transcriptional regulation through activator protein 1 (AP-1), suggests a unique bimodal level of complexity previously unreported for disease-associated variants.


Conflict of interest statement

The authors have declared that no competing interests exist.

Figures

Figure 1
Figure 1. Allele specific expression at rs12190287 in human peripheral blood samples.
(A) TaqMan quantitative PCR results depicting allele specific expression of TCF21 at rs12190287 in peripheral blood samples (n = 22 heterozygous samples) obtained from human cohort studies. Allelic expression and genotyping data were determined from cDNA and gDNA, respectively, using a pre-calibrated TaqMan SNP genotyping probe for rs12190287, with each sample performed in triplicates. Data are expressed as the normalized allelic ratio of cDNA/gDNA and values represent mean ± SEM. (B) Representative pyrosequencing traces from HCASMC cDNA and gDNA from various cell lots. Allelic ratios were determined from the area under the curve for major and minor allele. Similar results were observed from three independent experiments. P values shown were calculated from combined data using a paired t-test compared to allelic ratio of gDNA samples. Asterisks represent individual level of significance versus expected allelic ratio of 1.0, * P<0.05, **P<0.01, ***P<0.001.
Figure 2
Figure 2. Predicted interaction of miR-224 with TCF21 variant 1 3′-UTR and secondary structural changes at rs12190287.
(A) TargetScan and MiRanda prediction algorithms identified rs12190287 (position 1058) residing within a 7-mer, mammalian conserved binding site for mature miR-224 (represented as an exact seed match for nucleotides 2–8; positions 1042–1061) (Fig. 2A). (B) Alignment of rs12190287 major and minor alleles demonstrated a perfect seed match between the TCF21 3′UTR containing the major risk allele (C) and miR-224, and a seed mismatch between the minor protective allele (G) and miR-224. (C) Systematic in silico RNA secondary structure predictions were performed as described in the text. Representative predicted structures of TCF21 rs12190287 C and G variants are shown from positions 941–1141 (Fig. 2B). While both variants have similar global structures, they adopt distinct local secondary structures in proximity of the SNP. (D) Summary of SNP rs12190287 location within 180 analyzed RNA secondary structures, resulting in major risk allele (TCF21 C) typically located in loop region, while minor protective allele (TCF21 G) was often located in the stem region.
Figure 3
Figure 3. Allele-specific miR-224 regulation of TCF21 3′UTR at rs12190287.
Luciferase reporter assay of TCF21 rs12190287-C and G 3′-UTR variants determined in (A) primary coronary artery smooth muscle cells (HCASMC), (B) rat aortic smooth muscle cell line, A7r5, and (C) HeLa cell line. Negative control miRNA (miR Con), miR-224, miR-224_SNP, anti-miR negative control (anti-miR Con) or anti-miR-224 inhibitors were co-transfected with 3′-UTR reporters for 24 hrs and the relative luciferase activity (ratio of firefly/Renilla luciferase activity) was measured and normalized to C-3′-UTR+miR Con or anti-miR Con, shown as fold change. Data represent mean ± SEM of triplicates. Similar results were observed from three independent experiments. P-values are shown for intra and inter-assay comparisons where statistically significant (P<0.05).
Figure 4
Figure 4. In vitro annealing kinetics between miR-224 and TCF21 3′UTR variants.
(A) (Left panel) TCF21 3′-UTR variants were generated by in vitro transcription (IVT) and incubated with excess over 32P-labeled miR-224 for various time points, followed by autoradiography detection. Band intensities indicate relative amounts of the 3′-UTR variant:miRNA complexes formed over indicated times. (Right panel) IVT 3′-UTR variants were also incubated with excess over 32P-labeled miR-224_SNP, resulting in a seed mismatch with the C variant and a seed match with the G variant. (B) Band intensities of 3′-UTR:miRNA complexes formed using 32P-labeled miR-224 or 32P-labeled miR-224_SNP were detected by PhosphorImager and to quantify the percentage of complex signals ImageQuant-Software was used to determine relative to whole lane signal. Values represent mean ± SEM from three independent experiments. (C) Calculation of second-order rate constants for individual mRNA:miRNA complexes was performed as previously described . n.d., complex formation was too slow to derive a rate constant.
Figure 5
Figure 5. Allele-specific structural differences in conformations of TCF21 3′-UTR RNAs determined by in vitro probing.
(A) Results of chemical probing of the in vitro transcribed TCF21 3′-UTR variants with varying amounts of Pb2+ (0, 10, 20 and 40 mM) and (B) enzymatic probing with varying amounts of RNase T1 (0, 0.25, 1 and 2 units). Major cleavage sites are shown along with their positions. miR-224 binding site is highlighted in green and rs12190287 is shown in red. (C) Summary of the major cleavage sites using either Pb2+ or RNase T1 and their overall cleavage strength is indicated by open and closed triangle and circles. Results are representative of at least three independent experiments.
Figure 6
Figure 6. Correlation of endogenous TCF21 and miR-224 expression levels in HCASMC.
(A) TaqMan quantitative PCR results showing the correlation of endogenous TCF21 variant 1 expression levels with miR-224 in HCASMCs stimulated with recombinant human PDGF-BB (20 ng/ml) for various time points (0, 1, 2, 6, 12, 24 hrs) (n = 16). (B) Similar experiments performed in HCASMCs stimulated with recombinant human TGF-β1 (5 ng/ml) for various time points (0, 1, 2, 6, 12, 24 hrs) (n = 16). TCF21 and miR-224 expression levels were normalized to 18S and RNU44, respectively. Pearson's correlation was determined assuming a linear relationship, with resulting r, and P-values shown. (C) TaqMan qPCR results measuring total TCF21 transcript levels in HCASMC transfected with Negative control miRNA mimic (miR Con) or miR-224 mimic and stimulated with either PDGF-BB or TGF-β1 for 6 hrs. Data represent mean ± SEM of triplicates. Similar results were observed from three independent experiments. (D) Allele-specific TaqMan qPCR measuring TCF21 expression at rs12190287 in HCASMCs treated as described above. Values are expressed as the normalized ratio of C/G alleles. Data represent individual replicates from three independent experiments (n = 8–9).
Figure 7
Figure 7. Expression of TCF21 and miR-224 in human atherosclerotic lesions.
(A) (Upper panel) Immunohistochemical staining results showing endogenous TCF21 protein expression (in red) in neointima and media regions of left anterior descending (LAD) coronary artery sections (10× magnification). Adjacent sections were incubated with rabbit serum (negative control) or anti-alpha-smooth muscle actin (a-SMA) antibody to localize smooth muscle-like cells. Methyl Green was used as a nuclear counterstain. (Lower panel) Representative in situ hybridization results showing endogenous miR-224 (in indigo) localized in the neointima and adventitia in adjacent LAD sections (20× magnification). Rb: rabbit, LNA: locked nucleic acid. a: adventitia, m: media, ni: neointima, fc: fibrous cap, necrotic core. Arrows denote specific staining. Scale bars = 0.5 mm. (B) Microarray gene expression results showing regulation of TCF21 mRNA and (C) TaqMan quantitative PCR results depicting miR-224 expression, during disease progression in normal, stable and unstable human carotid atherosclerotic lesions (n = 10 per group). Microarray-based expression levels were normalized by robust multi-array average (RMA) and TaqMan-based levels were normalized to the RNU44 internal control. Values represent mean Log2 fold change of replicates and lines represent mean ± SEM. Similar results were observed from two independent experiments.
Figure 8
Figure 8. Proposed model of signaling pathways converging on miR-224-TCF21 interaction at rs12190287.
Previous studies elucidated a cis-regulatory mechanism by which the lead SNP associated with CHD at 6q23.2, rs12190287, was shown to disrupt trans-activating AP-1 binding by the minor protective allele (G). This resulted in altered growth factor mediated transcriptional activation, chromatin organization and allele-specific TCF21 gene expression in human coronary artery smooth muscle cells (HCASMC). The trans-repressing factor, Wilms tumor 1 (WT1) was also shown to counter-regulate the positive effects of AP-1 at rs12190287 and preferentially associate with the major risk allele (C). Herein we describe a post-transcriptional cis-regulatory mechanism by which the minor protective allele alters a perfect seed match of miR-224 in the 3′-UTR of TCF21. Altered RNA structure is predicted to account for differential miRNA binding kinetics, and regulation of transcription. Further, both PDGF-BB and TGF-β upstream stimuli in HCASMC may account for the miR-224 mediated allele-specific expression at rs12190287. Additionally, both NFκB and Wnt upstream signals have been proposed to regulate miR-224 in tumor cells, and may potentially participate in the described mechanisms in HCASMC. Taken, together dysregulation of TCF21 is predicted to account for altered smooth muscle cell (SMC) response to injury due to phenotypic modulation from a differentiated to proliferating SMC, leading to increased risk for CHD.

References

    1. Deloukas P, Kanoni S, Willenborg C, Farrall M, Assimes TL, et al. (2012) Large-scale association analysis identifies new risk loci for coronary artery disease. Nat Genet 45: 25–33. - PMC - PubMed
    1. Schunkert H, Konig IR, Kathiresan S, Reilly MP, Assimes TL, et al. (2011) Large-scale association analysis identifies 13 new susceptibility loci for coronary artery disease. Nat Genet 43: 333–338. - PMC - PubMed
    1. Lu X, Wang L, Chen S, He L, Yang X, et al. (2012) Genome-wide association study in Han Chinese identifies four new susceptibility loci for coronary artery disease. Nat Genet 44: 890–894. - PMC - PubMed
    1. Hidai H, Bardales R, Goodwin R, Quertermous T, Quertermous EE (1998) Cloning of capsulin, a basic helix-loop-helix factor expressed in progenitor cells of the pericardium and the coronary arteries. Mech Dev 73: 33–43. - PubMed
    1. Lu J, Richardson JA, Olson EN (1998) Capsulin: a novel bHLH transcription factor expressed in epicardial progenitors and mesenchyme of visceral organs. Mech Dev 73: 23–32. - PubMed

Publication types