. 2014 Mar 27;10(3):e1003538.
doi: 10.1371/journal.pcbi.1003538. eCollection 2014 Mar.

Correction of distortion in flattened representations of the cortical surface allows prediction of V1-V3 functional organization from anatomy

Affiliations

Correction of distortion in flattened representations of the cortical surface allows prediction of V1-V3 functional organization from anatomy

Noah C Benson et al. PLoS Comput Biol. .

Abstract

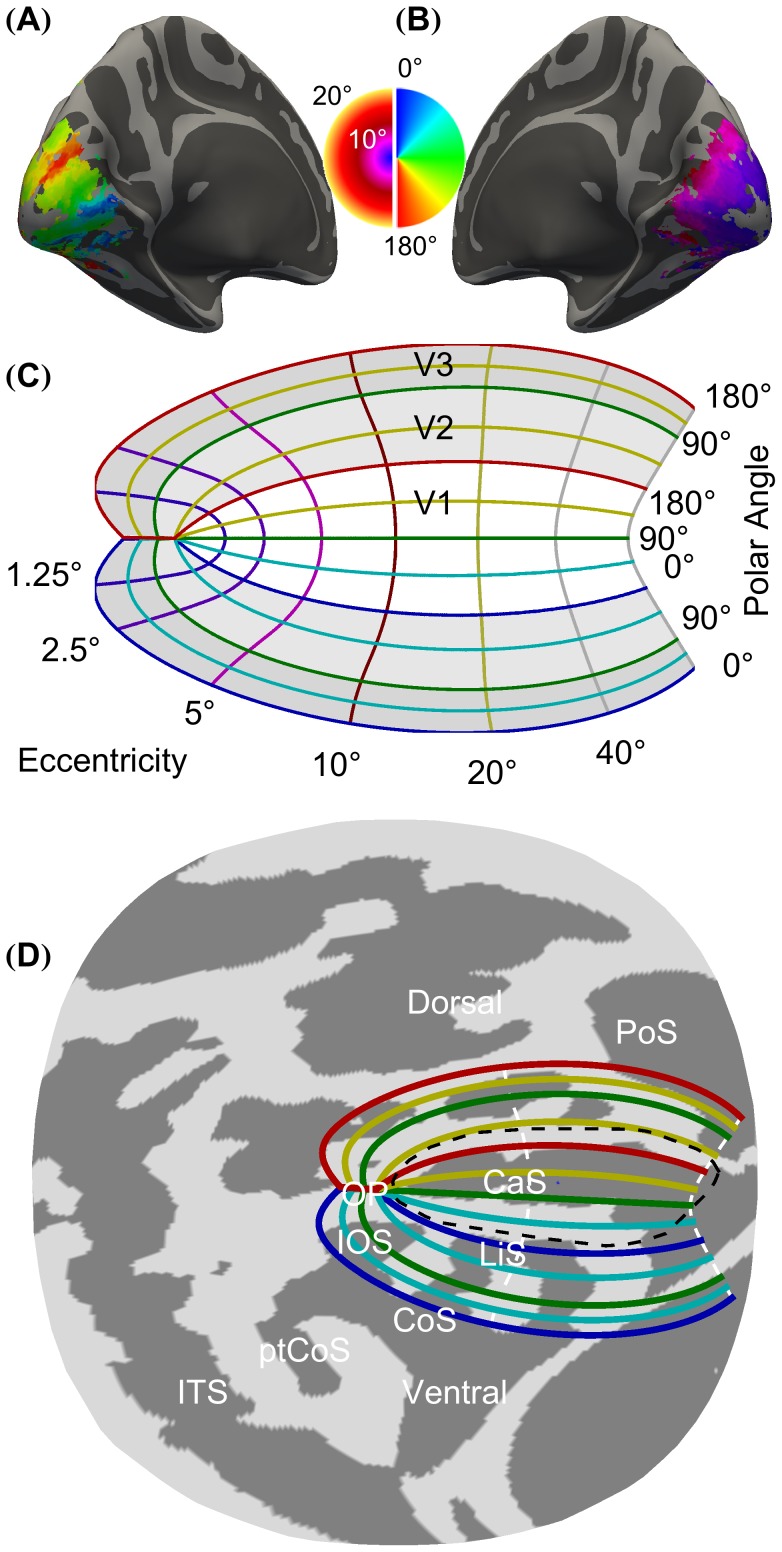
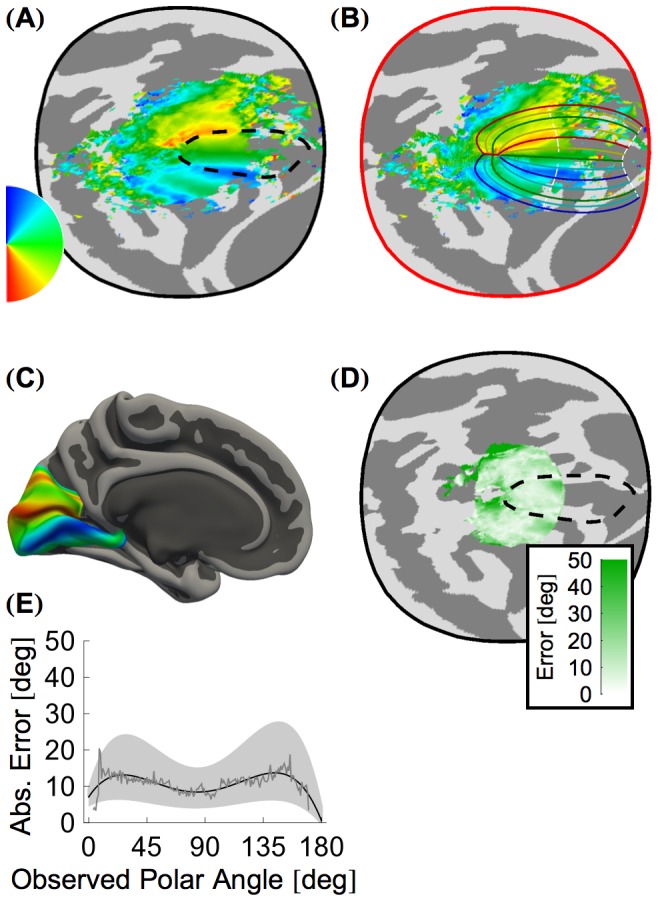
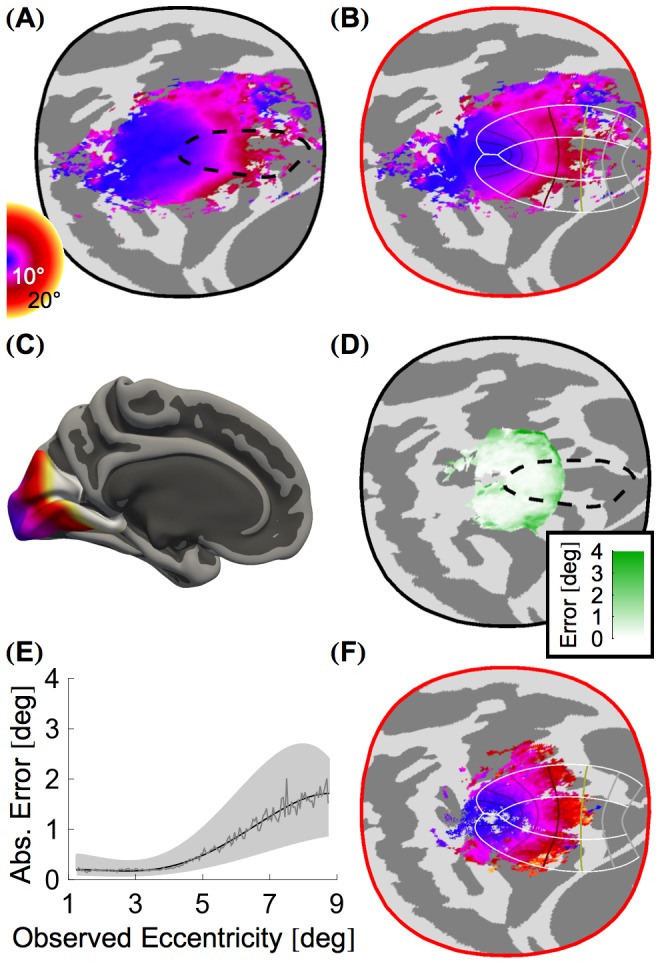
Several domains of neuroscience offer map-like models that link location on the cortical surface to properties of sensory representation. Within cortical visual areas V1, V2, and V3, algebraic transformations can relate position in the visual field to the retinotopic representation on the flattened cortical sheet. A limit to the practical application of this structure-function model is that the cortex, while topologically a two-dimensional surface, is curved. Flattening of the curved surface to a plane unavoidably introduces local geometric distortions that are not accounted for in idealized models. Here, we show that this limitation is overcome by correcting the geometric distortion induced by cortical flattening. We use a mass-spring-damper simulation to create a registration between functional MRI retinotopic mapping data of visual areas V1, V2, and V3 and an algebraic model of retinotopy. This registration is then applied to the flattened cortical surface anatomy to create an anatomical template that is linked to the algebraic retinotopic model. This registered cortical template can be used to accurately predict the location and retinotopic organization of these early visual areas from cortical anatomy alone. Moreover, we show that prediction accuracy remains when extrapolating beyond the range of data used to inform the model, indicating that the registration reflects the retinotopic organization of visual cortex. We provide code for the mass-spring-damper technique, which has general utility for the registration of cortical structure and function beyond the visual cortex.


Conflict of interest statement

The authors have declared that no competing interests exist.

Figures

Figure 1
Figure 1. The retinotopic organization of visual cortex as measured and modeled.
(A) The polar angle map, of a subject from our 10° dataset, shown on an inflated left hemisphere. (B) The eccentricity map of the subject shown in part A, shown on an inflated right hemisphere. (C) The algebraic model of retinotopic organization. V1, V2, and V3 are colored white, light gray, and dark gray, respectively. (D) The cortical surface atlas space (fsaverage_sym) from the occipital pole after flattening to the 2D surface. The Hinds V1 border is indicated by the dashed black line, and the algebraic model of retinotopic organization used in registration is plotted with all 0°, 90°, and 180° polar angle lines colored according to the legend and the 10° and 90° eccentricity lines dashed and colored white. Shown are the Calcarine Sulcus (CaS), the Parietal-occipital Sulcus (PoS), the Lingual sulcus (LiS), the Inferior Occipital Sulcus (IOS), the Collateral Sulcus (CoS), the posterior Collateral Sulcus (ptCoS), the Inferior Temporal Sulcus (ITS), and the Occipital Pole (OP).
Figure 2
Figure 2. MSD simulation warps the flattened cortical surface to register data to the algebraic model.
(A) The magnitude of the warping of each vertex on the flattened cortical surface. The Hinds et al. V1 border is marked by the dashed black line (throughout). (B) The direction of warping induced by MSD simulation upon each vertex from the original cortical surface atlas space (fsaverage_sym). Vertices with distortion magnitudes below 0.01 rad are plotted in unsaturated colors. (C) The flattened patch of the cortical surface atlas (fsaverage_sym) with sulcal curvature shown in light and dark gray. Regions V1, V2, and V3, as predicted by our method in the corrected topology then projected back to surface atlas space, are tinted red, green, and blue respectively. (D) The flattened cortical surface of the corrected topology with sulcal curvature shown in light and dark gray. A line plot of the algebraic model (Fig. 1C) to which the MSD simulation registered the functional data is shown. Regions V1, V2, and V3 are tinted as in panel C.
Figure 3
Figure 3. Polar angle organization.
(A) The mean weighted aggregate polar angle map of all subjects in dataset D10° shown in the cortical surface atlas space. (B) The mean weighted aggregate polar angle map from panel A shown in the corrected topology following MSD warping. A line plot of the algebraic model to which the MSD simulation registered the functional data is shown over the functional data. (C) The polar angle template plotted on the fsaverage_sym pial surface. This template was calculated by converting the prediction of polar angle from the idealized model, as applied to vertices in the corrected topology, back to the fsaverage_sym atlas. (D) Median absolute leave-one-out polar angle error for all vertices with predicted eccentricties between 1.25° and 8.75° shown in the fsaverage_sym atlas space. This error was calculated by comparing the predicted polar angle generated from each subset of 18 of the 19 subjects in the 10° dataset to the observed polar angle of the remaining subject. The median absolute overall leave-one-out error is 10.93° (Tab. 1). The highest errors occur near the foveal confluence and at the dorsal border of V3. (E) Absolute leave-one-out error of the polar angle prediction across all regions (V1, V2, and V3), plotted according to the predicted polar angle value. The thin gray line represents the median error while the thick black line shows a best-fit 5th order polynomial to the median error. The dashed lines demarcate similar fits to the upper and lower error quartiles. Error plots for individual regions are given in Fig. S1.
Figure 4
Figure 4. Eccentricity organization.
(A) The mean weighted aggregate eccentricity map of all subjects in dataset D10° shown in the fsaverage_sym cortical atlas space. (B) The mean weighted aggregate eccentricity map from panel A shown in the corrected topology following MSD warping. A line plot of the algebraic model to which the MSD simulation registered the functional data is shown. (C) The eccentricity template plotted on the fsaverage_sym pial surface. This template was calculated by converting the prediction of eccentricity from the algebraic model, as applied to vertices in the corrected topology, back to the fsaverage_sym topology. (D) Median absolute leave-one-out eccentricity error for all vertices with predicted eccentricties between 1.25° and 8.75° shown in the fsaverage_sym atlas space. This error was calculated by comparing the predicted eccentricity generated from each subset of 18 of the 19 subjects in the 10° dataset to the observed eccentricity of the remaining subject. The median absolute overall leave-one-out error is 0.41° (Tab. 1). The highest errors occur near the outer eccentricity border of of our stimulus. (E) Absolute leave-one-out error of the eccentricity prediction across all regions (V1, V2, and V3), plotted according to the predicted polar angle value. Error plots for individual regions are given in Fig. S2. (F) The mean weighted aggregate eccentricity map of all subjects in dataset D20° shown in the cortical patch corrected by MSD warping to the D10° dataset. Although this dataset includes eccentricities beyond those used to discover the corrected topology, the 20° aggregate data is in good (although not perfect) agreement with the prediction.

References

    1. Wandell BA, Dumoulin SO, Brewer AA (2007) Visual Field Maps in Human Cortex. Neuron 56: 366–383. - PubMed
    1. Dougherty RF, Koch VM, Brewer AA, Fischer B, Modersitzki J, et al. (2003) Visual field representations and locations of visual areas V1/2/3 in human visual cortex. J Vis 3: 1–1. - PubMed
    1. Fischl B, Sereno MI, Tootell R, Dale AM (1999) High-resolution intersubject averaging and a coordinate system for the cortical surface. Hum Brain Mapp 8: 272–284. - PMC - PubMed
    1. Dale AM, Fischl B, Sereno MI (1999) Cortical surface-based analysis. I. Segmentation and surface reconstruction. NeuroImage 9: 179–194. - PubMed
    1. Fischl B, Dale AM (2000) Measuring the thickness of the human cerebral cortex from magnetic resonance images. Proc Nat Acad Sci U S A 97: 11050–11055. - PMC - PubMed

Publication types

LinkOut - more resources