. 2014 Mar 27;10(3):e1004271.
doi: 10.1371/journal.pgen.1004271. eCollection 2014 Mar.

Changes in colorectal carcinoma genomes under anti-EGFR therapy identified by whole-genome plasma DNA sequencing

Affiliations

Changes in colorectal carcinoma genomes under anti-EGFR therapy identified by whole-genome plasma DNA sequencing

Sumitra Mohan et al. PLoS Genet. .

Abstract

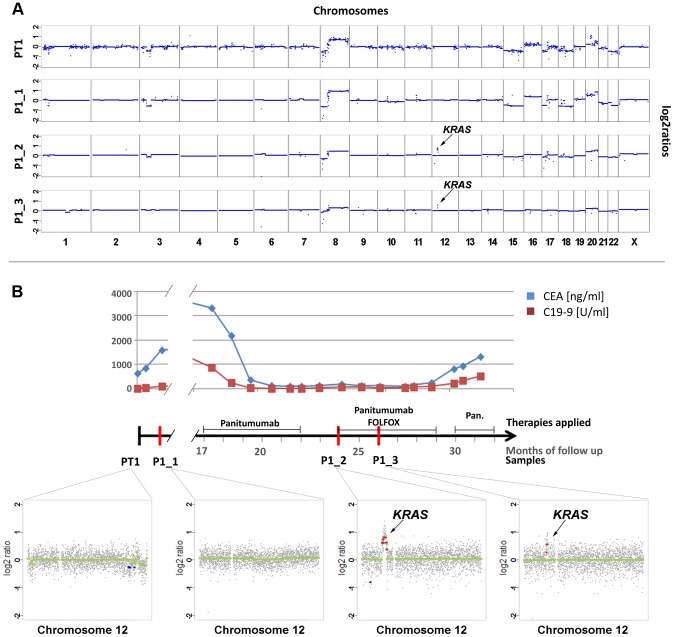
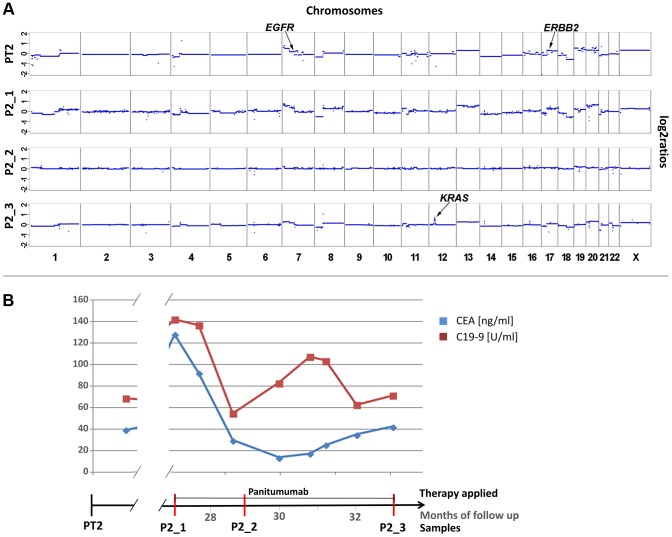
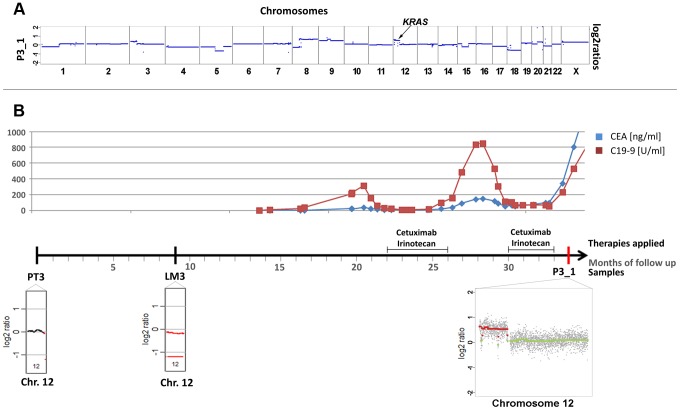
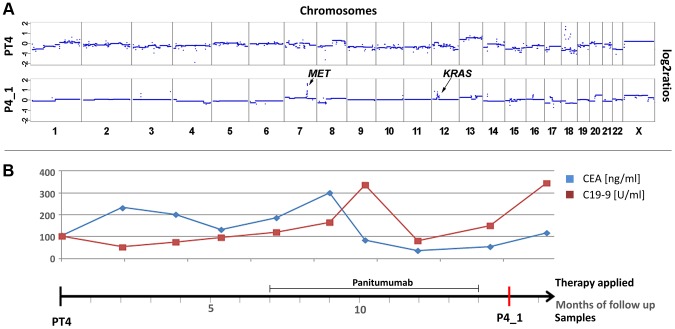
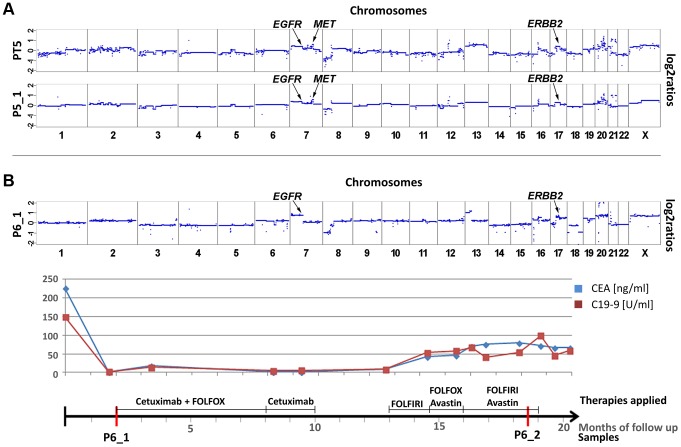
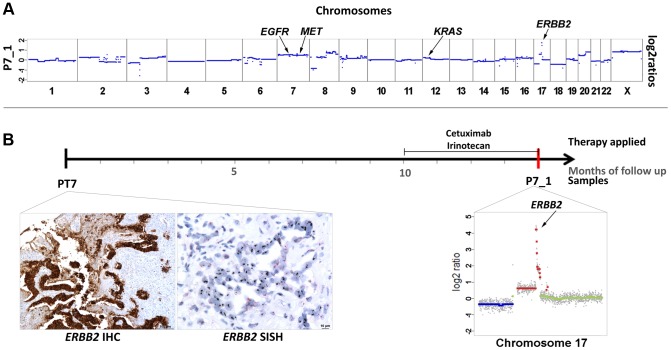
Monoclonal antibodies targeting the Epidermal Growth Factor Receptor (EGFR), such as cetuximab and panitumumab, have evolved to important therapeutic options in metastatic colorectal cancer (CRC). However, almost all patients with clinical response to anti-EGFR therapies show disease progression within a few months and little is known about mechanism and timing of resistance evolution. Here we analyzed plasma DNA from ten patients treated with anti-EGFR therapy by whole genome sequencing (plasma-Seq) and ultra-sensitive deep sequencing of genes associated with resistance to anti-EGFR treatment such as KRAS, BRAF, PIK3CA, and EGFR. Surprisingly, we observed that the development of resistance to anti-EGFR therapies was associated with acquired gains of KRAS in four patients (40%), which occurred either as novel focal amplifications (n = 3) or as high level polysomy of 12p (n = 1). In addition, we observed focal amplifications of other genes recently shown to be involved in acquired resistance to anti-EGFR therapies, such as MET (n = 2) and ERBB2 (n = 1). Overrepresentation of the EGFR gene was associated with a good initial anti-EGFR efficacy. Overall, we identified predictive biomarkers associated with anti-EGFR efficacy in seven patients (70%), which correlated well with treatment response. In contrast, ultra-sensitive deep sequencing of KRAS, BRAF, PIK3CA, and EGFR did not reveal the occurrence of novel, acquired mutations. Thus, plasma-Seq enables the identification of novel mutant clones and may therefore facilitate early adjustments of therapies that may delay or prevent disease progression.


Conflict of interest statement

The authors have declared that no competing interests exist.

Figures

Figure 1
Figure 1. Emergence of KRAS amplification during panitumumab therapy in patient #1.
(a) Copy number analyses of the primary tumor (PT1) and three plasma samples (annotated as P1_1, P1_2, P1_3). The dates of plasma sampling are shown in (b). The X- and Y-axes indicate the chromosome and the log2-ratios, respectively. The location of KRAS is indicated for plasma samples P1_2 and P1_3. (b) The units on the timeline in the center are in months, the dates of our blood collections are indicated by red bars. Above the time line the timing of anti-EGFR therapy and the CEA (ng/ml) and CA 19-9 (U/ml) levels (in blue and red lines, respectively) are illustrated. Below the timeline are zoomed in log2-ratio plots of chromosome 12 (PT1, month 0; P1_1, month 1; P1_2, month 24; and P1_3, month 26). Segments with identical log2-ratios whose log2-ratios is <0.2 are depicted with blue dots, segments with identical log2-ratios and log2-ratios >−0.2 in red dots, and segments with log2-ratios between −0.2 and 0.2 in green. (FOLFOX: FOL-Folinic acid (leucovorin) + F-Fluorouracil (5-FU) + OX-Oxaliplatin (Eloxatin); Pan.: Panitumumab).
Figure 2
Figure 2. Appearance of KRAS amplification after 6 months of panitumumab therapy in patient #2.
(a) Copy number analyses of the primary tumor (PT2) and three plasma analyses (P2_1, month 27; P2_2, month 29; and P2_3, month 33). The locations of the EGFR, ERBB2 and KRAS genes are indicted in PT2 and P2_3, respectively. The dates of plasma sampling are shown in (b). (b) The timeline indicates the dates of our blood collections (red bars), the duration of the panitumumab therapy, and the respective CEA (ng/ml) and CA 19-9 (U/ml) (in blue and red, respectively) values.
Figure 3
Figure 3. Occurrence of a chromosomal 12p polysomy under cetuximab therapy in patient #26C1.
(a) Plasma-Seq (P3_1) confirmed the vast majority of the copy number changes observed in the two pre-treatment samples PT3 and LM3 (Complete array-CGH profiles of these two pre-treatment samples are shown in Figure S3). In plasma-Seq the high-level gain of the entire chromosome 12p including the KRAS gene was a novel change. (b) Time line indicating the timing of two cycles of cetuximab and CEA (ng/ml) and CA 19-9 (U/ml) (in blue and red, respectively) levels. Below the time line are chromosome 12 plots made by array-CGH [from the primary tumor (PT3), month 0; and a liver metastasis (LM3), month 9; black: balanced regions; red: lost regions] or by plasma-Seq (P3_1, month 35; color designation as in Figure 1).
Figure 4
Figure 4. Co-occurrence of amplifications of the KRAS and MET genes observed after 7 months of treatment with panitumumab in patient #4.
(a) Copy number profiles of the primary tumor (PT4) and the plasma DNA (P4_1) obtained 15 months later. The focal amplifications of the MET and KRAS genes on chromosomes 7 and 12, respectively, are annotated in the plasma sample. (b) The units in the time line correspond to months. Above the time line the period of panitumumab therapy and the CEA (ng/ml) and CA 19-9 (U/ml) (in blue and red, respectively) levels are illustrated.
Figure 5
Figure 5. Cases with copy number changes in EGFR, MET, and ERBB2.
(a) Copy number profiles of the primary tumor (PT5) and a plasma sample (P5_1) of patient #5, the time interval between both samples is almost 3 years. Both samples show a focal amplification of the MET gene and, furthermore regions on 7p and 17q, harboring the EGFR and the ERBB2 genes, respectively, are gained. The focal amplification on chromosome 12q13.13-12q13.3 does not include the KRAS gene (for further details see text). (b) Plasma-Seq for patient #6 prior to anti-EGFR therapy with cetuximab (P6_1) showed several copy number changes, including gains of 7p (EGFR) and 17q (ERBB2). The time line indicates the low CEA and CA 19-9 levels during treatment with cetuximab. (FOLFOX: FOL-Folinic acid (leucovorin) + F-Fluorouracil (5-FU) + OX-Oxaliplatin (Eloxatin); FOLFIRI: FOL-Folinic acid (leucovorin) + F-Fluorouracil (5-FU) + IRI-irinotecan).
Figure 6
Figure 6. High-level focal amplification of ERBB2 in patient #7 treated with cetuximab.
(a) Copy number profile of the plasma sample (P7_1) and the locations of the EGFR, MET, KRAS, and ERBB2 genes. (b) The time line illustrates the duration of cetuximab treatment and the date (red bar) of our blood collection. Below the time line are the ERBB2 immunohistochemistry and silver in situ hybridization (SISH) images of the biopsy material from the primary tumor (month 0) showing an immunoreactive score 3+ and high amplification, respectively. Her2/neu signals are black in the SISH technique. Furthermore, a plot of chromosome 17 from P7_1 obtained at month 14 is illustrated (note that the scale of the Y-axis reaches till 5 to illustrate the high-level gain; color designation as in Figure 1).

References

    1. Karapetis CS, Khambata-Ford S, Jonker DJ, O'Callaghan CJ, Tu D, et al. (2008) K-ras mutations and benefit from cetuximab in advanced colorectal cancer. N Engl J Med 359: 1757–1765. - PubMed
    1. Van Cutsem E, Kohne CH, Hitre E, Zaluski J, Chang Chien CR, et al. (2009) Cetuximab and chemotherapy as initial treatment for metastatic colorectal cancer. N Engl J Med 360: 1408–1417. - PubMed
    1. Amado RG, Wolf M, Peeters M, Van Cutsem E, Siena S, et al. (2008) Wild-type KRAS is required for panitumumab efficacy in patients with metastatic colorectal cancer. J Clin Oncol 26: 1626–1634. - PubMed
    1. Cunningham D, Humblet Y, Siena S, Khayat D, Bleiberg H, et al. (2004) Cetuximab monotherapy and cetuximab plus irinotecan in irinotecan-refractory metastatic colorectal cancer. N Engl J Med 351: 337–345. - PubMed
    1. Van Cutsem E, Peeters M, Siena S, Humblet Y, Hendlisz A, et al. (2007) Open-label phase III trial of panitumumab plus best supportive care compared with best supportive care alone in patients with chemotherapy-refractory metastatic colorectal cancer. J Clin Oncol 25: 1658–1664. - PubMed

Publication types

MeSH terms