. 2014 Jul;25(7):1415-29.
doi: 10.1681/ASN.2013050518. Epub 2014 Mar 27.

Role of podocyte B7-1 in diabetic nephropathy

Affiliations

Role of podocyte B7-1 in diabetic nephropathy

Paolo Fiorina et al. J Am Soc Nephrol. 2014 Jul.

Abstract

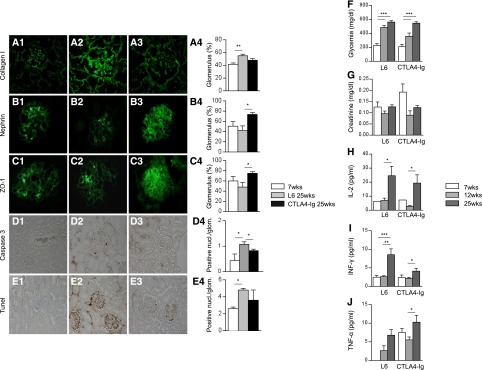
Podocyte injury and resulting albuminuria are hallmarks of diabetic nephropathy, but targeted therapies to halt or prevent these complications are currently not available. Here, we show that the immune-related molecule B7-1/CD80 is a critical mediator of podocyte injury in type 2 diabetic nephropathy. We report the induction of podocyte B7-1 in kidney biopsy specimens from patients with type 2 diabetes. Genetic and epidemiologic studies revealed the association of two single nucleotide polymorphisms at the B7-1 gene with diabetic nephropathy. Furthermore, increased levels of the soluble isoform of the B7-1 ligand CD28 correlated with the progression to ESRD in individuals with type 2 diabetes. In vitro, high glucose conditions prompted the phosphatidylinositol 3 kinase-dependent upregulation of B7-1 in podocytes, and the ectopic expression of B7-1 in podocytes increased apoptosis and induced disruption of the cytoskeleton that were reversed by the B7-1 inhibitor CTLA4-Ig. Podocyte expression of B7-1 was also induced in vivo in two murine models of diabetic nephropathy, and treatment with CTLA4-Ig prevented increased urinary albumin excretion and improved kidney pathology in these animals. Taken together, these results identify B7-1 inhibition as a potential therapeutic strategy for the prevention or treatment of diabetic nephropathy.


Figures

Figure 1.
Figure 1.
B7-1 is upregulated in kidney biopsies obtained from a subset of patients with T2D and DN-related lesions. Kidney biopsies obtained from individuals with T2D. (A, C, and D) B7-1 is expressed in 47% of biopsies obtained from individuals with T2D. (B) Real-time PCR analysis confirms an upregulation of B7-1 mRNA expression in individuals with T2D compared with controls (*P<0.05). (D) Results show that 17% of individuals with T2D and belonging to DN class 1 have high B7-1 expression, whereas individuals with class 2A–2B DN lesions show moderate (25%) to high (25%) B7-1 expression. Among individuals with T2D and in DN class 3, 43% and 14% show a moderate and high B7-1 expression, respectively. Finally, the individual with T2D belonging to DN class 4 displays high B7-1 expression. (E1–E5) Anecdotal cases of kidney biopsies with different degrees of glomerular B7-1 expression in individuals with T2D and various types of renal lesions. (F1–F5) Notably, high B7-1 expression levels are paralleled by a progressively reduced expression of synaptopodin. (G1–G5) This overlap with synaptopodin suggests podocyte localization of B7-1. Ctrl, control; glom, glomerulus. Original magnification, ×200.
Figure 2.
Figure 2.
Elevated baseline plasma concentrations of sCD28 are associated with future risk of ESRD. (A) ESRD incidence rates are shown according to quartile distribution for the baseline plasma levels of soluble CD28 (sCD28). Low baseline sCD28 concentrations result in low ESRD incidence rates, whereas a progressive increase of marker concentration in the serum is associated with worse outcome. Incidence rates according to quartile distribution are as follows: Q1, 1.7; Q2, 3.3; Q3, 3.2; and Q4, 6.0 per 100 patient-years (**P<0.01). (B) The cumulative risk for ESRD occurrence for Q4 of sCD28 reaches 66% within 12 years of follow-up, whereas it is 25%–38% for the remaining quartiles (*P<0.05). (C) In a logistic regression model, the OR of the subsequent progression to ESRD for participants with high baseline concentrations of sCD28 (Q4) is 5.5 (95% CI, 2.0 to 14; ***P=0.001). Multivariate analysis adjusted for clinical covariates at baseline, such as age, eGFR, HbA1c, and albuminuria, shows an odds of progression ratio to ESRD of 2.8 (95% CI, 1.0 to 7.8; *P=0.04) among patients with high concentrations of sCD28 (Q4).
Figure 3.
Figure 3.
B7-1 is upregulated in podocytes in HG conditions in vitro. Conditionally immortalized podocytes are grown at 37°C in NG (10 mM) and HG (30 mM) for 7 and 14 days (D). Mannitol (20 mM plus glucose 10 mM) is used as an osmotic control. Cells are harvested, and the expression of multiple costimulatory molecules is evaluated by FACS analysis. B7-1 is barely expressed after 14 days of normal glucose or mannitol (A and H) culture conditions, whereas it increases after 7 and 14 days of HG conditions (*P<0.05; ***P<0.001, NG versus HG, 7D and HG14D, respectively; ***P<0.001, mannitol versus HG 14D). (B–G) All other costimulatory molecules tested are unchanged during HG. (I) Real-time PCR analysis confirms the increase of B7-1 mRNA after 7 and 14 days in high glucose compared with normal glucose (*P<0.05; **P<0.01, NG versus HG 7D and HG 14D; **P<0.01, HG 7D versus HG14D). (J) Similarly, Western blot analysis shows greater B7-1 expression in podocytes cultured in HG after 14 days compared with those cultured in NG. (K–M) Immunofluorescence analysis confirms B7-1 expression in podocytes after 7 and 14 days of HG (L and M), but not after NG (K), conditions. (N–P) B7-1 is expressed on podocytes as shown by colocalization with synaptopodin, an actin-associated protein. To determine the pathway linking HG and B7-1 upregulation, we tested the effect of AKT, GSK3, and PI3K inhibitors on B7-1 expression. (Q) Although the AKT (triciribine) and GSK3 (AR-A014418) inhibitors are ineffective in downregulating B7-1 expression, the pan-PI3K inhibitor quercetin inhibits B7-1 upregulation (***P<0.001, 10 and 100 µM quercetin versus HG). (R) Western blot analysis shows higher levels of phosphorylation of the p85 PI3K subunit and an increase in expression of the p110α subunit upon HG culture, confirming the increased activity of the PI3K pathway after high glucose exposure. The PI3K inhibitor quercetin reduces both p85 phosphorylation and p110α levels. (S) A more specific pan-PI3K inhibitor (LY29009) downregulates B7-1 expression as well (*P<0.01; ***P<0.001, HG versus LY29009 4 and 40 µM, respectively). Only the specific targeting of the p110α PI3K subunit with PIK-75 (4–40 nM), but not of p110β and p110γ with TGX-221 (5–50 nM) and AS605240 (5–50 nM) respectively, was able to downregulate HG-dependent B7-1 expression in HG-cultured podocytes (***P<0.001, HG versus PIK-75 4–40 nM). ab, antibody; PD-L1, programmed cell death ligand 1; PD-L2, programmed cell death ligand 2; ICOSL, inducible costimulator ligand; phospho, phosphorylated; GAPDH, glyceraldehyde-3-phosphate dehydrogenase.
Figure 4.
Figure 4.
B7-1 activation leads to abnormalities of podocyte morphology and motility. (A and B) Podocytes cultured for 14 days in HG, untreated, or treated with CTLA4-Ig or L6 (100 µg/ml) are harvested and stained with FITC-conjugated anti-mouse IgG. Unstained, untreated, and L6-treated podocytes are not differentially stained by the FITC-conjugated anti-mouse IgG, but increased anti-murine–IgG-FITC staining is evident in podocytes treated with CTLA4-Ig (**P<0.01; *P<0.05, anti-murine–IgG-FITC+CTLA4-Ig versus unstained, anti-murine–IgG-FITC untreated and anti-murine–IgG-FITC+L6, respectively). (C and D) CTLA4-Ig binding, but not L6, is confirmed by indirect immunofluorescence with anti-murine–IgG-FITC. (E1–E4, F1–F4, G1–G4) Morphologic analysis of podocytes cultured in NG shows normal cytoskeleton organization (E1, F1, and G1); however, after HG exposure, severe actin depolymerization (red), synaptopodin (red), and paxillin (green) degradation as well as activated α3β1 integrin (red) disruption are evident along with B7-1 upregulation (green) (E2, F2, and G2). CTLA4-Ig treatment (E4, F4, and G4), but not L6 (E3, F3, and G3), normalized most podocyte cytoskeleton abnormalities induced by HG. (H1, H2, I1, I2, and K) Podocytes exposed to HG for 48 hours display increased motility compared with podocytes cultured in NG (**P<0.01, NG versus HG). (I1, I2, J1, J2, and K) CTLA4-Ig therapy prevented podocyte migration (**P<0.01, HG versus CTLA4-Ig). (L1, L2, and M) HG-cultured podocytes show derangement of actin filaments compared with NG control podocytes (***P<0.001, NG versus HG). (M) CTLA4-Ig is able to reinstate stress fiber integrity (**P<0.01, HG versus CTLA4-Ig). Original magnification, ×400.
Figure 5.
Figure 5.
B7-1 genetic modulation impacts on podocyte morphology and survival. Podocytes are transduced with lentiviral vectors carrying either the B7-1 cDNA sequence (VVWP–B7-1 or B7-1–overexpressing podocytes) or a specific shRNA sequence (pLKO.1-shRNA or B7-1 knockdown podocytes). (A, B, E, and F) Successful transduction is assessed by FACS (A and E) and by Western blot analyses (B and F). (C1–C3 and D1–D3) Morphologically, VVWP–B7-1 podocytes showed a loss of synaptopodin staining (C2) with dilated reticulum cisternae (D2, red arrow) and glycogen particles (D2, white arrow) compared with WT (C1 and D1) and CTLA4-Ig–treated podocytes (C3 and D3). (G1–G3 and H1–H3) Downregulation of B7-1 using the pLKO.1-shRNA viral vector generates cell features comparable to WT podocytes with regard to synaptopodin degradation (G1–G3) and ultrastructural alterations (H1–H3). (I) VVWP–B7-1 podocytes display higher apoptotic events compared with WT podocytes (*P<0.05, WT versus VVWP–B7-1). (J) pLKO.1-shRNA podocytes show levels of apoptosis comparable to WT podocytes. (I and J) Apoptosis is unmodified in podocytes transduced with control lentiviral vectors. (K) The LPS-induced degradation of synaptopodin is prevented in B7-1 knockdown podocytes. (L1) Double labeling for actin (red) and B7-1 (green) shows well developed stress fibers and absence of B7-1 in WT podocytes. (L2 and L3) The LPS-induced upregulation of B7-1 and the loss of stress fibers (L2) are prevented in B7-1 knockdown (B7-1-shRNA) podocytes (L3). ab, antibody; IF, immunofluorescence; EM, electron microscopy; GAPDH, glyceraldehyde-3-phosphate dehydrogenase.
Figure 6.
Figure 6.
B7-1 immunofluorescence is performed in kidneys of two different murine models of DN. No B7-1 expression is observed in kidneys of control nondiabetic (Ctrl ND) heterozygous littermate db/db mice (A1 and B), whereas progressively increased B7-1 expression is noted in kidneys of 7-, 12- and 25-week-old db/db mice (A1–A4 and B) (*P<0.05; ***P<0.001, control versus 12 and 25 weeks, respectively; **P<0.01, 7 weeks versus 25 weeks). Db/db mice are randomly allocated to receive treatment with L6 (n=25) or CTLA4-Ig (n=25). (C) Significantly higher UAE levels are evident at 7, 12, and 25 weeks of age in db/db L6-treated mice and diabetic untreated db/db mice compared with controls (*P<0.05, control versus L6-treated mice and CTLA4-Ig–treated mice at 7 weeks; **P<0.01, control versus untreated and L6-treated mice at 12 weeks; ***P<0.001, control versus untreated and L6-treated mice at 25 weeks). On the contrary, UAE levels remain stable over time in CTLA4-Ig–treated mice (***P<0.001, CTLA4-Ig versus untreated and L6-treated mice at 25 weeks). (D1, D2, and E) Absent B7-1 expression is observed in control C57BL/6 mice (7 weeks of age) (D1 and E) and in 7-week-old hyperglycemic C57BL/6 mice immediately after streptozotocin injection (D2 and E). (D3 and D4 and E) An increase in B7-1 expression is detected in 12- and 16-week-old hyperglycemic C57BL/6 mice after streptozotocin injection (***P<0.001, control versus 12 and 16 weeks; ***P<0.001, 7 weeks versus 12 and 16 weeks). (F) Untreated diabetic C57BL/6 mice and L6-treated C57BL/6 mice show higher UAE at 12 and 16 weeks of age compared with control mice (**P<0.01, control versus untreated and L6-treated mice at 12 weeks; ***P<0.001, control versus untreated and L6-treated mice at 16 weeks). Conversely, UAE levels remained stable over time in CTLA4-Ig–treated mice (**P<0.01; *P<0.05, CTLA4-Ig versus untreated and L6-treated mice at 16 weeks, respectively). Kidney parenchyma immunofluorescence showed absence of tubular B7-1 expression (G1–G3) and colocalization of B7-1 with ZO-1 (H1–H3) in db/db mice, demonstrating the podocyte localization of B7-1. Low levels of mesangial expansion are detectable in control nondiabetic C57BL/6 mice at 7 and 25 weeks of age (#P<0.05, control versus all) (I1, I2, and I7) and in untreated db/db mice at 7 weeks of age (I3 and I7). (I3–I5 and I7) Conversely, increased mesangial expansion is evident at 25 weeks of age in untreated and L6-treated diabetic db/db mice compared with untreated db/db mice at 7 weeks of age (***P<0.001, db/db: untreated [7 weeks] versus untreated [25 weeks] and L6-treated mice). (I4–I7) CTLA4-Ig–treated diabetic db/db mice have lower mesangial expansion compared with untreated and L6-treated diabetic db/db mice at 25 weeks of age (**P<0.01; *P<0.05, CTLA4-Ig–treated versus untreated [25 weeks] and L6-treated mice, respectively). Original magnification, ×1000 in G1–G3 and H1–H3; ×250 in I4–I7.
Figure 7.
Figure 7.
Morphologic and immunofluorescence analyses are performed on kidney samples obtained from untreated 7-week-old or from 25-week-old L6-treated mice or CTLA4-Ig–treated mice. Collagen I deposition is increased in L6-treated compared with CTLA4-Ig–treated and 7-week-old untreated db/db mice (**P<0.01, L6-treated mice at 25 weeks versus 7 weeks) (A1–A4), nephrin (*P<0.05, L6-treated mice at 25 weeks versus CTLA4-Ig–treated mice at 25 weeks) (B1–B4), and ZO-1 (*P<0.05, L6-treated mice at 25 weeks versus CTLA4-Ig–treated mice at 25 weeks) (C1–C4) expression is preserved in CTLA4-Ig–treated mice compared with those treated with L6. (D1–D4) Increased expression of glomerular active caspase 3 is also evident in L6-treated mice compared with CTLA4-Ig–treated mice and 7-week-old untreated db/db mice (*P<0.05, L6-treated mice at 25 weeks versus CTLA4-Ig–treated mice at 25 weeks and untreated mice at 7 weeks). (E1–E4) TUNEL staining shows higher levels of apoptosis in 25-week-old L6-treated mice compared with 7-week-old untreated mice (*P<0.05, L6-treated mice at 25 weeks versus untreated mice at 7 weeks). (F and G) Serum glucose and creatinine levels are not different between 12 and 25 weeks of age between L6-treated mice and CTLA4-Ig–treated db/db mice (P=NS). (H–J) Peripheral levels of Th1 cytokines are increased over time in both L6-treated mice (*P<0.05, IL-2: L6-treated mice at 25 weeks versus 12 weeks; ***P<0.001; **P<0.01, IFN-γ: L6-treated mice at 25 weeks versus 12 and 7 weeks, respectively) and CTLA4-Ig–treated db/db mice (*P<0.05, IL-2: CTLA4-Ig–treated mice at 25 weeks versus 12 weeks; *P<0.05, IFN-γ: CTLA4-Ig–treated mice at 25 weeks versus 12 weeks; *P<0.05, TNF-α: CTLA4-Ig–treated mice at 25 weeks versus 12 weeks). TUNEL, terminal deoxynucleotidyl transferase–mediated digoxigenin-deoxyuridine nick-end labeling; nucl, nuclei; glom, glomeruli. Original magnification, ×630 in A1–A4, B1–B4, C1–C4; ×400 D1–D4.
Figure 8.
Figure 8.
Proposed model to explain the role of B7-1 and CTLA4-Ig action in DN.

References

    1. Olshansky SJ, Passaro DJ, Hershow RC, Layden J, Carnes BA, Brody J, Hayflick L, Butler RN, Allison DB, Ludwig DS: A potential decline in life expectancy in the United States in the 21st century. N Engl J Med 352: 1138–1145, 2005 - PubMed
    1. Tirosh A, Shai I, Tekes-Manova D, Israeli E, Pereg D, Shochat T, Kochba I, Rudich A, Israeli Diabetes Research Group : Normal fasting plasma glucose levels and type 2 diabetes in young men. N Engl J Med 353: 1454–1462, 2005 - PubMed
    1. Fiorina P, Folli F, Bertuzzi F, Maffi P, Finzi G, Venturini M, Socci C, Davalli A, Orsenigo E, Monti L, Falqui L, Uccella S, La Rosa S, Usellini L, Properzi G, Di Carlo V, Del Maschio A, Capella C, Secchi A: Long-term beneficial effect of islet transplantation on diabetic macro-/microangiopathy in type 1 diabetic kidney-transplanted patients. Diabetes Care 26: 1129–1136, 2003 - PubMed
    1. Nakamura T, Ushiyama C, Suzuki S, Hara M, Shimada N, Ebihara I, Koide H: Urinary excretion of podocytes in patients with diabetic nephropathy. Nephrol Dial Transplant 15: 1379–1383, 2000 - PubMed
    1. Reiser J, von Gersdorff G, Loos M, Oh J, Asanuma K, Giardino L, Rastaldi MP, Calvaresi N, Watanabe H, Schwarz K, Faul C, Kretzler M, Davidson A, Sugimoto H, Kalluri R, Sharpe AH, Kreidberg JA, Mundel P: Induction of B7-1 in podocytes is associated with nephrotic syndrome. J Clin Invest 113: 1390–1397, 2004 - PMC - PubMed

Publication types