. 2014 Jul;25(7):1401-7.
doi: 10.1681/ASN.2013070763. Epub 2014 Mar 27.

Urinary podocyte microparticles identify prealbuminuric diabetic glomerular injury

Affiliations

Urinary podocyte microparticles identify prealbuminuric diabetic glomerular injury

Dylan Burger et al. J Am Soc Nephrol. 2014 Jul.

Abstract

Microparticles (MPs) are small (0.1-1.0 µm) vesicles shed from the surface of cells in response to stress. Whether podocytes produce MPs and whether this production reflects glomerular injury are unclear. We examined MP formation in cultured human podocytes (hPODs) and diabetic mice. hPODs were exposed to cyclical stretch, high glucose (HG; 25 mM), angiotensin II, or TGF-β. Urinary podocyte MPs were assessed in three mouse models of diabetic nephropathy: streptozotocin (STZ)-treated, OVE26, and Akita mice. Cyclic stretch and HG increased MP release as assessed by flow cytometry (P<0.01 and P<0.05, respectively, versus controls). Inhibition of Rho-kinase (ROCK) with fasudil blocked HG-induced podocyte MP formation. STZ-treated (8 weeks) mice exhibited increased urinary podocyte MPs compared with age-matched nondiabetic mice. Similarly, 16-week-old OVE26 mice had elevated levels of urinary podocyte MPs compared with wild-type littermates (P<0.01). In 1 week post-STZ-treated and 6- and 12-week-old Akita mice, urinary podocyte MPs increased significantly compared with those MPs in nondiabetic mice, despite normal urinary albumin levels. Our results indicate that podocytes produce MPs that are released into urine. Podocyte-derived MPs are generated by exposure to mechanical stretch and high glucose in vitro and could represent early markers of glomerular injury in diabetic nephropathy.


Figures

Figure 1.
Figure 1.
Microparticles are released from podocytes and are detected in diabetic urine. (A and B) NTA showing the distribution of extracellular vesicles derived from (A) media and (B) urine samples (n=5). Mean and median vesicle size as well as size range for microparticles (100–1000 nm) are indicated. (C–F) Representative traces from flow cytometry analysis of microparticles derived from media and urine samples. Samples were stained with Annexin V–Alexa 647 alone (media samples) or a combination of Annexin V–Alexa 647 and PE-podocalyxin (urine samples). C and E are representative autofluorescent controls. (D) Podocyte MPs in media samples were identified by Annexin V positivity, which is seen as a rightward shift from R1 to R2. (F) Total MPs in urine samples were identified by Annexin V positivity, and then, podocyte MPs were identified in Annexin V+ve events as being positive for PE-podocalyxin, which is seen as a shift from R1 to R4. R, region; SSC, side scatter. (G and H) Transmission electron micrographs of microparticle fractions from the media of cultured hPODs. H shows a close-up view of MPs with clear intact membrane and a size of 0.1–1.0 µm. Original magnification, ×50,000.
Figure 2.
Figure 2.
High glucose and mechanical stretch induce podocyte microparticle formation in vitro. (A) Cultured hPODs released MPs into media in a time-dependent fashion. Data are mean±SEM (n=3). *P<0.01 versus 0 hours; **P<0.001 versus 0 hours. (B) Effects of high glucose and cyclic stretch on MP formation by cultured hPODS. Cells were exposed to high glucose (25 mM d-glucose), normal glucose (control; 5 mM), or mannitol-treated controls for osmolality (mannitol; 5 mM d-glucose+20 mM d-mannitol) and/or subjected to cyclic stretch for 24 hours. MPs were isolated from media by differential centrifugation, and Annexin V+ve MPs were quantified by flow cytometry. To account for differences in cell numbers, MP numbers were normalized to protein levels. Exposure to high glucose significantly increased podocyte MP formation compared with mannitol-treated or untreated controls at 24 hours. Similarly, cyclic stretch increased podocyte MP formation at 24 hours. However, the combination of both high glucose and cyclic stretch did not result in additive or synergistic effects on MP formation. Data are mean±SEM (n=5–8). *P<0.01 versus no stretch control; ΔP<0.01 versus no stretch mannitol treatment; +P<0.01 versus stretch control. (C) Effects of Ang II and TGF-β on MP formation by cultured hPODS. Cells were treated with Ang II (500 nM) or TGF-β (5 ng/ml) for 24 hours. Data are mean±SEM (n=3). (D) Effects of ROCK inhibition on high glucose-induced podocyte MP formation in vitro. Cells were exposed to high glucose, normal glucose, or mannitol-treated controls for osmolality in the presence and absence of the ROCK inhibitor fasudil (10 μM). *P<0.01 versus manitol; ΔΔP<0.001 versus high glucose (n=3).
Figure 3.
Figure 3.
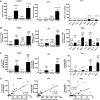
Urinary podocyte microparticles appear in diabetic mice in advance of albuminuria. (A) Urinary ACr ratios from 4- and 16-week-old OVE26, 1- and 8-week post-STZ–treated, and 6- to 12-week-old Akita diabetic mice. (B and C) MPs were isolated from urine by differential centrifugation, quantified by flow cytometry for Annexin V and podocalyxin positivity, and data-expressed as the number of MPs per milligram of creatinine. (B) Total MPs were identified by Annexin V positivity alone, and (C) podocyte MPs were identified by positivity for Annexin V and podocalyin. No significant differences were identified in between-group comparisons for total MPs. Values above error bars represent mean±SEM. *P<0.05; **P<0.01 versus respective WT Ctrl (n=5–9). +P<0.01; +++P<0.001 versus respective Ctrl (n=4–18). (D) Linear regression of correlation between urinary podocyte-derived MPs and urinary ACr in OVE26 (n=25; P<0.001), STZ-treated (n=30; P<0.001), and Akita (n=32; P<0.01) diabetic mice. r2 and P values are indicated on graphs. Ctrl, control; WT, wild type.
Figure 4.
Figure 4.
Podoplanin-positive microparticles are detectable in diabetic mouse urine. MPs were isolated from urine by differential centrifugation, quantified by flow cytometry for Annexin V and podoplanin positivity, and data-expressed as the number of MPs per milligram of creatinine. *P<0.05 versus WT (n=4–5).

Comment in

  • Tell-tale signs of perturbed podocytes.
    Sharma K. Sharma K. J Am Soc Nephrol. 2014 Jul;25(7):1367-9. doi: 10.1681/ASN.2014020200. Epub 2014 Mar 27. J Am Soc Nephrol. 2014. PMID: 24676633 Free PMC article. No abstract available.

References

    1. Michaud JL, Kennedy CR: The podocyte in health and disease: Insights from the mouse. Clin Sci (Lond) 112: 325–335, 2007 - PubMed
    1. Stitt-Cavanagh E, MacLeod L, Kennedy C: The podocyte in diabetic kidney disease. ScientificWorldJournal 9: 1127–1139, 2009 - PMC - PubMed
    1. Meyer TW, Bennett PH, Nelson RG: Podocyte number predicts long-term urinary albumin excretion in Pima Indians with Type II diabetes and microalbuminuria. Diabetologia 42: 1341–1344, 1999 - PubMed
    1. Nakamura T, Ushiyama C, Suzuki S, Hara M, Shimada N, Ebihara I, Koide H: Urinary excretion of podocytes in patients with diabetic nephropathy. Nephrol Dial Transplant 15: 1379–1383, 2000 - PubMed
    1. Pagtalunan ME, Miller PL, Jumping-Eagle S, Nelson RG, Myers BD, Rennke HG, Coplon NS, Sun L, Meyer TW: Podocyte loss and progressive glomerular injury in type II diabetes. J Clin Invest 99: 342–348, 1997 - PMC - PubMed

Publication types