. 2014 Sep;25(9):2003-15.
doi: 10.1681/ASN.2013090945. Epub 2014 Mar 27.

Immunosuppressive effects of erythropoietin on human alloreactive T cells

Affiliations

Immunosuppressive effects of erythropoietin on human alloreactive T cells

Paolo Cravedi et al. J Am Soc Nephrol. 2014 Sep.

Abstract

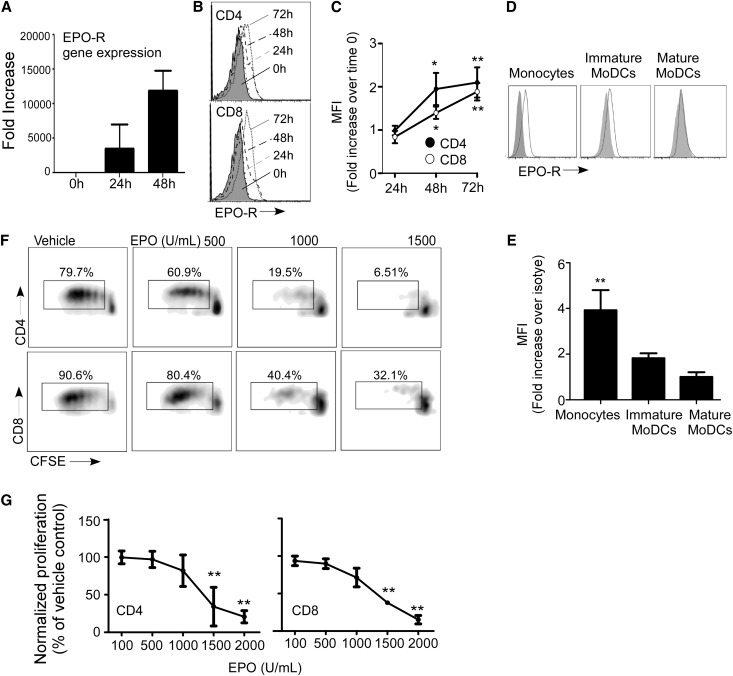
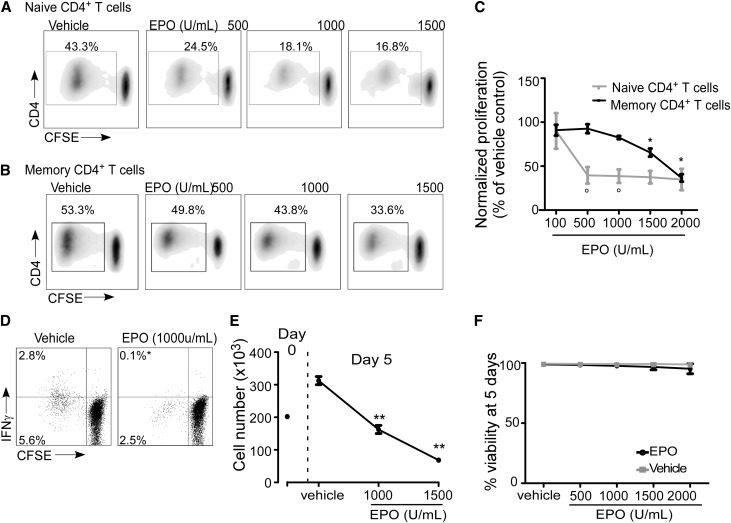
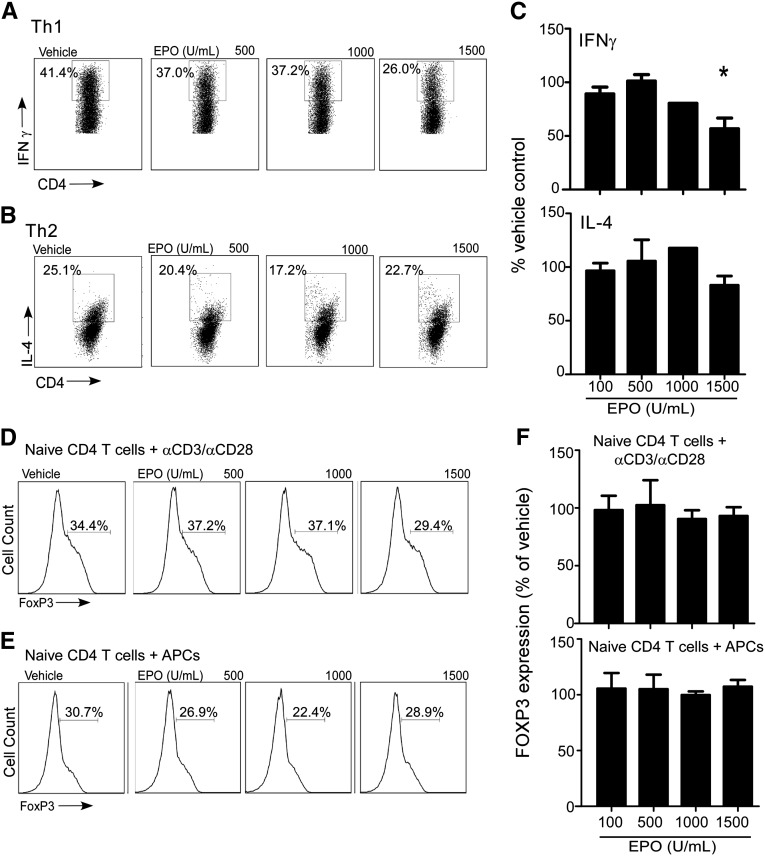
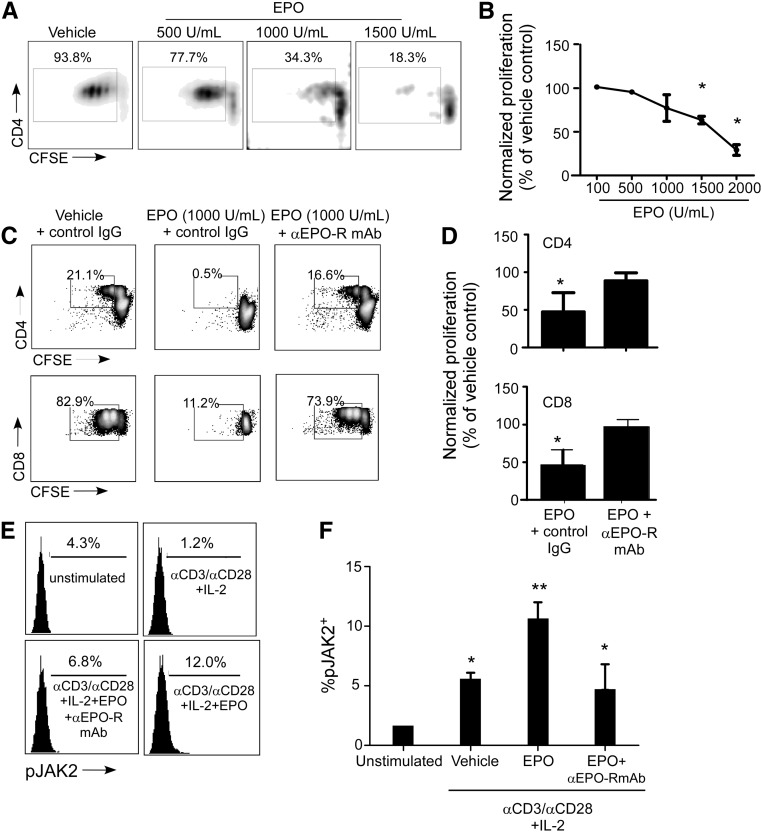
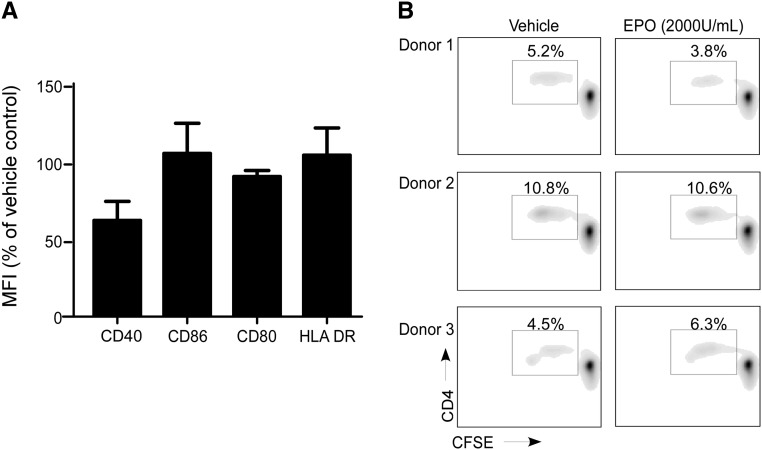
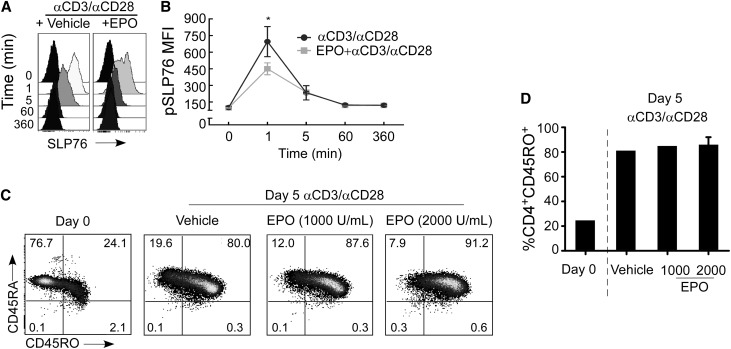
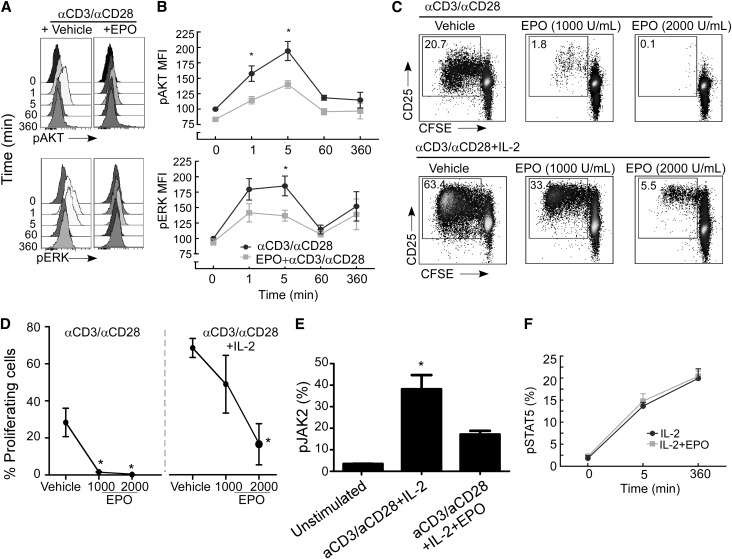
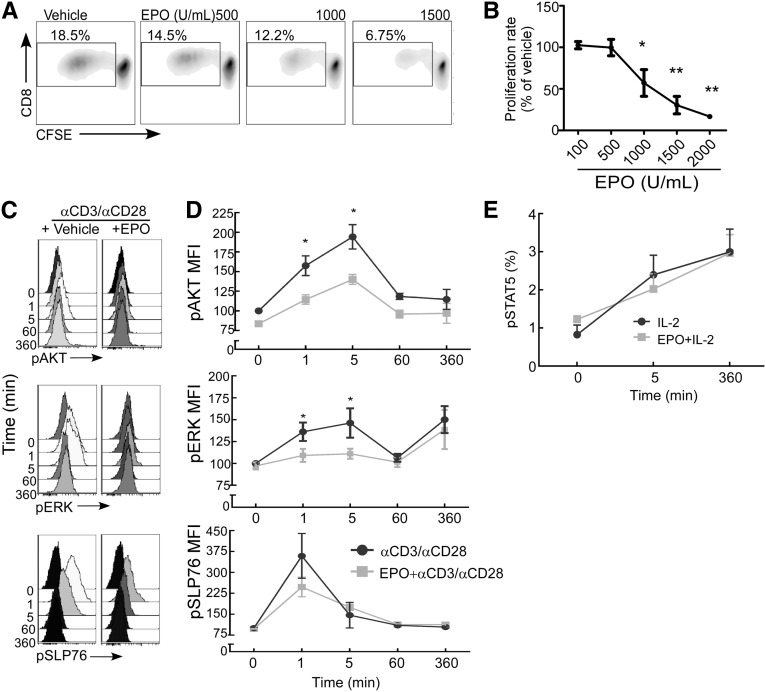
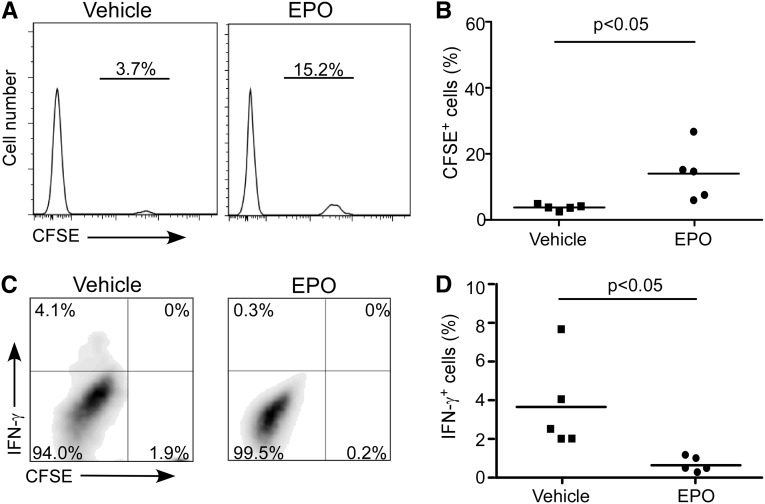
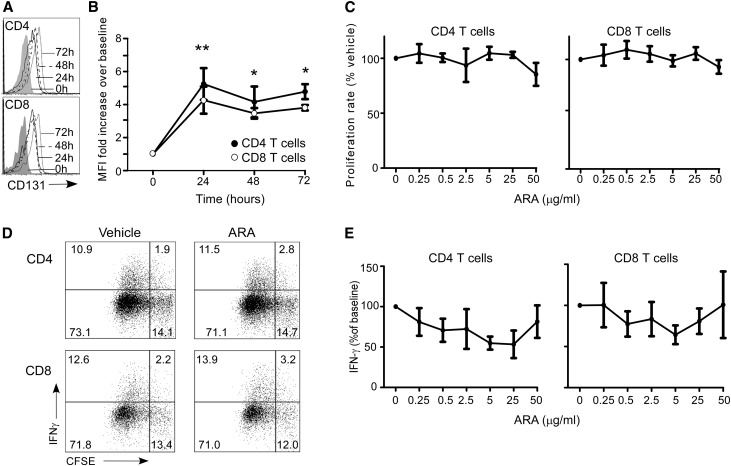
Correction of anemia with erythropoietin (EPO) is associated with improved kidney transplant outcomes. Emerging evidence, predominantly from animal models, indicates that these observations may be erythropoiesis-independent and that EPO exhibits immunosuppressive properties. We examined the effects of EPO on human T-cell alloimmunity by first documenting that CD4(+) and CD8(+) T cells express EPO receptor (EPO-R) on their surfaces. In mixed lymphocyte reactions, EPO induced a dose-dependent decrease in allogeneic CD4(+) T-cell proliferation (EPO 1000 U/ml: 44.6%±22.9% of vehicle, P<0.05; 2000 U/ml: 11.1%±4% of vehicle, P<0.001) without inducing cell death. The effects required signals transmitted directly through the EPO-R expressed on T cells, resulting in diminished Th1 differentiation without effects on regulatory T-cell induction. Mechanistic studies revealed that EPO prevented IL-2-induced proliferation by uncoupling IL-2 receptor signaling, inhibiting phosphorylation of the intracellular intermediaries AKT and extracellular signal-regulated kinase that are known to mediate T-cell expansion. EPO treatment reduced expansion of human naïve CD4(+) T cells after adoptive transfer into NOD scid γc(null) mouse recipients, verifying the effects in vivo. Although activated T cells expressed CD131, an alternative EPO receptor, addition of a specific CD131 agonist peptide, ARA290, did not alter T-cell proliferation or cytokine production. Our findings link EPO-R signaling on T cells to inhibition of T-cell immunity, providing one mechanism that could explain the observed protective effects of EPO in kidney transplant recipients.


Figures

Figure 1.
Figure 1.
EPO inhibits T-cell expansion. (A) Kinetics of EPO-R gene expression in total T lymphocytes after anti-CD3/anti-CD28 stimulation as assessed by quantitative RT-PCR (means+SEMs; two experiments in triplicate). (B) Representative flow cytometry histograms and (C) quantified changes in mean fluorescence intensities (MFIs) versus baseline of EPO-R expression on the cell surface of CD4+ and CD8+ T lymphocytes after 24, 48, or 72 hours of anti-CD3/anti-CD28 stimulation (means+SEMs; eight experiments). (D) Representative flow cytometry histograms and (E) MFI (fold increase over isotype) of EPO-R on monocytes and immature and mature moDCs (means+SEMs; four experiments). (F) Representative plots and (G) quantitation of human PBMCs stimulated with anti-CD3/anti-CD28 gated on CD4+ or CD8+ T cells in the presence of EPO at the indicated doses (or vehicle control; means+SEMs; four experiments). *P<0.05; **P<0.01 versus 0 hours, isotype, or vehicle.
Figure 2.
Figure 2.
EPO inhibits CD4+ T-cell proliferation in a mixed lymphocyte reaction. Purified human naïve and memory CD4+ T cells were CFSE-labeled and cultured with allogeneic (mature) moDCs. (A and B) Representative flow cytometry histograms and (C) quantified results of CFSE dilution as a measure of cell proliferation in the presence of EPO at the indicated doses (or vehicle control; means+SEMs; seven experiments). (D) Representative flow cytometry histograms of IFN-γ production in CD4+ T cells cultured in MLRs with or without EPO and quantified results (percentages in the upper left are means of three separate experiments). *P<0.05. (E) Per-well cell count at day 0 and the end of the 5-day MLR culture. (F) Percent viability of CD4+ T cells at the end of the MLR in the presence of vehicle or EPO at indicated doses (means+SEMs; four experiments). *P<0.05; **P<0.01 versus vehicle. °P<0.05 versus naïve CD4+ T cells at the same EPO dose.
Figure 3.
Figure 3.
EPO reduces Th1 but not Th2 polarization or Treg induction. Representative flow cytometry histograms and quantified results (n=5 experiments) of the expression of (A and C, upper panel) IFN-γ and (B and C, lower panel) IL-4 in naïve CD4+ T cells cultured under Th1- (means+SEMs; four experiments) or Th2-polarizing conditions (means+SEMs; six experiments), respectively, ±EPO at the indicated doses. (D–F) Representative flow cytometry histograms of FoxP3+ expression in naïve CD4+ T cells cultured with IL-2 and TGF-β±EPO and stimulated with (D) anti-CD3/anti-CD28 coated beads or (E) allogeneic moDCs. (F) Quantitation of the results (means+SEMs) for five individual experiments. *P<0.05 versus vehicle.
Figure 4.
Figure 4.
Inhibitory effects of EPO on T-cell proliferation are mediated through the EPO-R. (A) Representative flow cytometry histograms of enriched naïve CD4+ T cells stimulated with anti-CD3/anti-CD28 (no APCs) ±EPO at the indicated doses. (B) Quantified results of three separate experiments as performed in A. Proliferation rates in control wells from three donors were different, and therefore, the data are presented as means±SEMs of percent proliferation relative to the vehicle control. *P<0.05 versus vehicle. (C) Representative flow cytometry histograms and (D) quantified results of (upper panel) CD4+ and (lower panel) CD8+ T cells activated with anti-CD3/anti-CD28±EPO (1000 U/ml)±anti–EPO-R blocking antibody (5 μg/ml). Data in D are means+SEMs (four experiments; represented as percent proliferation relative to vehicle control). *P<0.05 versus vehicle. (E) Representative flow cytometry histograms and (F) quantified results of pJAK2 levels in unstimulated and anti-CD3/anti-CD28+IL-2–activated T cells±EPO (200 U/ml)±anti–EPO-R blocking antibody. Data in F are means+SEMs (four individual experiments). *P<0.05 versus unstimulated; **P<0.05 versus vehicle.
Figure 5.
Figure 5.
EPO does not affect DC phenotype or function. (A) moDCs were induced in the presence of EPO (2000 U/ml) or vehicle control, analyzed for the cell surface markers indicated by flow cytometry, and reported as percentage of the mean fluorescence intensity (MFI) of each marker compared with vehicle-treated control DCs. Expression of CD40 was modestly but significantly lower (P<0.05) in the EPO-treated moDCs. The other three markers were not different between EPO-treated and vehicle-treated controls. (B) Proliferation of naïve CD4+ T cells in response to allogeneic moDCs pretreated with EPO or vehicle for 7 days (but not added in the MLR). Data are representative of three independent experiments using different donors. Similar results were obtained using memory CD4+ or total CD8+ T cells as responders (not shown).
Figure 6.
Figure 6.
EPO does not affect early TCR activation or CD45RO expression. (A and B) pSLP76. Representative (A) flow cytometry histograms and (B) quantified kinetics of pSLP76 in anti-CD3/anti-CD28–stimulated CD4+ cells±EPO (means+SEMs; three experiments). *P<0.05 versus EPO treated at 1 minute. (C) Representative CD45RA and CD45RO expression on enriched naïve CD4+ T cells (day 0) and after 5 days of stimulation with anti-CD3/anti-CD28±EPO at the doses indicated. (D) Quantified percentages (means±SEMs; three separate experiments) of CD45RO+ CD4+ T cells on day 0 or after 5 days of stimulation in the presence or absence of EPO. MFI, mean fluorescence intensity.
Figure 7.
Figure 7.
EPO uncouples IL-2R signaling in anti-CD3/anti-CD28–stimulated CD4+ T cells. Representative (A) kinetic flow cytometry histograms and (B) quantified results of pERK and pAKT expression in anti-CD3/anti-CD28–stimulated CD4+ cells±EPO. Data in B are means±SEMs (three individual experiments). *P<0.05 versus time 0 (anti-CD3/anti-CD28 alone) and versus anti-CD3/anti-CD28+EPO tested at 1 and 5 minutes. (C) Representative flow cytometry histograms of CD4+ T cells activated with (upper panel) anti-CD3/anti-CD28 or (lower panel) anti-CD3/anti-CD28+recombinant IL-2 (0.5 μg/ml)±EPO. (D) Quantified results (means and SEMs) of one of four representative experiments, all of which showed similar results. *P<0.05 versus vehicle. (E) Representative flow cytometry histograms of pAKT in CD4+ T cells stimulated with anti-CD3/anti-CD28±IL-2±EPO at 6 hours after stimulation. Results shown in each panel are means of three experiments. *P<0.05 versus unstimulated. (F) Quantitation of kinetics of pSTAT5 in anti-CD3/anti-CD28+IL-2–stimulated CD4+±EPO (means+SEMs; three experiments). *P<0.05 versus vehicle.
Figure 8.
Figure 8.
EPO inhibits proliferation of CD8+ T cells in response to anti-CD3/anti-CD28 stimulation. (A) Representative flow cytometry histograms of CD8+ T cells and (B) quantified results of CFSE dilution as a measure of cell proliferation in response to anti-CD3/anti-CD28 stimulation±EPO at the indicated doses (means+SEMs; three experiments). *P<0.05; **P<0.01 versus vehicle. (C) Representative flow cytometry histograms and (D) quantified kinetic results of pSLP76, pERK, and pAKT in anti-CD3/anti-CD28–stimulated CD8+ cells±EPO. Data in D represent means and SEMs of three individual experiments. *P<0.05 versus time 0 (anti-CD3/anti-CD28 alone) and versus anti-CD3/anti-CD28+EPO tested at 1 and 5 minutes. (E) Quantitation and kinetics of STAT5 phosphorylation in anti-CD3/anti-CD28+IL-2–stimulated CD8+±EPO (means+SEMs; three experiments). MFI, mean fluorescence intensity.
Figure 9.
Figure 9.
EPO inhibits naïve CD4+ T-cell expansion in NOD scid γcnull mice. Five million CD45RA+CD4+ naïve human T cells were labeled with CFSE and injected into NOD scid γcnull mice. (A) Representative histograms and (B) data quantitation of remaining CFSE+ naïve CD4+ T cells 3 days after injection in NOD scid γcnull mice treated with EPO (n=5) or vehicle control (n=5). (C) Representative plots and (D) data quantitation of IFN-γ production by the same CD4+ T cells.
Figure 10.
Figure 10.
Targeting CD131 does not affect T-cell expansion or IFN-γ production. (A and B) Representative (A) flow cytometry histograms and (B) MFI of CD131 expression on the cell surface of freshly isolated peripheral blood CD4+ and CD8+ T cells and after 24, 48, or 72 hours (means+SEMs; three experiments). *P<0.05 versus time 0; **P<0.01 versus time 0 for both CD4+ and CD8+ T cells. (C) Proliferation of CFSE-labeled naïve CD4+ and CD8+ T cells activated with anti-CD3/anti-CD28 cultured with vehicle or ARA290 at indicated doses (means+SEMS; five experiments). Representative (D) flow cytometry plots and (E) quantification of IFN-γ production in CD4+ and CD8+ T cells activated with anti-CD3/anti-CD28 cultured with vehicle or ARA290 at indicated doses (means of five separate experiments).

Comment in

References

    1. Nangaku M: Chronic hypoxia and tubulointerstitial injury: A final common pathway to end-stage renal failure. J Am Soc Nephrol 17: 17–25, 2006 - PubMed
    1. Choukroun G, Kamar N, Dussol B, Etienne I, Cassuto-Viguier E, Toupance O, Glowacki F, Moulin B, Lebranchu Y, Touchard G, Jaureguy M, Pallet N, Le Meur Y, Rostaing L, Martinez F, CAPRIT Study Investigators : Correction of postkidney transplant anemia reduces progression of allograft nephropathy. J Am Soc Nephrol 23: 360–368, 2012 - PMC - PubMed
    1. Pallet N, Bouvier N, Legendre C, Beaune P, Thervet E, Choukroun G, Martinez F: Antiapoptotic properties of recombinant human erythropoietin protects against tubular cyclosporine toxicity. Pharmacol Res 61: 71–75, 2010 - PubMed
    1. Rocchetta F, Solini S, Mister M, Mele C, Cassis P, Noris M, Remuzzi G, Aiello S: Erythropoietin enhances immunostimulatory properties of immature dendritic cells. Clin Exp Immunol 165: 202–210, 2011 - PMC - PubMed
    1. Cassis P, Gallon L, Benigni A, Mister M, Pezzotta A, Solini S, Gagliardini E, Cugini D, Abbate M, Aiello S, Rocchetta F, Scudeletti P, Perico N, Noris M, Remuzzi G: Erythropoietin, but not the correction of anemia alone, protects from chronic kidney allograft injury. Kidney Int 81: 903–918, 2012 - PubMed

Publication types

MeSH terms

LinkOut - more resources