

Estimating genome-wide significance for whole-genome sequencing studies
- PMID: 24676807
- PMCID: PMC4489336
- DOI: 10.1002/gepi.21797
Estimating genome-wide significance for whole-genome sequencing studies
Abstract
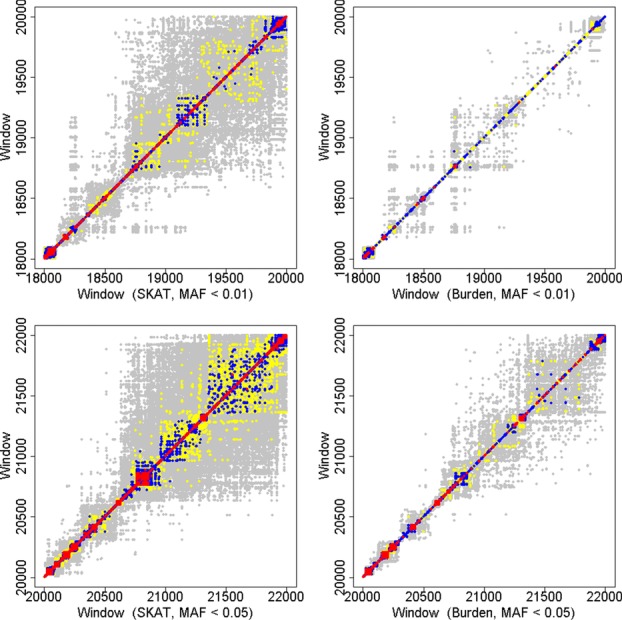
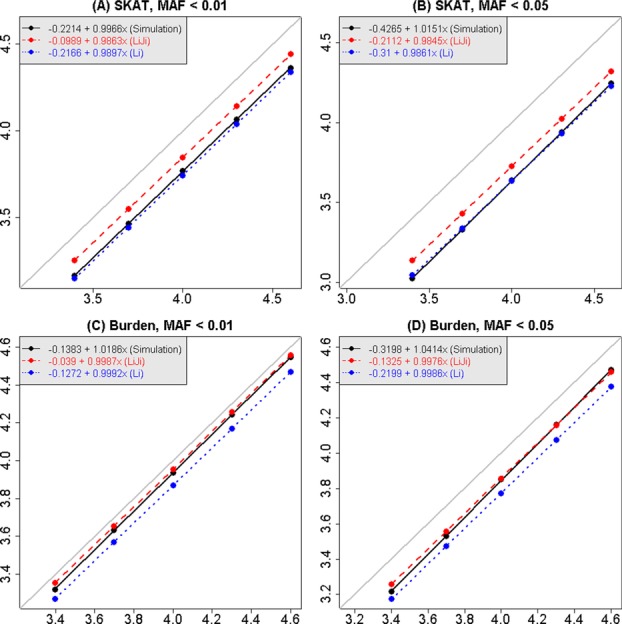
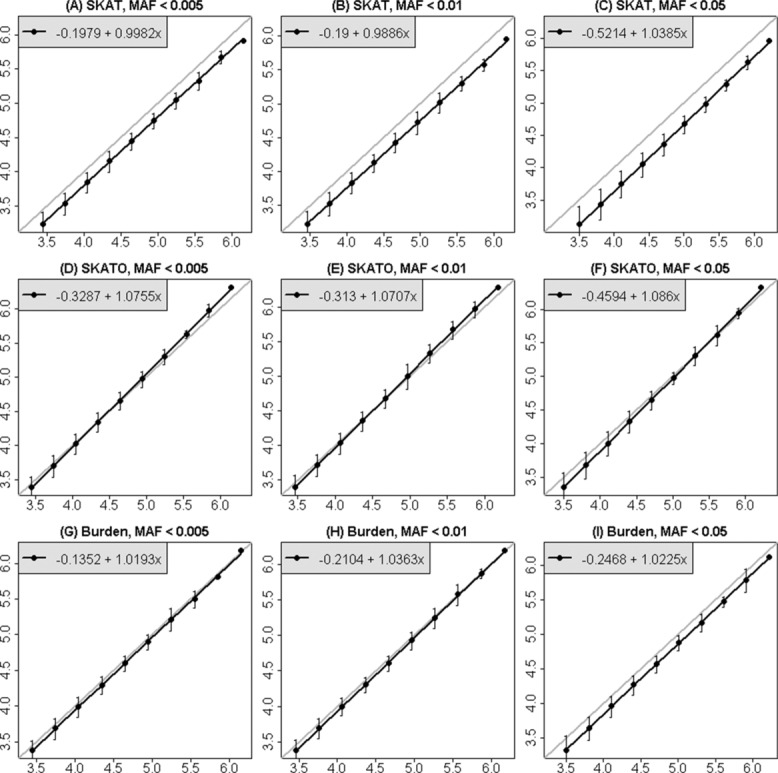
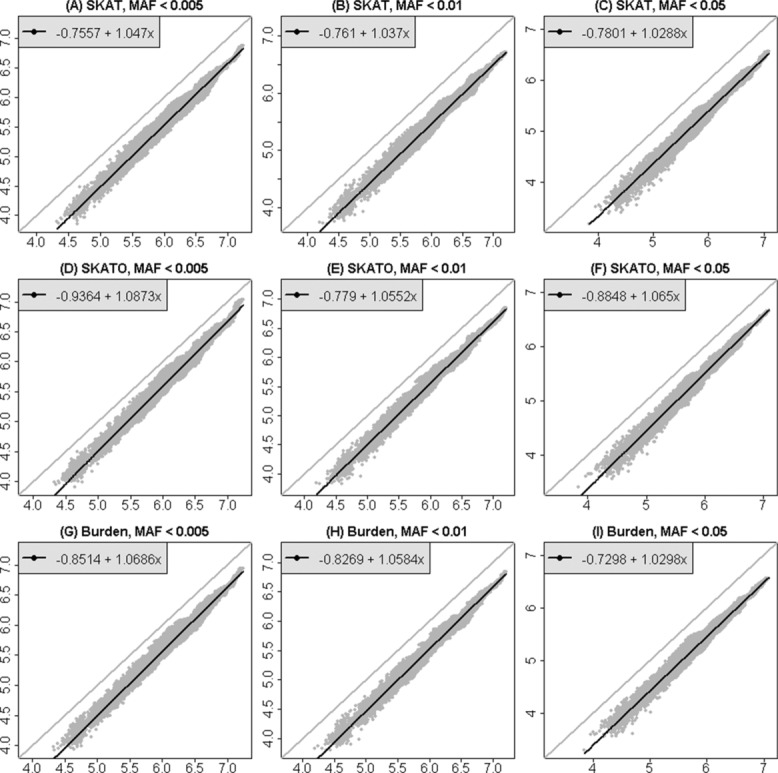
Although a standard genome-wide significance level has been accepted for the testing of association between common genetic variants and disease, the era of whole-genome sequencing (WGS) requires a new threshold. The allele frequency spectrum of sequence-identified variants is very different from common variants, and the identified rare genetic variation is usually jointly analyzed in a series of genomic windows or regions. In nearby or overlapping windows, these test statistics will be correlated, and the degree of correlation is likely to depend on the choice of window size, overlap, and the test statistic. Furthermore, multiple analyses may be performed using different windows or test statistics. Here we propose an empirical approach for estimating genome-wide significance thresholds for data arising from WGS studies, and we demonstrate that the empirical threshold can be efficiently estimated by extrapolating from calculations performed on a small genomic region. Because analysis of WGS may need to be repeated with different choices of test statistics or windows, this prediction approach makes it computationally feasible to estimate genome-wide significance thresholds for different analysis choices. Based on UK10K whole-genome sequence data, we derive genome-wide significance thresholds ranging between 2.5 × 10(-8) and 8 × 10(-8) for our analytic choices in window-based testing, and thresholds of 0.6 × 10(-8) -1.5 × 10(-8) for a combined analytic strategy of testing common variants using single-SNP tests together with rare variants analyzed with our sliding-window test strategy.
Keywords: effective number of independent tests; genome-wide significance; multiple testing; rare-variant analysis; region-based tests; sliding windows; whole-genome sequencing.
© 2014 WILEY PERIODICALS, INC.
Figures
References
-
- Cheverud JM. A simple correction for multiple comparisons in interval mapping genome scans. Heredity (Edinb) 2001;87(Pt 1):52–58. - PubMed
-
- Gao X, Starmer J, Martin ER. A multiple testing correction method for genetic association studies using correlated single nucleotide polymorphisms. Genet Epidemiol. 2008;32(4):361–369. - PubMed
-
- Lee S, Emond MJ, Bamshad MJ, Barnes KC, Rieder MJ, Nickerson DA, Team NGESP-ELP, Christiani DC, Wurfel MM, Lin X. Optimal unified approach for rare-variant association testing with application to small-sample case-control whole-exome sequencing studies. Am J Hum Genet. 2012;91(2):224–237. - PMC - PubMed
Publication types
MeSH terms
Grants and funding
LinkOut - more resources
Full Text Sources
Other Literature Sources
Molecular Biology Databases
