. 2014 May;165(1):62-75.
doi: 10.1104/pp.114.238667. Epub 2014 Mar 27.

Evolutionary convergence of cell-specific gene expression in independent lineages of C4 grasses

Affiliations

Evolutionary convergence of cell-specific gene expression in independent lineages of C4 grasses

Christopher R John et al. Plant Physiol. 2014 May.

Abstract

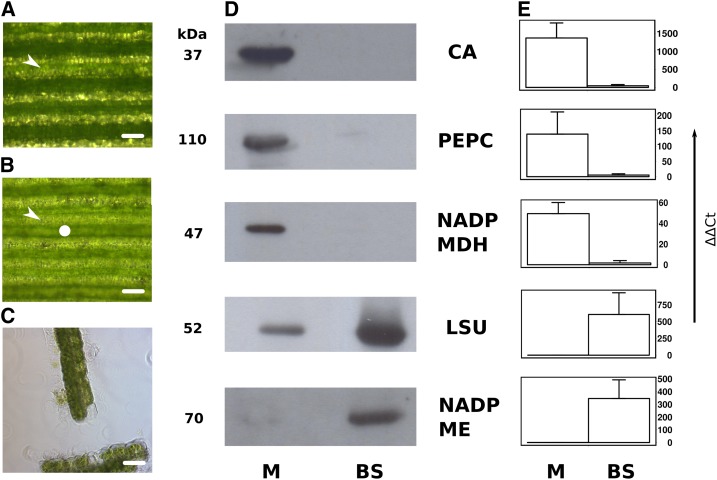
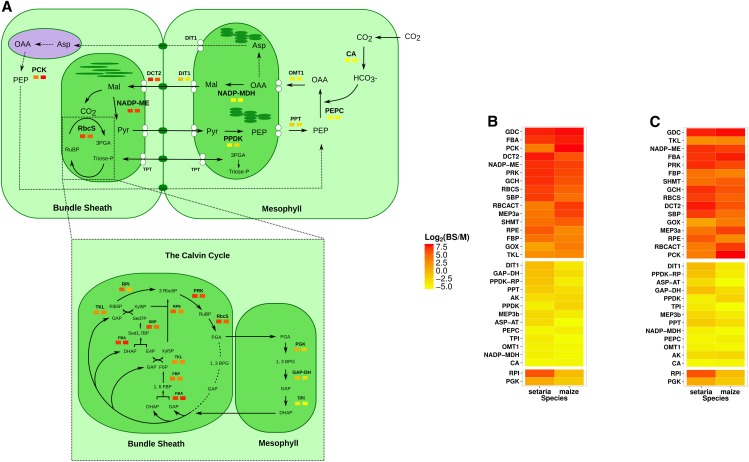
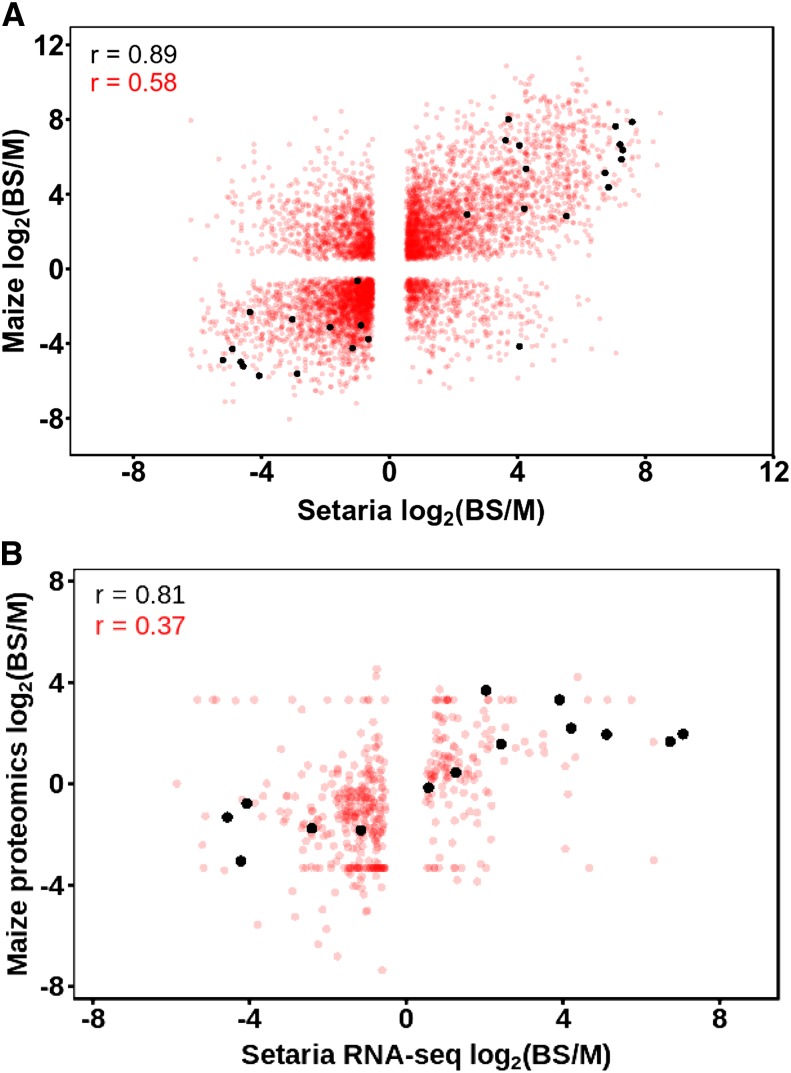
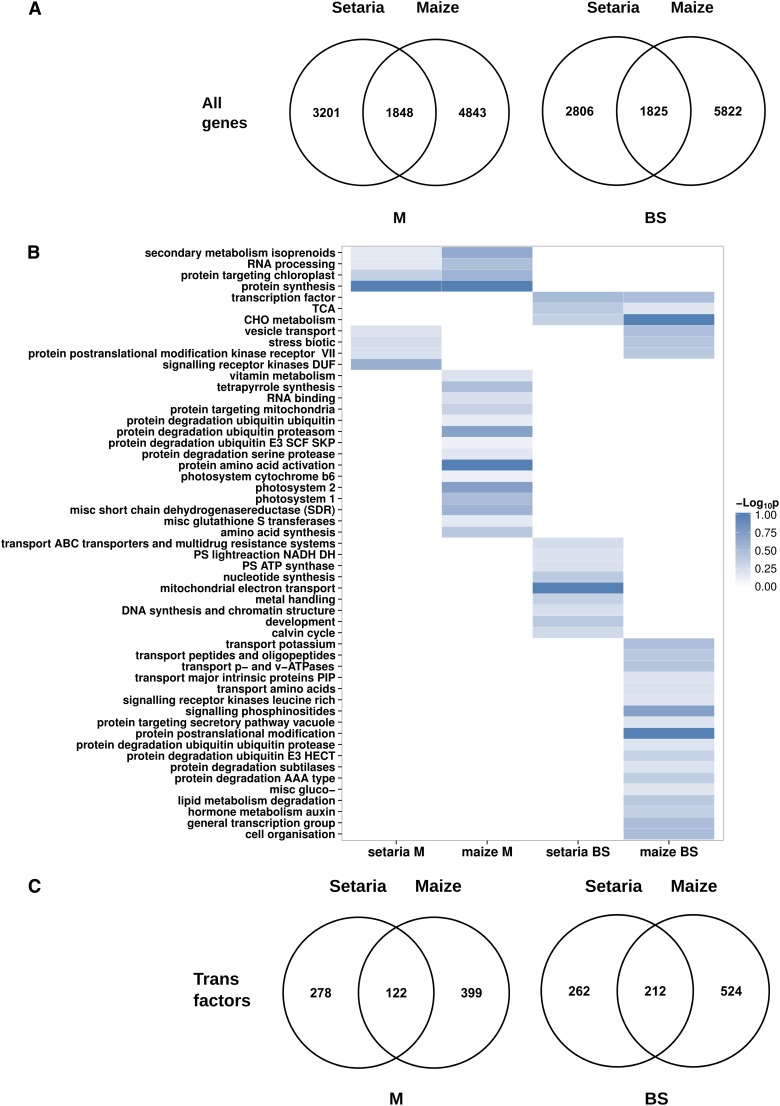
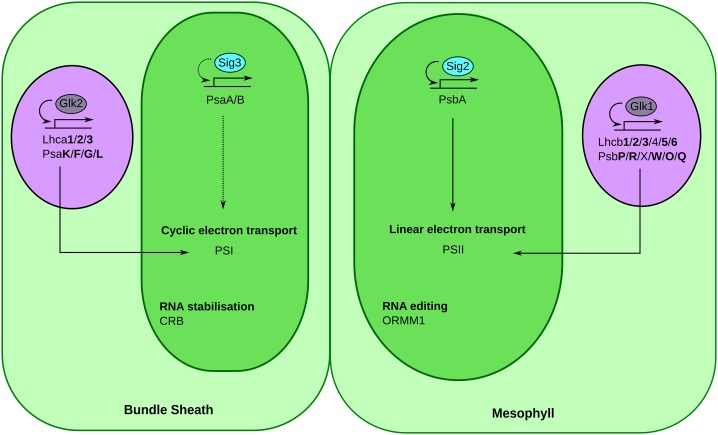
Leaves of almost all C4 lineages separate the reactions of photosynthesis into the mesophyll (M) and bundle sheath (BS). The extent to which messenger RNA profiles of M and BS cells from independent C4 lineages resemble each other is not known. To address this, we conducted deep sequencing of RNA isolated from the M and BS of Setaria viridis and compared these data with publicly available information from maize (Zea mays). This revealed a high correlation (r=0.89) between the relative abundance of transcripts encoding proteins of the core C4 pathway in M and BS cells in these species, indicating significant convergence in transcript accumulation in these evolutionarily independent C4 lineages. We also found that the vast majority of genes encoding proteins of the C4 cycle in S. viridis are syntenic to homologs used by maize. In both lineages, 122 and 212 homologous transcription factors were preferentially expressed in the M and BS, respectively. Sixteen shared regulators of chloroplast biogenesis were identified, 14 of which were syntenic homologs in maize and S. viridis. In sorghum (Sorghum bicolor), a third C4 grass, we found that 82% of these trans-factors were also differentially expressed in either M or BS cells. Taken together, these data provide, to our knowledge, the first quantification of convergence in transcript abundance in the M and BS cells from independent lineages of C4 grasses. Furthermore, the repeated recruitment of syntenic homologs from large gene families strongly implies that parallel evolution of both structural genes and trans-factors underpins the polyphyletic evolution of this highly complex trait in the monocotyledons.


Figures

Figure 1.
Figure 1.
Extraction of protein and RNA from M and BS cells of S. viridis. A, Representative image of a leaf prior to rolling, with alternating bands of M (arrowhead) and BS cells. B, After leaf rolling, the chloroplasts within the BS cells (circle) are visible. C, Representative image of BS preparation after blending. D, Immunoblotting demonstrates that CA, PEPC, and NADP-MDH proteins were abundant in M samples but not detectable in BS strands. In contrast, Rubisco LSU and NADP-ME were preferentially localized in BS strands. The molecular mass of each protein is annotated to the left of each blot. E, Quantitative PCR for CA, PEPC, NADP-MDH, RbcS, and NADP-ME indicated preferential transcript accumulation in the same cell type as each protein. Bars = 200 µm (A and B) and 4 µm (C).
Figure 2.
Figure 2.
Abundance of transcripts encoding proteins of the C4 cycle in M and BS cells of S. viridis and maize. A, Summary of transcript quantification in M and BS cells; components of the Calvin-Benson cycle are shown at bottom. Transcripts that are more abundant in the M are colored yellow, while those that are more abundant in the BS are colored red (the scale is shown in the heat map to the right). For each component of the C4 cycle, quantifications for S. viridis and maize are shown on the left and right, respectively. B and C, Log2 fold change of transcript abundance in BS and M cells for all C4 genes sorted by mean enrichment (high to low) in S. viridis and maize (B) or convergence between the two species (C). The top and middle sections represent transcripts that in both species were preferential to BS and M cells, respectively, while the bottom section represents transcripts that showed divergent patterns between the two species. Abbreviations not defined in the text are as follows: AK, adenylate kinase; ASP-AT, Asp aminotransferase; DCT2, dicarboxylate transporter; DIT1, dicarboxylate transporter; FBP, Fru-1,6-bisphosphatase; GCH, Gly cleavage H-protein; GOX, glycolate oxidase; MEP3, putative protein/pyruvate symporter; PPDK-RP, pyruvate,orthophosphate dikinase regulatory protein; PPT, phosphoenolpyruvate/phosphate translocator; RBCACT, Rubisco activase; RbcS, Rubisco small subunit; RPE, ribulose-phosphate3 epimerase; SBP, sedoheptulose-1,7-bisphosphatase; SHMT, Ser hydroxymethyltransferase; TLK, trans-ketolase; TPT, triose phosphate/phosphate antiporter.
Figure 3.
Figure 3.
Convergence in the abundance of transcripts and proteins between S. viridis and maize. A, Relationship between the abundance of transcripts in BS and M cells of S. viridis and maize. B, Relationship between the abundance of transcripts in BS and M cells of S. viridis and chloroplast proteins in maize defined by best BLASTP hits (from Friso et al., 2010). All differentially expressed genes are represented in red, while C4 genes are in black. Pearson’s correlation coefficients (r) are shown.
Figure 4.
Figure 4.
Global convergence in transcript abundance within M and BS cells of S. viridis and maize. A, Venn diagrams show the number of homologous genes from S. viridis and maize that were differentially expressed (FDR = 5%) in the two cell types. B, Functionally enriched gene categories in S. viridis and maize, defined by Fisher’s exact test (FDR = 10%). C, Venn diagrams showing the extent to which transcripts encoding homologous transcription factors accumulate in either M or BS cells of S. viridis and maize (FDR = 5%).
Figure 5.
Figure 5.
Model for the regulation of photosynthesis gene expression in M and BS cell chloroplasts of maize and S. viridis. Genes previously implicated in the regulation of photosynthesis genes in the nucleus (GLK1 and GLK2) and chloroplast (SIG2) are depicted with solid arrows. The proposed regulation by SIG3 of PsaA/B genes is shown with dashed black arrows. Purple and dark green ovals represent the nucleus and chloroplast, respectively. Genes highlighted in boldface encode components of the light-harvesting complexes known to be differentially expressed between M and BS cells of maize (Li et al., 2010b).

Similar articles

Cited by

References

    1. Anders S (2011) HTSeq: analysing high-throughput sequencing data with Python. http://www-huber.embl.de/users/anders/HTSeq/ (April 7, 2014) - PMC - PubMed
    1. Anders S, Huber W. (2010) Differential expression analysis for sequence count data. Genome Biol 11: R106. - PMC - PubMed
    1. Aubry S, Brown NJ, Hibberd JM. (2011) The role of proteins in C3 plants prior to their recruitment into the C4 pathway. J Exp Bot 62: 3049–3059 - PubMed
    1. Bennetzen JL, Schmutz J, Wang H, Percifield R, Hawkins J, Pontaroli AC, Estep M, Feng L, Vaughn JN, Grimwood J, et al. (2012) Reference genome sequence of the model plant Setaria. Nat Biotechnol 30: 555–561 - PubMed
    1. Brown NJ, Newell CA, Stanley S, Chen JE, Perrin AJ, Kajala K, Hibberd JM. (2011) Independent and parallel recruitment of preexisting mechanisms underlying C4 photosynthesis. Science 331: 1436–1439 - PubMed

Publication types

MeSH terms