. 2014 May 1;55(5):2841-52.
doi: 10.1167/iovs.13-13624.

Quantitative fundus autofluorescence in recessive Stargardt disease

Affiliations

Quantitative fundus autofluorescence in recessive Stargardt disease

Tomas R Burke et al. Invest Ophthalmol Vis Sci. .

Abstract

Purpose: To quantify fundus autofluorescence (qAF) in patients with recessive Stargardt disease (STGD1).

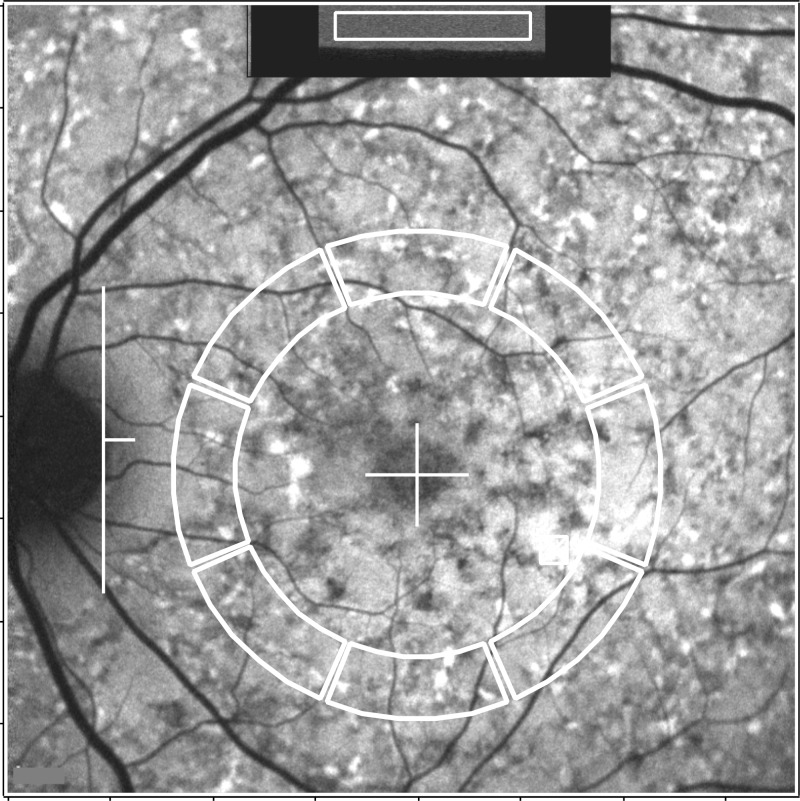
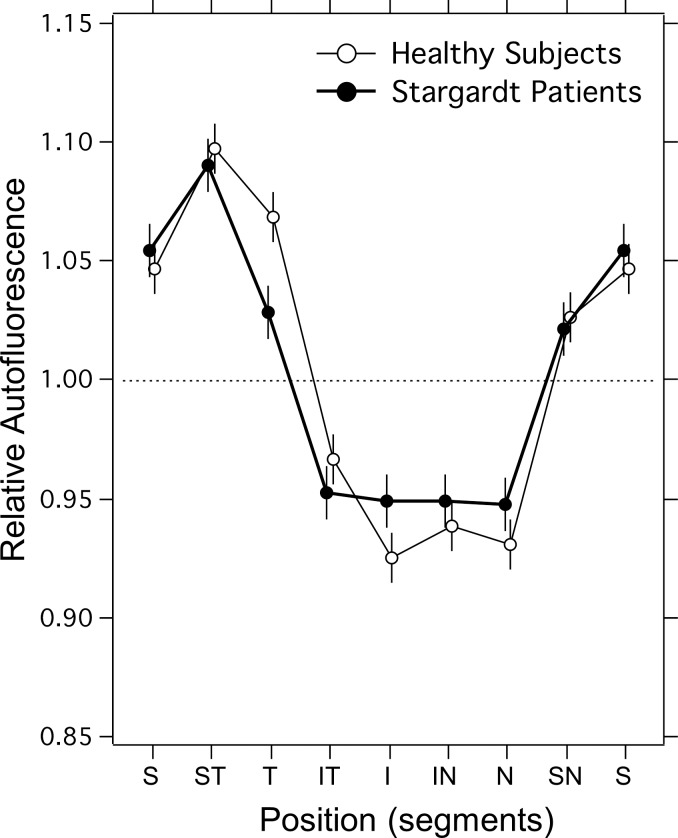
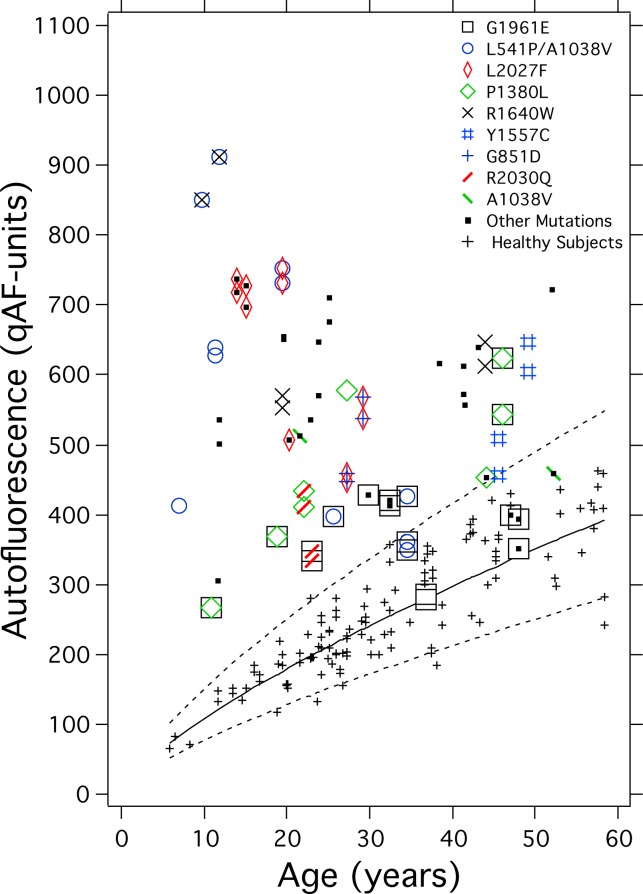
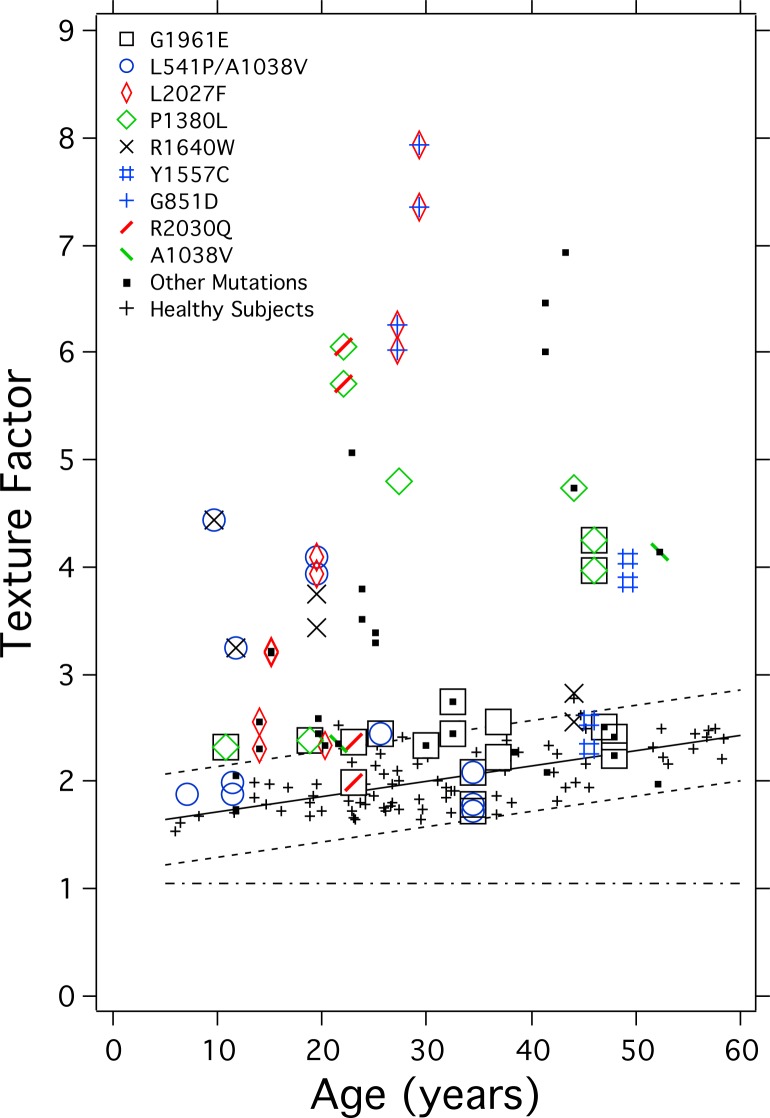
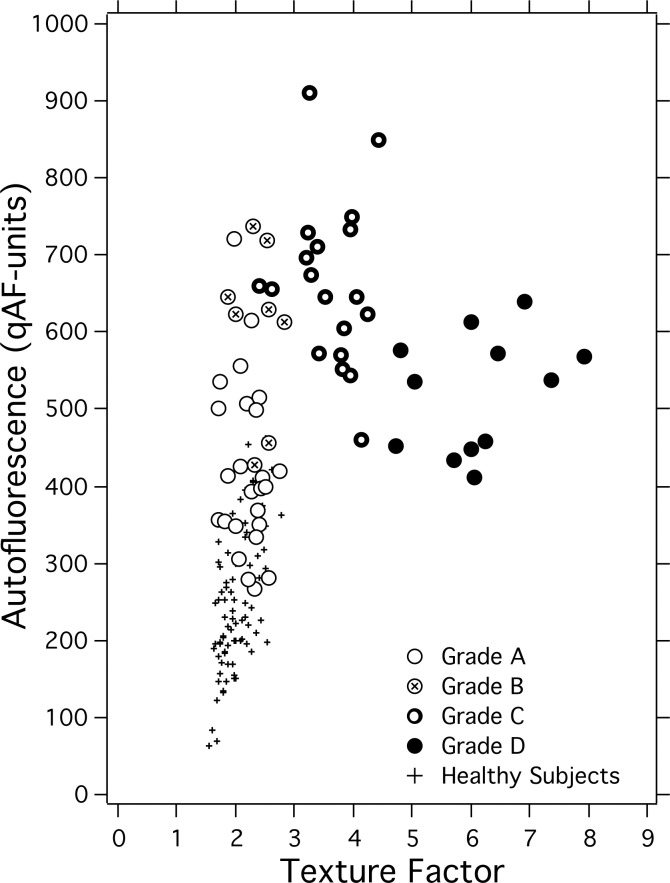
Methods: A total of 42 STGD1 patients (ages: 7-52 years) with at least one confirmed disease-associated ABCA4 mutation were studied. Fundus AF images (488-nm excitation) were acquired with a confocal scanning laser ophthalmoscope equipped with an internal fluorescent reference to account for variable laser power and detector sensitivity. The gray levels (GLs) of each image were calibrated to the reference, zero GL, magnification, and normative optical media density to yield qAF. Texture factor (TF) was calculated to characterize inhomogeneities in the AF image and patients were assigned to the phenotypes of Fishman I through III.

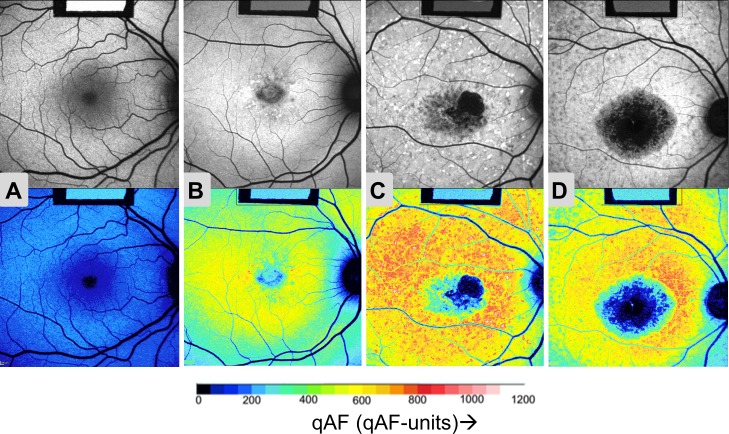
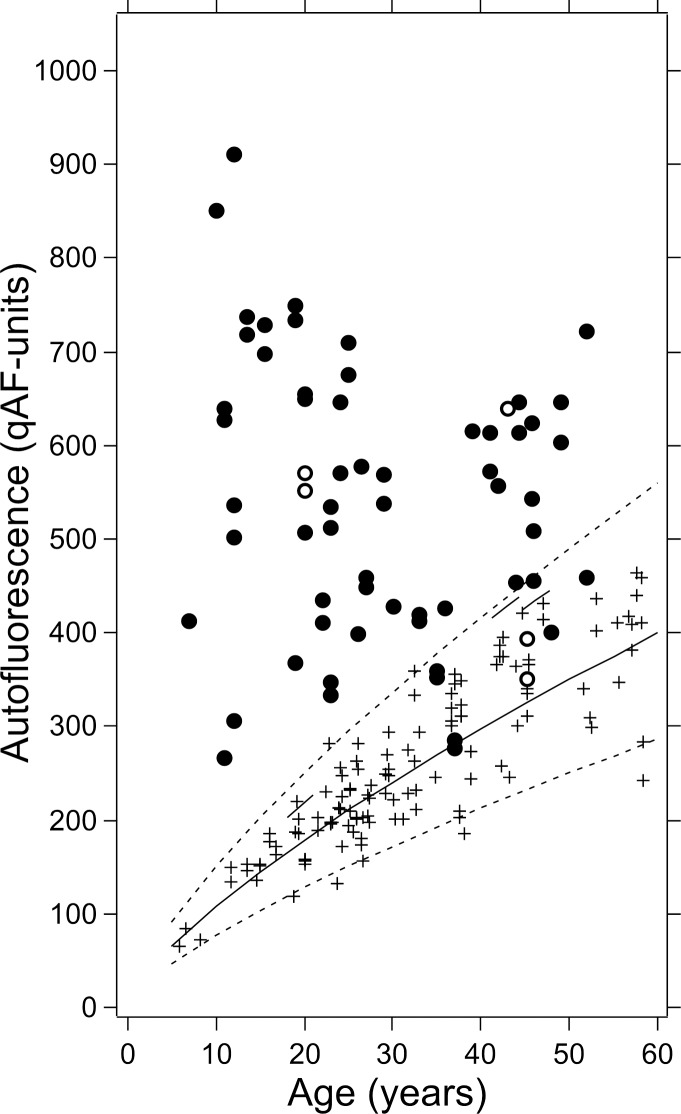
Results: Quantified fundus autofluorescence in 36 of 42 patients and TF in 27 of 42 patients were above normal limits for age. Young patients exhibited the relatively highest qAF, with levels up to 8-fold higher than healthy eyes. Quantified fundus autofluorescence and TF were higher in Fishman II and III than Fishman I, who had higher qAF and TF than healthy eyes. Patients carrying the G1916E mutation had lower qAF and TF than most other patients, even in the presence of a second allele associated with severe disease.

Conclusions: Quantified fundus autofluorescence is an indirect approach to measuring RPE lipofuscin in vivo. We report that ABCA4 mutations cause significantly elevated qAF, consistent with previous reports indicating that increased RPE lipofuscin is a hallmark of STGD1. Even when qualitative differences in fundus AF images are not evident, qAF can elucidate phenotypic variation. Quantified fundus autofluorescence will serve to establish genotype-phenotype correlations and as an outcome measure in clinical trials.

Keywords: ABCA4; lipofuscin; quantitative fundus autofluorescence; recessive Stargardt disease; retinal pigment epithelium; scanning laser ophthalmoscope.


Figures

Figure 1
Figure 1
Fundus AF image analysis of a patient (#14) with widespread high AF flecks throughout the fundus. For qAF analysis, mean GLs are recorded from the internal reference (rectangular area outlined in white at the top of the image) and from eight circularly arranged segments (outlined in white). The horizontal distance, FD, between the temporal edge of the optic disc (white vertical line) and the center of the fovea (white cross) was used to define inner and outer radii of the ring of segments (0.58 × FD and 0.78 × FD, respectively).
Figure 2
Figure 2
Quantified fundus autofluorescence images. Autofluorescence images (upper panels) with corresponding color-coded qAF images (lower panels) for the right eye of (A) a control (20 years) and for STGD1 patients: (B) #28 (20 years); (C) #2 (25 years); and (D) #33 (19 years). Images (B), (C), and (D) are examples of Fishman Stages I, II, and III, respectively. As shown in the qAF color-code scale (below), lower qAF levels are indicated as blue and higher qAF levels as red colors (see scale). Note that the images for all eyes had similar GLs after adjusting the sensitivity to optimize the dynamic range. Thus, the GL of the internal reference (rectangle in upper center of each image) is lower in the three STGD patients ([BD], upper) than in the healthy eye ([A], upper), reflecting the higher AF levels of the patients. In the color-coded qAF images ([AD], lower) the reference has the same color.
Figure 3
Figure 3
Spatial distribution of qAF in individual segments of the ring (Fig. 1) for normal subjects (n = 97), and for STGD1 patients (n = 22). The segment positions are identified by S, superior; ST, superior temporal; T, temporal; IT, inferior temporal; I, inferior; IN, inferior nasal; N, nasal; and SN, superonasal. The segments' qAF were normalized to the average qAF8 (for all segments). Error bars are 95% confidence intervals.
Figure 4
Figure 4
qAF8 from one or two eyes of all STGD1 patients as a function of age. White STGD1 patients are shown as filled circles. For comparison, qAF8 of white healthy eyes (crosses) are plotted with mean (solid line) and 95% confidence intervals (dashed lines). The qAF8 of the black, Hispanic, and Indian subjects (open circles) can be compared with the corresponding upper 95% confidence limits for their different race/ethnicity group (short segments of solid line).
Figure 5
Figure 5
qAF8 from one or two eyes of each STGD1 patients versus age with colored-symbol coding for mutations. The mutations were confirmed in six or more patients (G1961E, L541P/A1038V, L2027F, and P1380L) or in two to four patients (R1640W, Y1557C, G851D, and R2030Q). Also shown is mutation A1038V in a compound heterozygous state with other mutations while not as a complex allele with L541P. In this and the following figures, some points have been displaced slightly to avoid overlap.
Figure 6
Figure 6
Texture factor in one or two eyes of each STGD1 patient (see legend) and healthy subjects (black crosses) as a function of age. Mean (solid black line) and 95% confidence intervals (interrupted line) for the healthy subjects are based on TF data from 83 white subjects (small +). The linear fit was TF = 1.58 + 0.014. Age (r2 = 0.42, P = 0.001). The horizontal (interrupted) line is the mean TF (1.1; 95% confidence interval: 0.8–1.4) associated with uniform fluorescent targets (see Supplementary Material: “Texture Factor”).
Figure 7
Figure 7
Scatter diagram of qAF8 and TF for all STGD1 eyes. Symbols correspond to the four phenotype grades (assigned by three observers) for the ring of segments where the measurements are made: grade A if no flecks were seen in any segment, grade B is less than five flecks/segment on average were detected, grade C if more than five flecks were seen, but the area covered by flecks was smaller than that affected by atrophy, and grade D if the area of atrophy was larger than that occupied by flecks.

Similar articles

Cited by

References

    1. Fishman GA, Farber M, Patel BS, Derlacki DJ. Visual acuity loss in patients with Stargardt's macular dystrophy. Ophthalmology. 1987; 94: 809–814 - PubMed
    1. Rotenstreich Y, Fishman GA, Anderson RJ. Visual acuity loss and clinical observations in a large series of patients with Stargardt disease. Ophthalmology. 2003; 110: 1151–1158 - PubMed
    1. Blacharski PA. Fundus flavimaculatus. In: Newsome DA. ed Retinal Dystrophies and Degenerations. New York: Raven Press; 1988: 135–159
    1. Allikmets R, Singh N, Sun H, et al. A photoreceptor cell-specific ATP-binding transporter gene (ABCR) is mutated in recessive Stargardt macular dystrophy. Nat Genet. 1997; 15: 236–246 - PubMed
    1. Allikmets R, Shroyer NF, Singh N, et al. Mutation of the Stargardt disease gene (ABCR) in age-related macular degeneration. Science. 1997; 277: 1805–1807 - PubMed

Publication types