

SWIFT-scalable clustering for automated identification of rare cell populations in large, high-dimensional flow cytometry datasets, part 1: algorithm design
- PMID: 24677621
- PMCID: PMC4238829
- DOI: 10.1002/cyto.a.22446
SWIFT-scalable clustering for automated identification of rare cell populations in large, high-dimensional flow cytometry datasets, part 1: algorithm design
Abstract
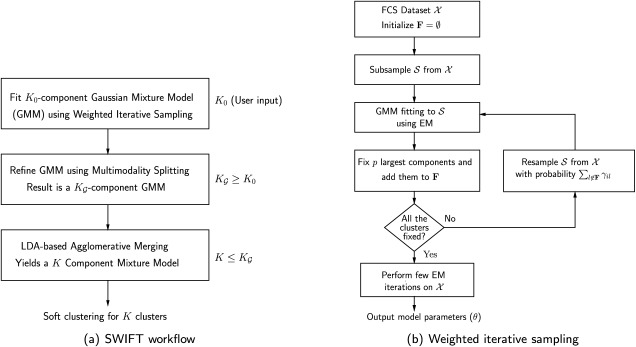
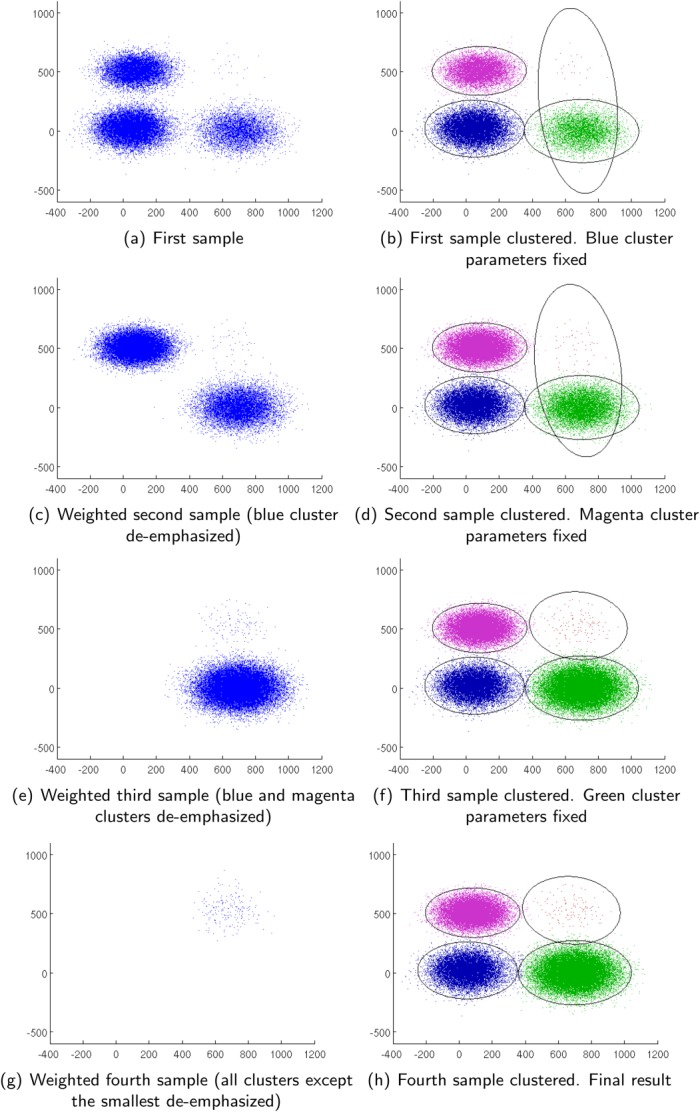
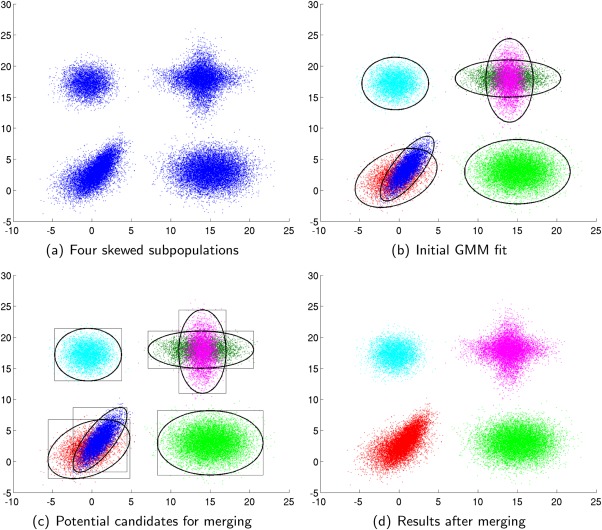
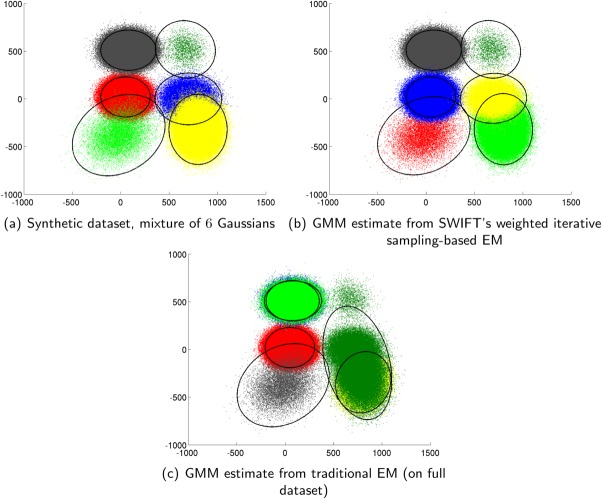
We present a model-based clustering method, SWIFT (Scalable Weighted Iterative Flow-clustering Technique), for digesting high-dimensional large-sized datasets obtained via modern flow cytometry into more compact representations that are well-suited for further automated or manual analysis. Key attributes of the method include the following: (a) the analysis is conducted in the multidimensional space retaining the semantics of the data, (b) an iterative weighted sampling procedure is utilized to maintain modest computational complexity and to retain discrimination of extremely small subpopulations (hundreds of cells from datasets containing tens of millions), and (c) a splitting and merging procedure is incorporated in the algorithm to preserve distinguishability between biologically distinct populations, while still providing a significant compaction relative to the original data. This article presents a detailed algorithmic description of SWIFT, outlining the application-driven motivations for the different design choices, a discussion of computational complexity of the different steps, and results obtained with SWIFT for synthetic data and relatively simple experimental data that allow validation of the desirable attributes. A companion paper (Part 2) highlights the use of SWIFT, in combination with additional computational tools, for more challenging biological problems.
Keywords: Gaussian mixture models; automated multivariate clustering; ground truth data; rare subpopulation detection; weighted sampling.
© 2014 The Authors. Published by Wiley Periodicals Inc. on behalf of the International Society for Advancement of Cytometry.
Figures
References
-
- Shapiro H. Practical Flow Cytometry. 4th edn. New York, NY: Wiley; 2003.
-
- McLaughlin BE, Baumgarth N, Bigos M, Roederer M, De Rosa SC, Altman JD, Nixon DF, Ottinger J, Oxford C, Evans TG, et al. Nine-color flow cytometry for accurate measurement of T cell subsets and cytokine responses. Part I: Panel design by an empiric approach. Cytom Part A. 2008;73A:400–410. - PMC - PubMed
-
- Nolan JP, Yang L. The flow of cytometry into systems biology. Brief Funct Genomics Proteomics. 2007;6:81–90. - PubMed
-
- Perfetto SP, Chattopadhyay PK, Roederer M. Seventeen-colour flow cytometry: Unravelling the immune system. Nat Rev Immunol. 2004;4:648–655. - PubMed
-
- Qian Y, Wei C, Eun-Hyung Lee F, Campbell J, Halliley J, Lee JA, Cai J, Kong YM, Sadat E, Thomson E. Elucidation of seventeen human peripheral blood B-cell subsets and quantification of the tetanus response using a density-based method for the automated identification of cell populations in multidimensional flow cytometry data. Cytom Part B: Clin Cytom. 2010;78B:69–82. , et al. - PMC - PubMed
Publication types
MeSH terms
Grants and funding
LinkOut - more resources
Full Text Sources
Other Literature Sources
Molecular Biology Databases
