. 2014 Mar 19:8:26.
doi: 10.3389/fninf.2014.00026. eCollection 2014.

QSpike tools: a generic framework for parallel batch preprocessing of extracellular neuronal signals recorded by substrate microelectrode arrays

Affiliations

QSpike tools: a generic framework for parallel batch preprocessing of extracellular neuronal signals recorded by substrate microelectrode arrays

Mufti Mahmud et al. Front Neuroinform. .

Abstract

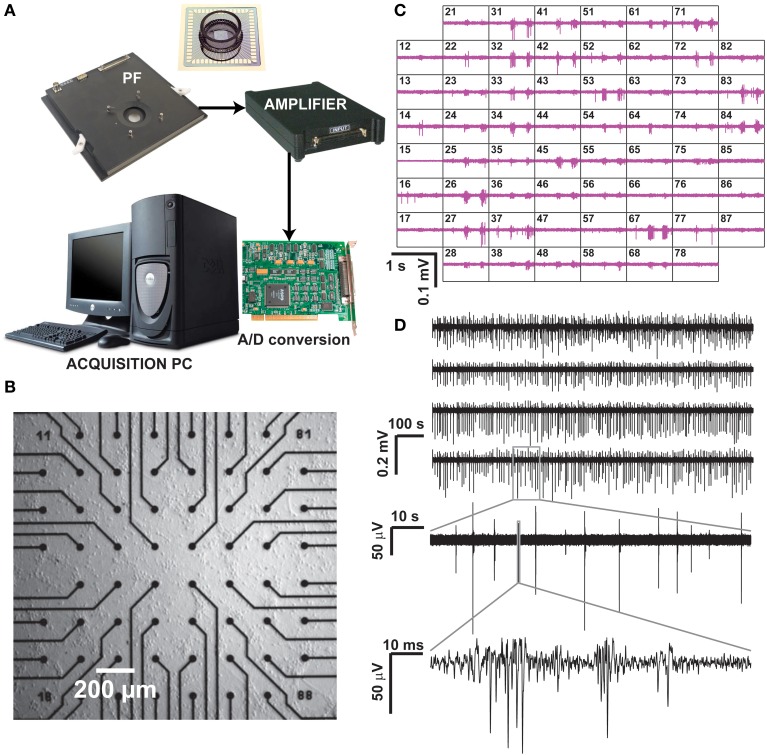
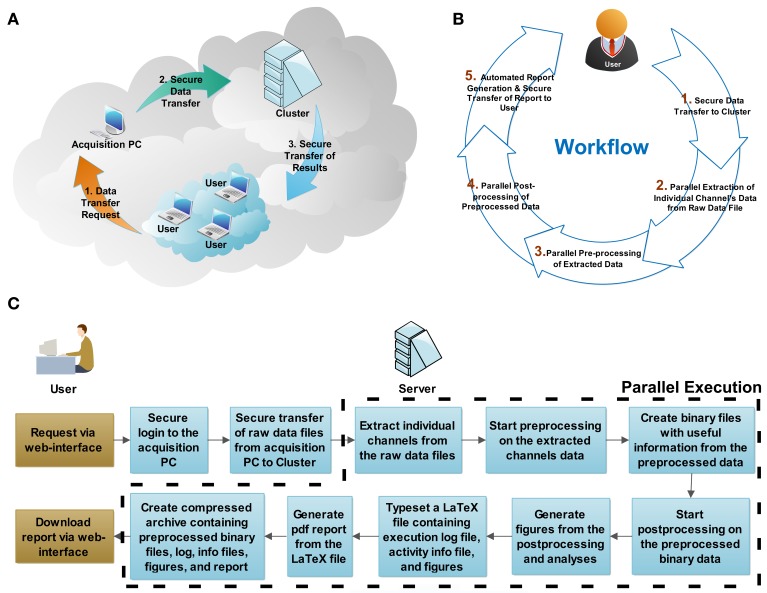
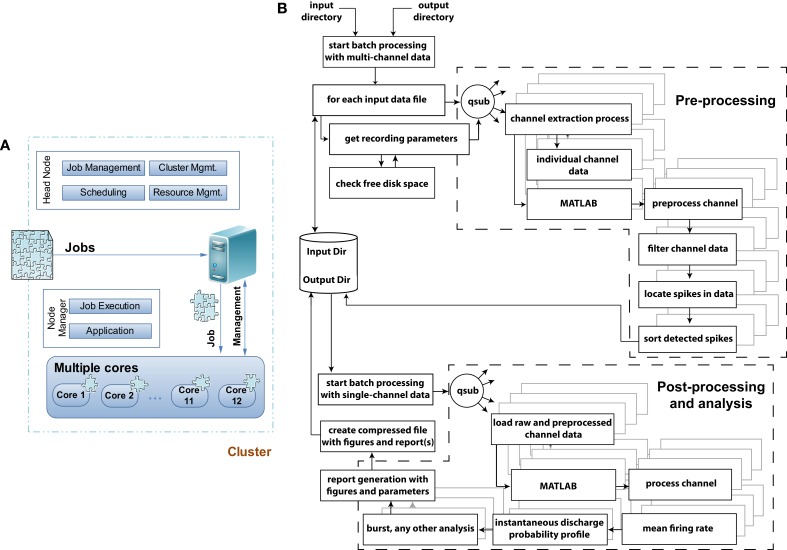
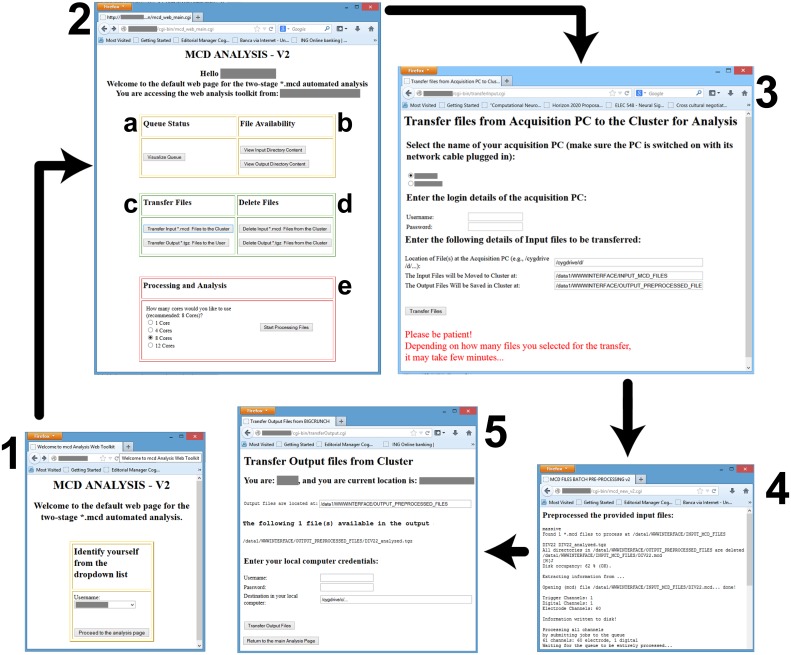
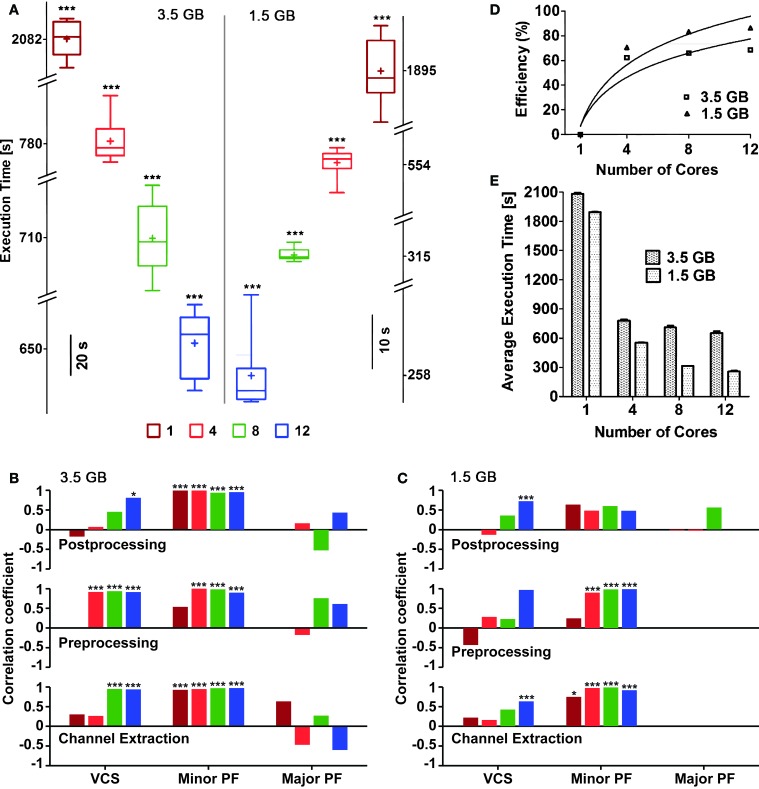
Micro-Electrode Arrays (MEAs) have emerged as a mature technique to investigate brain (dys)functions in vivo and in in vitro animal models. Often referred to as "smart" Petri dishes, MEAs have demonstrated a great potential particularly for medium-throughput studies in vitro, both in academic and pharmaceutical industrial contexts. Enabling rapid comparison of ionic/pharmacological/genetic manipulations with control conditions, MEAs are employed to screen compounds by monitoring non-invasively the spontaneous and evoked neuronal electrical activity in longitudinal studies, with relatively inexpensive equipment. However, in order to acquire sufficient statistical significance, recordings last up to tens of minutes and generate large amount of raw data (e.g., 60 channels/MEA, 16 bits A/D conversion, 20 kHz sampling rate: approximately 8 GB/MEA,h uncompressed). Thus, when the experimental conditions to be tested are numerous, the availability of fast, standardized, and automated signal preprocessing becomes pivotal for any subsequent analysis and data archiving. To this aim, we developed an in-house cloud-computing system, named QSpike Tools, where CPU-intensive operations, required for preprocessing of each recorded channel (e.g., filtering, multi-unit activity detection, spike-sorting, etc.), are decomposed and batch-queued to a multi-core architecture or to a computers cluster. With the commercial availability of new and inexpensive high-density MEAs, we believe that disseminating QSpike Tools might facilitate its wide adoption and customization, and inspire the creation of community-supported cloud-computing facilities for MEAs users.

Keywords: MEAs; batch analysis; cellular electrophysiology; embarrassingly parallel signal-processing; extracellular; substrate arrays of microelectrodes.


Figures

Figure 1
Figure 1
Recording of neuronal activity ex vivo, by means of a commercial MEA hardware platform. Our experimental setup (A) is composed by a pre-amplification and filtering (PF) stage and by an additional signal amplifier, connected via an A/D board to a dedicated data acquisition PC, which also controls a temperature controller and electrical stimulus generation (not shown). After plating and culturing mammalian primary cortical neurons ex vivo on a MEA for several days, spontaneous electrical activity is detected and recorded at each microelectrode (B), arranged as a regular 8 by 8 layout, 200 μm spacing, and displayed in real time (C). Representative raw voltage traces from four sample microelectrodes, recorded over 20 min, are sown in (D) with increasing levels of magnification, to reveal the stereotypical pattern of spontaneous multi-unit electrical activity.
Figure 2
Figure 2
System architecture and workflow description. The physical configuration of computers within network(s) is reminiscent (A) of a cloud-computing architecture. Through a web browser, the user initiates (B) the workflow by requesting secure data transfer from the acquisition computer to the server, and by starting the parallel batch processing and analysis. At the end of the analysis, the server generates automatically a portable document format (PDF) document, reporting on the execution log, the activity summary, and the result summary, which is incorporated in a compressed file archive along with the analysis result. When ready, the user concludes the session by securely downloading the compressed file archive to his/her personal computer. The flowchart (C) shows the actions required by the user and the processing steps executed by the server (cluster). The steps executed in parallel are outlined by the dashed line.
Figure 3
Figure 3
Grid computing architecture and flowchart of the data pre-, post-processing, and analysis module. (A) When jobs arrive at a grid computing environment, the jobs are decomposed into individual jobs and allocated to each processor core or cluster for completion. In a multicomputer cluster system the head node of the cluster is responsible for job-, cluster-, resource-management and scheduling leaving the application and job execution on the individual nodes of the cluster system. In QSpike Tools the benefit of a multicore single computer cluster has been exploited where the responsibilities of the head and individual nodes are handled by the grid computing software. (B) Flowchart of the execution model with exemplary pre-, post-processing and analysis modules to demonstrate and distinguish among the operations in terms of their parallelization. Dashed sections outlines the two major sets of operations, where parallelization of the tasks takes place. The remaining tasks instead operate serially. The parallelization is achieved by the qsub command, provided by the grid-scheduling environment, distributing the batch-queued jobs to the specified cores for their parallel execution.
Figure 4
Figure 4
Screenshots of the web-interface. Each window is numbered to denote a separate stage of the workflow, and consist in: (1) the user-identification; the (2) main control webpage; the (3) file transfer interface from the data acquisition PC to the master node; (4) the result of the preprocessing; and (5) the file transfer from the master node to the user PC. Individual letter labels in (2) represent grouped functionalities, such as the visualization (a) of the status of the computing queues, the availability check (b) for the data files in the input and output directories, the file transfer and management functions (c,d), and finally (e) the initiation of the parallelized preprocessing and analysis, with an option to select the destination queue.
Figure 5
Figure 5
Execution times and efficiency, for an increasing numbers of cores reserved. Box plots (A) with box height showing 25–75% of the sample values were used to represent maximum and minimum (whiskers), median (“−”) and mean (“+”) execution times, respectively, which were all significantly different (p < 0.05) based on the number of cores used. The vertical line in the middle separates the data representation corresponding to distinct file sizes (3.5 vs. 1.5 GB). Pearson's liner correlation coefficients (B,C) show that the execution times of individual sub-processes are correlated to, certain computationally intensive operations performed by the operating system such as, minor page faults (Minor PF), and voluntary context-switching (VCS) (***p < 0.0001; *p < 0.05) in case of large file size (B). Though major page faults (Major PF) were noticed while analyzing the large file, they had either negative or no correlation to the execution times. The execution times of the first two sub-processes for the small file were mainly correlated to Minor PF (***p < 0.0001; *p < 0.01) (C). Overall, negligible amount of Major PF occurred during the execution of the small file and only when large number of cores was used, correlation between execution times and VCS were noticed. The bars in (B,C) are plotted using the same color code of (A). The efficiency of parallelization was also quantified (D) as referred to the slowest execution time when a single core was used: continuous lines are best-fit logarithmic plots, whose mean squares were 0.8807 and 0.9306 for 3.5 and 1.5 GB file sizes, respectively. The mean execution times (E) for both file sizes also show the reduction of the execution time, for an increasing number of cores available.
Figure 6
Figure 6
Average voltage waveforms, corresponding to (positive or negative) peak-detection events at each microelectrode. Each subplot represents graphically the 8 × 8 layout of the MEAs employed in this study (see the Methods). The average voltage trajectories (thick black lines) of the positive (A) or negative (B) threshold crossing events are displayed for each microelectrode, together with its point by point variability (gray shading, i.e., standard deviation), and with the number of events among brackets. The numbers on the right hand side of each subplot denote the labeled electrode name.
Figure 7
Figure 7
Experimental outcome at a glance. The distribution of the number of electrodes (A) that detected activity with significant occurrence frequency is displayed, together with the MEA-wide distribution (B) of the interspike intervals that reveal a bimodal profile, corresponding to the recurring transient, MEA-wide synchronization of the electrical activity.
Figure 8
Figure 8
Sample spontaneous activity display. The multiunit spontaneous activity is displayed as raster-plot (A) across the detecting microelectrodes for the first 5 min of each data file, and its corresponding spike count is computed (B) to reveal the MEA-wise stereotypical episodic synchronization of neuronal activity.
Figure 9
Figure 9
Largest population burst. As in Figure 8, the spike count is displayed and it is centered on the largest MEA-wide synchronization event (i.e., a burst) (A), together with its corresponding spike raster diagram (B), with increasing temporal resolution (C,D).

References

    1. Abdoun O., Joucla S., Mazzocco C., Yvert B. (2011). NeuroMap: a spline-based interactive open-source software for spatiotemporal mapping of 2D and 3D MEA data. Front. Neuroinform. 4:119 10.3389/fninf.2010.00119 - DOI - PMC - PubMed
    1. Arsiero M., Luscher H. R., Giugliano M. (2007). Real-time closed-loop electrophysiology: towards new frontiers in in vitro investigations in the neurosciences. Arch. Ital. Biol. 145, 193–209 - PubMed
    1. Berdondini L., Chippalone M., van der Wal P. D., Imfeld K., de Rooij N. F., Koudelka-Hep M., et al. (2006). A microelectrode array (MEA) integrated with clustering structures for investigating in vitro neurodynamics in confined interconnected sub-populations of neurons. Sens. Actuators B Chem. 114, 530–541 10.1016/j.snb.2005.04.042 - DOI
    1. Berdondini L., Massobrio P., Chiappalone M., Tedesco M., Imfeld K., Maccione A., et al. (2009). Extracellular recordings from locally dense microelectrode arrays coupled to dissociated cortical cultures. J. Neurosci. Methods 177, 386–396 10.1016/j.jneumeth.2008.10.032 - DOI - PubMed
    1. Bologna L. L., Pasquale V., Garofalo M., Gandolfo M., Baljon P. L., Maccione A., et al. (2010). Investigating neuronal activity by SPYCODE multi-channel data analyzer. Neural Netw. 23, 685–697 10.1016/j.neunet.2010.05.002 - DOI - PubMed