

Do low-income neighbourhoods have the least green space? A cross-sectional study of Australia's most populous cities
- PMID: 24678610
- PMCID: PMC4005631
- DOI: 10.1186/1471-2458-14-292
Do low-income neighbourhoods have the least green space? A cross-sectional study of Australia's most populous cities
Abstract
Background: An inequitable distribution of parks and other 'green spaces' could exacerbate health inequalities if people on lower incomes, who are already at greater risk of preventable diseases, have poorer access.
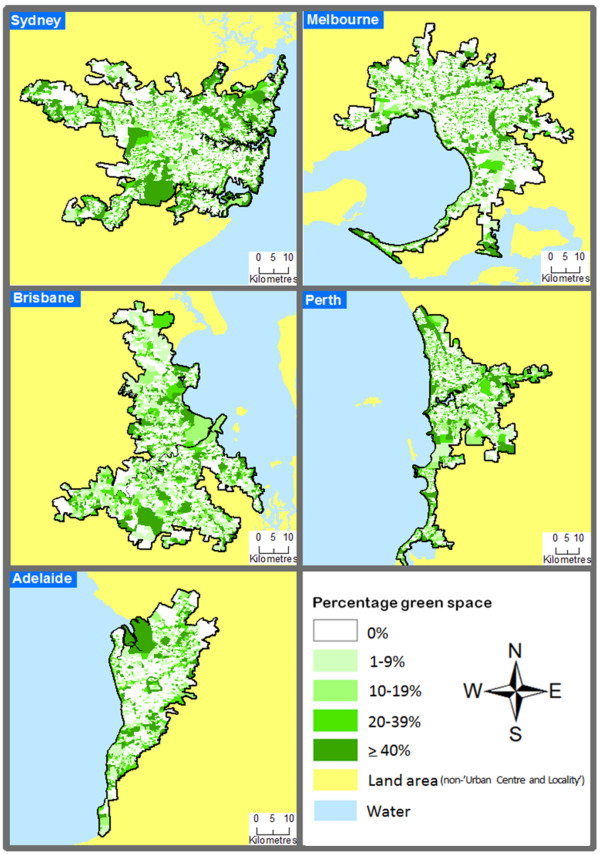
Methods: The availability of green space within 1 kilometre of a Statistical Area 1 (SA1) was linked to data from the 2011 Australian census for Sydney (n = 4.6 M residents); Melbourne (n = 4.2 M); Brisbane (n = 2.2 M); Perth (n = 1.8 M); and Adelaide (n = 1.3 M). Socioeconomic circumstances were measured via the percentage population of each SA1 living on < $21,000 per annum. Negative binomial and logit regression models were used to investigate association between the availability of green space in relation to neighbourhood socioeconomic circumstances, adjusting for city and population density.
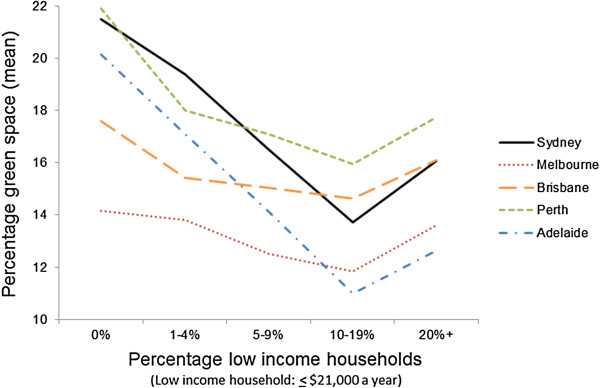
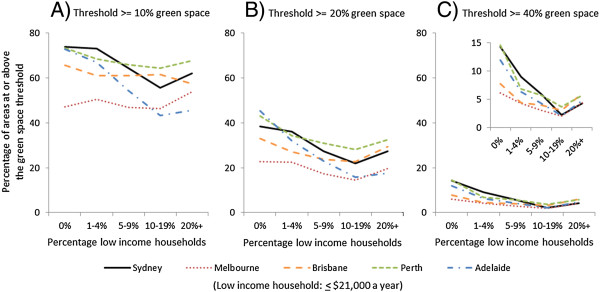
Results: Green space availability was substantively lower in SA1s with a higher percentage of low income residents (e.g. an incidence rate ratio of 0.82 (95% confidence interval (95% CI) 0.75, 0.89) was observed for SA1s containing ≥20% versus 0-1% low income residents). This association varied between cities (p < 0.001). Adelaide reported the least equitable distribution of green space, with approximately 20% greenery in the most affluent areas versus 12% availability in the least affluent. Although Melbourne had a smaller proportion of SA1s in the top quintile of green space availability (13.8%), the distribution of greenery was the most equitable of all the cities, with only a 0.5% difference in the availability of green space between SA1s containing 0-1% low income households versus those with ≥20%. Inequity of access, however, was reported across all cities when using logit regression to examine the availability of at least 20% (odds ratio 0.74, 95% CI 0.59, 0.93) or 40% (0.45, 0.29, 0.69) green space availability in the more disadvantaged versus affluent neighbourhoods.
Conclusion: Affirmative action on green space planning is required to redress the socioeconomic inequity of access to this important public health resource.
Figures
References
-
- Sutton SB. Civilizing American Cities; A Selection of Frederick Law Olmsted’s Writings on City Landscapes. Cambridge: MIT Press; 1971.
-
- Nilsson K, Sangster M, Konijnendijk CC. In: Forests, trees and human health. Nilsson K, Sangster M, Gallis C, Hartig T, de Vries S, Seeland K, Schipperijn J, editor. Netherlands: Springer; 2011. Introduction; pp. 1–19.
-
- Australian Government. Our Cities Our Future: A national urban policy for a productive, sustainable and liveable future. Department of Infrastructure and Transport: Canberra; 2011.
-
- The Scottish Government. Good places, better health in Scotland. The Scottish Government: Edinburgh; 2008.
Publication types
MeSH terms
LinkOut - more resources
Full Text Sources
Other Literature Sources
