. 2014 Mar 28;16(2):R31.
doi: 10.1186/bcr3633.

Postpartum breast involution reveals regression of secretory lobules mediated by tissue-remodeling

Postpartum breast involution reveals regression of secretory lobules mediated by tissue-remodeling

Sonali Jindal et al. Breast Cancer Res. .

Abstract

Introduction: A postpartum diagnosis of breast cancer is an independent predictor of metastases, however the reason is unknown. In rodents, the window of postpartum mammary gland involution promotes tumor progression, suggesting a role for breast involution in the poor prognosis of human postpartum breast cancers. Rodent mammary gland involution is characterized by the programmed elimination of the secretory lobules laid down in preparation for lactation. This tissue involution process involves massive epithelial cell death, stromal remodeling, and immune cell infiltration with similarities to microenvironments present during wound healing and tumor progression. Here, we characterize breast tissue from premenopausal women with known reproductive histories to determine the extent, duration and cellular mechanisms of postpartum lobular involution in women.

Methods: Adjacent normal breast tissues from premenopausal women (n = 183) aged 20 to 45 years, grouped by reproductive categories of nulliparous, pregnant and lactating, and by time since last delivery were evaluated histologically and by special stain for lobular area, lobular type composition, apoptosis and immune cell infiltration using computer assisted quantitative methods.

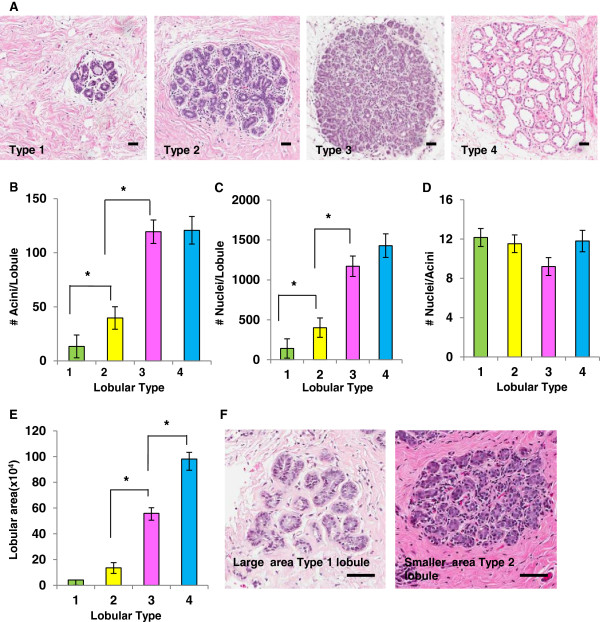
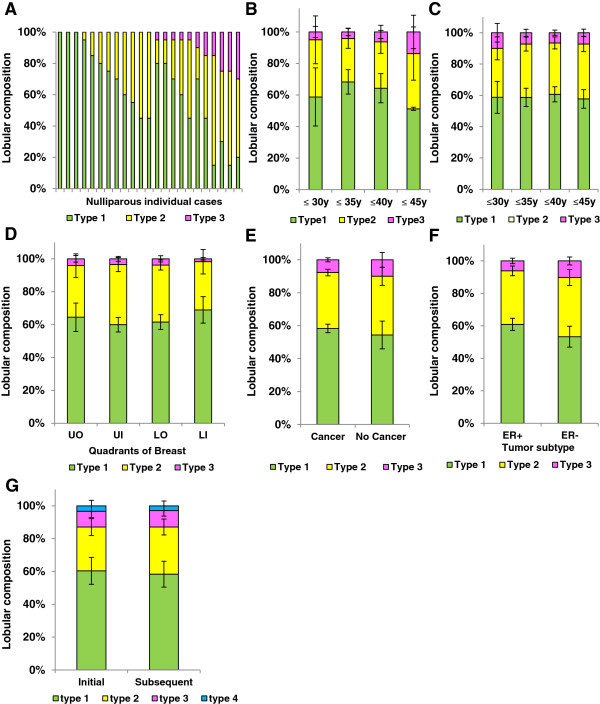
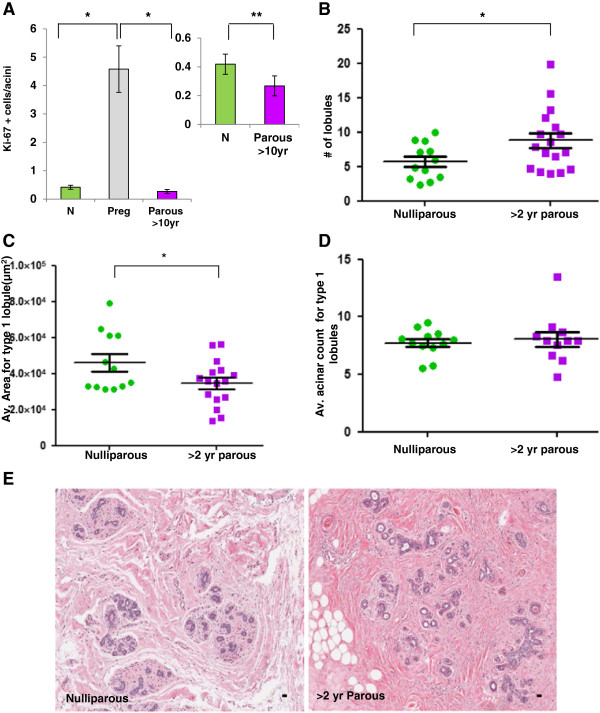
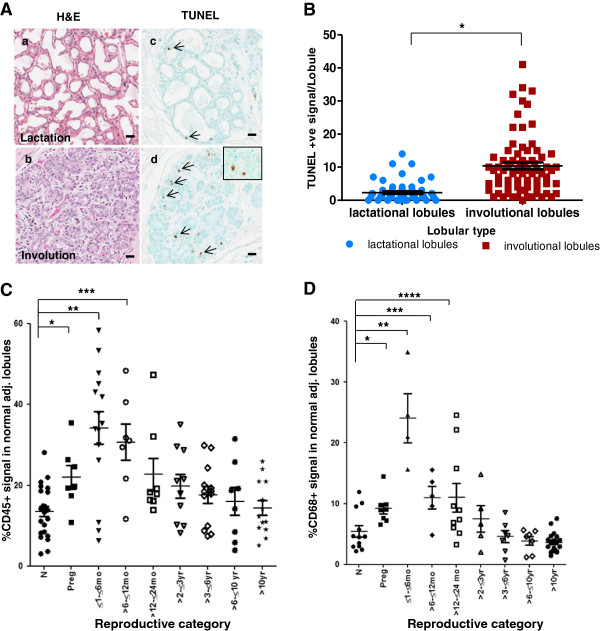
Results: Human nulliparous glands were composed dominantly of small (approximately 10 acini per lobule) and medium (approximately 35 acini per lobule) sized lobules. With pregnancy and lactation, a >10 fold increase in breast epithelial area was observed compared to nulliparous cases, and lactating glands were dominated by mature lobules (>100 acini per lobule) with secretory morphology. Significant losses in mammary epithelial area and mature lobule phenotypes were observed within 12 months postpartum. By 18 months postpartum, lobular area content and lobule composition were indistinguishable from nulliparous cases, data consistent with postpartum involution facilitating regression of the secretory lobules developed in preparation for lactation. Analyses of apoptosis and immune cell infiltrate confirmed that human postpartum breast involution is characterized by wound healing-like tissue remodeling programs that occur within a narrowed time frame.

Conclusions: Human postpartum breast involution is a dominant tissue-remodeling process that returns the total lobular area of the gland to a level essentially indistinguishable from the nulliparous gland. Further research is warranted to determine whether the normal physiologic process of postpartum involution contributes to the poor prognosis of postpartum breast cancer.


Figures

Figure 1
Figure 1
Criteria for distinguishing between lobular types. A. H & E stained images of lobules representative of types 1 to 4 (Scale bar = 30 μm). B. Validation of acini count per lobule to distinguish lobule types, identifying type 1 (green) as approximately 10 ± 4 acini per lobule, type 2 (yellow) as approximately 35 ± 5 acini per lobule, type 3 (pink) as approximately 114 ± 10 acini per lobule and type 4 (blue) based on secretory morphology with differences between types 1, 2 and 3 (*P ≤0.0007), but not types 3 and 4 (P = 0.92) (n= >1,700 lobules). C. Number of nuclei per lobule quantitated for lobular types 1, 2 and 3 (*P ≤0.002) and types 3 and 4 (P = 0.23) (n= >230 lobules). D. Number of nuclei per acini evaluated for each lobular type shows no statistical difference (P ≥0.07) (n= > 230 lobules). E. Lobular area distinguishes between lobules types 2, 3 and 4 (*P ≤0.0001) but not between types 1 and 2 (P = 0.11). F. H & E stained sections showing lobule types 1 and 2 occupying approximately the same area (approximately 50,000 μm2) but categorized as different types based on the number of acini/lobule (Scale bar = 90 μm). All error bars represent standard error of the mean (SEM).
Figure 2
Figure 2
Heterogeneity in lobular composition is independent of age, breast quadrant, and presence of cancer. A. Individual lobular composition in a cohort of nulliparous women ≤45 years of age (n = 23 cases). Among women, there is marked variation in lobule type; type 1 (green), type 2 (yellow) and type 3 (pink) (n= >550 lobules). B. Lobular composition of breast in nulliparous women does not vary by age increments of five years (≤35 years versus ≤30 years (P = 0.89); ≤40 years versus ≤30 years (P = 0.62); ≤45 years versus ≤30 years (P = 0.19)) C. Lobular composition in an expanded cohort excluding recently pregnant and lactating women (n = 82 cases) similarly shows lobular composition is not age dependent (≤35 years versus ≤30 years (P = 0.35); ≤40 years versus ≤30 years (P = 0.18); ≤45 years versus ≤30 years (P = 0.34)) D. Breast quadrant analysis from three mastectomy cases demonstrated no differences in lobular types for all quadrants (LO versus LI (P = 0.33); UI versus LI (P = 0.40); UO versus LI (P = 0.25)). E. Lobular type composition does not vary between women who were subsequently diagnosed with cancer (n = 82 cases) or were cancer free (n = 7 cases) (P = 0.59), or (F) by the presence (n = 47 cases) or absence (n = 24 cases) of ER expression in the adjacent tumor (P = 0.15). G. Lobular type composition is not significantly influenced by hormonal effects of the menstrual cycle as depicted by initial and subsequent breast biopsies two to three weeks apart (n = 12 cases) for type 1 (P = 0.38), 2 (P = 0.32) and 3 (P = 0.46) lobules. All error bars represent standard error of the mean (SEM). LI, lower inner; LO, lower outer; UI, upper inner; UO, upper outer.
Figure 3
Figure 3
Histological evidence of postpartum involution in human breast. A. Percent lobular area by reproductive groups of nulliparous (N) (n = 12), pregnant (P) (n = 15), lactation (L) (n = 8), up to 1 (n = 6), >1 to ≤6 (n = 9), >6 to ≤12 (n = 5), >12 to ≤18 (n = 5), >18 to ≤24 months (n = 12), >2 to ≤6 years (n = 11) and >10 years (n = 10) since last child birth. Percent lobular area is significantly different from N during P (*P <0.0001), L (**P <0.0001), ≤1 (***P <0.0001), and at >1 to ≤6 months (****P = 0.0007) postpartum, and not statistically different at 12 months postpartum (P = 0.07). B. Breast lobular composition across the reproductive groups of N (n = 23), P (n = 16), L (n = 8), up to 1 (n = 6), >1 to ≤6 (n = 9), >6 to ≤12 (n = 5), >12 to ≤18 (n = 5), >18 to ≤24 months (n = 20), and >2 to ≤6 (n = 24), >6 to ≤10 (n = 10) and >10 years (n = 25) since last child birth. The lobular type composition is different from the N group during P (*P <0.001), L (**P <0.001), ≤1 month (***P <0.0001), >1 to ≤6 months (****P = 0.0001), >6 to ≤12 months (*****P = 0.001) postpartum, and is indistinguishable by 18 months postpartum (P = 0.08). C. Lobular composition of individual women who are >18 to ≤24 months postpartum (n = 20). D. An independent Norwegian cohort comprising Nulliparous (n = 10) and >10 years parous (n = 10) cases shows no lobular differences between groups. Type 1 (P = 0.72), 2 (P = 0.81) and 3 (P = 0.47). All error bars represent standard error of the mean (SEM).
Figure 4
Figure 4
Lobular differences in nulliparous and parous breast tissue. A. Significant differences in proliferative index using Ki-67 between breast lobules of nulliparous (N) (green), pregnant (Preg) (gray) and parous >10 year (purple) women. Lobules of Nulliparous and parous >10 years are different from Preg lobules (*P <0.0001). The inset shows there is a significant decrease in proliferative capacity in parous breast lobules when compared to Nulliparous breast lobules (**P = 0.030). B. Lobule count data show an increase in number of lobules per unit area in >2 years postpartum when compared to the Nulliparous breast tissue (*P = 0.04). C. The average area of type 1 lobules is significantly increased in Nulliparous breast tissue compared to type 1 lobules in >2 years postpartum breast issue (*P = 0.04). D. No significant differences were noted on comparing the acinar count of type 1 lobules between the Nulliparous and >2 years postpartum breast tissue (P = 0.66). E. The H & E stained images show Nulliparous breast tissue with a reduced number of lobules per area and larger size type 1 lobules when compared to >2 years postpartum breast tissue (Scale bar = 30 μm). All error bars represent standard error of the mean (SEM).
Figure 5
Figure 5
Evidence for apoptosis and immune cell infiltration during postpartum breast involution. Aa, b. H & E stained sections showing lactational and involutional morphology of lobules within an actively involuting postpartum breast. Ac, d. Apoptosis is evident in lobules with involutional morphology as detected by TUNEL stain (TdT nick end labeling) (arrow). Inset shows single acini in an involutional lobule with two apoptotic epithelial cells. B. Quantitation of TUNEL staining in lactational and involutional lobules from early involution breast tissue obtained from six women (*P <0.0001). C. Quantification of CD45+ immune cell numbers across reproductive groups of nulliparous (N) (n = 24), pregnant (P) (n = 7), ≤1 to ≤6 (n = 9), >6 to ≤12 (n = 7) and >12 to ≤24 months (n = 6), and >2 to ≤3 (n = 10), >3 to ≤6 (n = 13), >6 to ≤10 (n = 8) and >10 years (n = 13) postpartum. When compared to nulliparous cases there is a significant increase in CD45+ cells during pregnancy (*P = 0.005), ≤1 to ≤6 months (**P = 0.0002) and up to >6 to ≤12 months postpartum (***P = 0.01). D. Quantification of CD68+ macrophages by reproductive groups including nulliparous (N) (n = 12), pregnant (P) (n = 8), and ≤6 (n = 4), >6 to ≤12 (n = 5) and >12 to ≤24 months (n = 10), and >2 to ≤3 (n = 5), >3 to ≤6 (n = 7), >6 to ≤10 (n = 7) and >10 years (n = 19) postpartum. There is a significant increase in CD68+ cells during pregnancy (*P = 0.01), ≤1 to ≤6 (**P = 0.0001), >6 to ≤12 (***P = 0.01) and up to 24 months postpartum (****P = 0.02) when compared to nulliparous cases. All error bars represent standard error of the mean (SEM).

References

    1. Albrektsen G, Heuch I, Tretli S, Kvale G. Breast cancer incidence before age 55 in relation to parity and age at first and last births: a prospective study of one million Norwegian women. Epidemiology. 1994;5:604–611. - PubMed
    1. Lambe M, Hsieh C, Trichopoulos D, Ekbom A, Pavia M, Adami HO. Transient increase in the risk of breast cancer after giving birth. N Engl J Med. 1994;331:5–9. - PubMed
    1. Chie WC, Hsieh C, Newcomb PA, Longnecker MP, Mittendorf R, Greenberg ER, Clapp RW, Burke KP, Titus-Ernstoff L, Trentham-Dietz A, MacMahon B. Age at any full-term pregnancy and breast cancer risk. Am J Epidemiol. 2000;151:715–722. - PubMed
    1. Liu Q, Wuu J, Lambe M, Hsieh SF, Ekbom A, Hsieh CC. Transient increase in breast cancer risk after giving birth: postpartum period with the highest risk (Sweden) Cancer Causes Control. 2002;13:299–305. - PubMed
    1. Albrektsen G, Heuch I, Hansen S, Kvale G. Breast cancer risk by age at birth, time since birth and time intervals between births: exploring interaction effects. Br J Cancer. 2005;92:167–175. - PMC - PubMed

Publication types

MeSH terms