. 2014 Mar 31:15:248.
doi: 10.1186/1471-2164-15-248.

Identification of biomarkers that distinguish chemical contaminants based on gene expression profiles

Affiliations

Identification of biomarkers that distinguish chemical contaminants based on gene expression profiles

Xiaomou Wei et al. BMC Genomics. .

Abstract

Background: High throughput transcriptomics profiles such as those generated using microarrays have been useful in identifying biomarkers for different classification and toxicity prediction purposes. Here, we investigated the use of microarrays to predict chemical toxicants and their possible mechanisms of action.

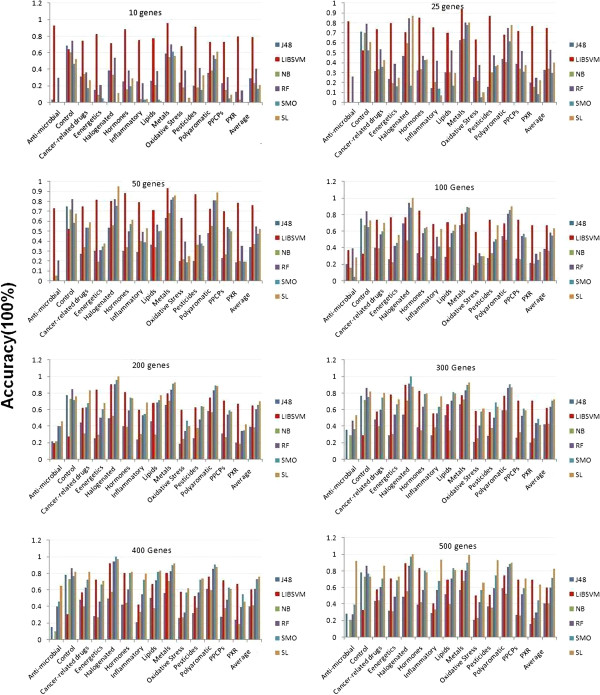
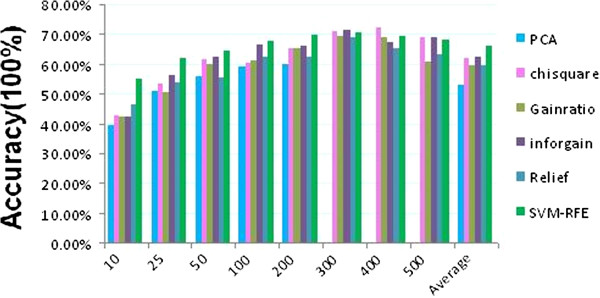
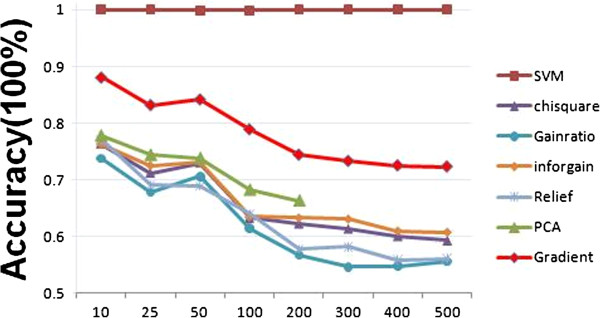
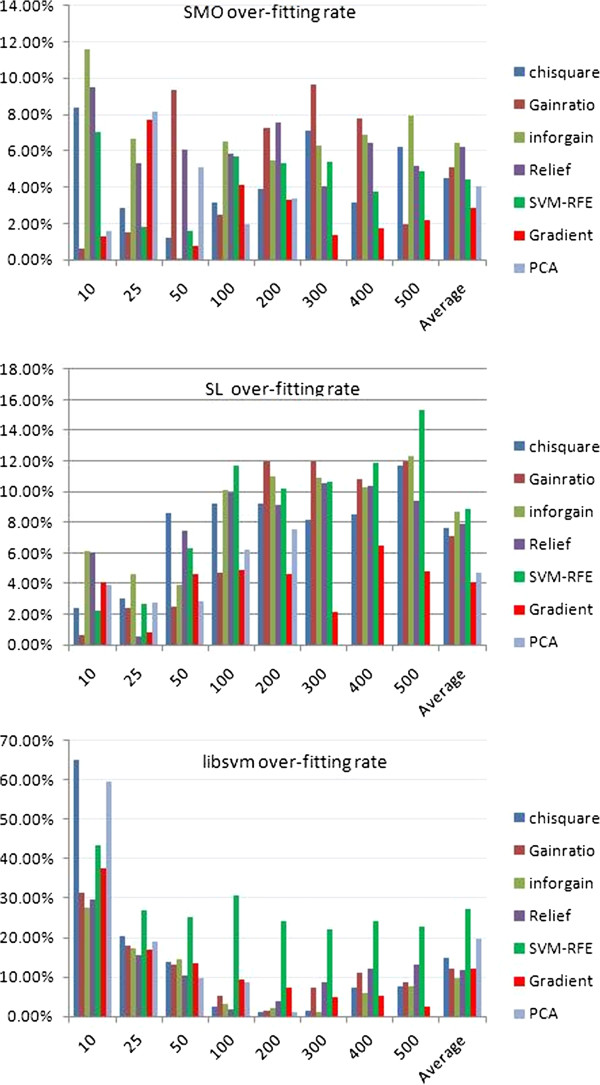
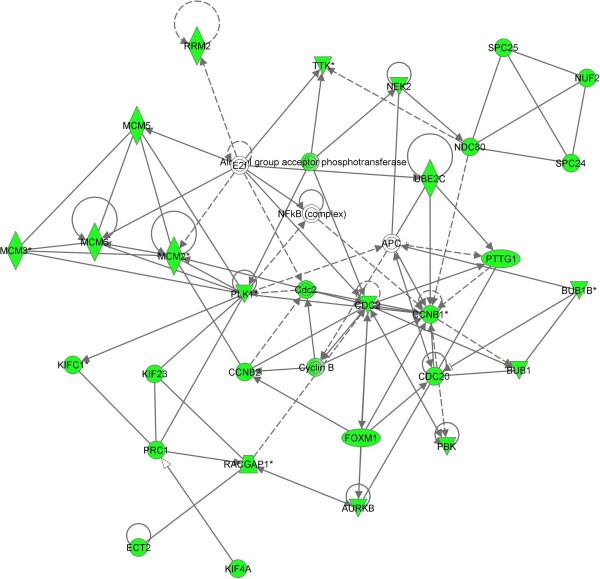
Results: In this study, in vitro cultures of primary rat hepatocytes were exposed to 105 chemicals and vehicle controls, representing 14 compound classes. We comprehensively compared various normalization of gene expression profiles, feature selection and classification algorithms for the classification of these 105 chemicals into14 compound classes. We found that normalization had little effect on the averaged classification accuracy. Two support vector machine (SVM) methods, LibSVM and sequential minimal optimization, had better classification performance than other methods. SVM recursive feature selection (SVM-RFE) had the highest overfitting rate when an independent dataset was used for a prediction. Therefore, we developed a new feature selection algorithm called gradient method that had a relatively high training classification as well as prediction accuracy with the lowest overfitting rate of the methods tested. Analysis of biomarkers that distinguished the 14 classes of compounds identified a group of genes principally involved in cell cycle function that were significantly downregulated by metal and inflammatory compounds, but were induced by anti-microbial, cancer related drugs, pesticides, and PXR mediators.

Conclusions: Our results indicate that using microarrays and a supervised machine learning approach to predict chemical toxicants, their potential toxicity and mechanisms of action is practical and efficient. Choosing the right feature and classification algorithms for this multiple category classification and prediction is critical.


Figures

Figure 1
Figure 1
Effect of normalization methods on the classification accuracy. Microarray experiments were developed using Agilent rat whole genome array (4 X 44 k). Cultured primary hepatocytes were treated with distinctive 105 compounds (Additional file 1) as well as respective vehicle controls for 24 h; subsequently RNAs were isolated for array hybridization. 105 compounds treated samples and control samples were divided into 14 classes. Two normalization methods (median and control) based normalizations were compared for the classification accuracy of the 14 classes.
Figure 2
Figure 2
Effect of initial feature filtering methods on the classification accuracy. Three initial feature filtering methods including One-Way ANOVA, Kruscal Wallis and One-Way ANOVA unequal variance were compared for the classification accuracy for 14 class compounds. Different feature (gene) sizes to compare the mean prediction accuracies of 14 classes for each method, by averaging the prediction accuracy of different classification algorithms.
Figure 3
Figure 3
Effect of classification algorithms on the classification accuracy. Six classification algorithms including J48, LibSVM, NB, RF, SMO and SL were used for the comparison. The prediction accuracy shown here was the mean value by averaging the prediction accuracy of 6 feature selection methods including ChiSquare, GainRatio, Inforgain, PCA, SVM-RFE and Relief for different feature (gene) sizes (10, 25, 50, 100, 200, 300, 400 and 500).
Figure 4
Figure 4
Effect of feature algorithms on the classification accuracy. The figure shows comparative prediction results for 6 feature selection methods, which include PCA, Chisquare, Gainratio, Inforgain, relief, and SVM-RFE. The prediction accuracy shown in the figure was mean values by averaging different classification algorithms including J48, LibSVM, NB, RF, SMO and SL for each feature size (10 to 500).
Figure 5
Figure 5
The best models for the classification of 14 class compounds. Seven feature selection methods, including PCA, Chisquare, Gradient, Gainratio, Inforgain, Relief, and SVM-RFE were used to compare their impact on the classifcation accuracy of 14 class compounds based on LibSVM classification algorithm. Different feature sizes (10 to 500) for each feature selection method were applied.
Figure 6
Figure 6
Comparison of prediction overfitting rate of various feature selection methods. The overfitting rates of different feature selection methods PCA, Chisquare, Gradient, Gainratio, Inforgain, Relief, and SVM-RFE over three classification algorithms, LibSVM, SMO and SL were compared. The overfitting rate was calculated by the percentage of the difference between the training accuracy and prediction accuracy of the summary of both the accuracies for a specific method.
Figure 7
Figure 7
Gene expression pattern analysis of biomarkers. A. 300 transcripts (horizontal axis) resulted from the Gradient algorithm was used to perform a two-way hierarchical analysis across 14 classes (vertical axis). B. 104 transcripts (horizontal axis) were used to perform a hierarchical clustering across different compounds in the classes of antimicrobial, cancer related drugs, pesticides, PXR mediators, inflammatory mediators, and metals as well as control (vertical axis). An Euclidean distance algorithm was applied to calculate the distances between transcripts or between conditions. The relative level of gene expression is indicated by the color scale at the bottom of Figure 7B.
Figure 8
Figure 8
Mitotic roles of Polo-like kinase pathway. Most of the genes in the mitotic of Polo-like kinase pathway were down regulated (green color highlighted) by most of the compounds in the classes of metals and inflammatory mediators, but up regulated by most of the compounds in the classes of antimicrobial, cancer related drugs, pesticides, and PXR mediators.
Figure 9
Figure 9
Cell cycle related gene network. A cell cycle network was constructed using Ingenuity knowledge base tool. Most of the genes in the network were down regulated (green color highlighted) by most of the compounds in the classes of metals and inflammatory mediators, but up regulated by most of the compounds in the classes of antimicrobial, cancer related drugs, pesticides, and PXR mediators. Nf-kB complex is connected with cell cycle genes.

Similar articles

Cited by

References

    1. Collins FS, Gray GM, Bucher JR. Toxicology. Transforming environmental health protection. Science. 2008;15:906–907. doi: 10.1126/science.1154619. - DOI - PMC - PubMed
    1. Kola I, Landis J. Can the pharmaceutical industry reduce attrition rates? Nat Rev Drug Discov. 2004;15:711–715. doi: 10.1038/nrd1470. - DOI - PubMed
    1. Huang R, Southall N, Xia M, Cho MH, Jadhav A, Nguyen DT, Inglese J, Tice RR, Austin CP. Weighted feature significance: a simple, interpretable model of compound toxicity based on the statistical enrichment of structural features. Toxicol Sci. 2009;15:385–393. doi: 10.1093/toxsci/kfp231. - DOI - PMC - PubMed
    1. Judson R, Richard A, Dix DJ, Houck K, Martin M, Kavlock R, Dellarco V, Henry T, Holderman T, Sayre P. The toxicity data landscape for environmental chemicals. Environ Health Perspect. 2009;15:685–695. doi: 10.1289/ehp.0800168. - DOI - PMC - PubMed
    1. Brown VJ. REACHing for chemical safety. Environ Health Perspect. 2003;15:A766–A769. doi: 10.1289/ehp.111-a766. - DOI - PMC - PubMed

Publication types

MeSH terms

LinkOut - more resources