Case Reports
. 2014 Jul;121(7):1435-44.
doi: 10.1016/j.ophtha.2014.01.034. Epub 2014 Mar 27.

Quantitative optical coherence tomography angiography of choroidal neovascularization in age-related macular degeneration

Affiliations
Case Reports

Quantitative optical coherence tomography angiography of choroidal neovascularization in age-related macular degeneration

Yali Jia et al. Ophthalmology. 2014 Jul.

Abstract

Purpose: To detect and quantify choroidal neovascularization (CNV) in patients with age-related macular degeneration (AMD) using optical coherence tomography (OCT) angiography.

Design: Observational, cross-sectional study.

Participants: A total of 5 normal subjects and 5 subjects with neovascular AMD were included.

Methods: A total of 5 eyes with neovascular AMD and 5 normal age-matched controls were scanned by a high-speed (100 000 A-scans/seconds) 1050-nm wavelength swept-source OCT. The macular angiography scan covered a 3 × 3-mm area and comprised 200 × 200 × 8 A-scans acquired in 3.5 seconds. Flow was detected using the split-spectrum amplitude-decorrelation angiography (SSADA) algorithm. Motion artifacts were removed by 3-dimensional (3D) orthogonal registration and merging of 4 scans. The 3D angiography was segmented into 3 layers: inner retina (to show retinal vasculature), outer retina (to identify CNV), and choroid. En face maximum projection was used to obtain 2-dimensional angiograms from the 3 layers. The CNV area and flow index were computed from the en face OCT angiogram of the outer retinal layer. Flow (decorrelation) and structural data were combined in composite color angiograms for both en face and cross-sectional views.

Main outcome measures: The CNV angiogram, CNV area, and CNV flow index.

Results: En face OCT angiograms of CNV showed sizes and locations that were confirmed by fluorescein angiography (FA). Optical coherence tomography angiography provided more distinct vascular network patterns that were less obscured by subretinal hemorrhage. The en face angiograms also showed areas of reduced choroidal flow adjacent to the CNV in all cases and significantly reduced retinal flow in 1 case. Cross-sectional angiograms were used to visualize CNV location relative to the retinal pigment epithelium and Bruch's layer and classify type I and type II CNV. A feeder vessel could be identified in 1 case. Higher flow indexes were associated with larger CNV and type II CNV.

Conclusions: Optical coherence tomography angiography provides depth-resolved information and detailed images of CNV in neovascular AMD. Quantitative information regarding CNV flow and area can be obtained. Further studies are needed to assess the role of quantitative OCT angiography in the evaluation and treatment of neovascular AMD.


Figures

Figure 1
Figure 1
Healthy control case. (A) Cross-sectional optical coherence tomography (OCT) reflectance image (conventional OCT B-scan). (B) Cross-sectional OCT angiography. Arrows point to locations where flows in inner retinal vessels are projected onto bright photoreceptor and retinal pigment epithelium layers. (C) Cross-sectional color OCT angiogram. The internal limiting membrane (ILM) and outer plexiform layer (OPL) and Bruch’s membrane (BM) are the boundaries separating inner retinal, outer retinal, and choroidal circulations. (D) En face angiogram of the inner retina. The dashed line indicates the cross-sections shown in A–C above. (E) En face angiogram of the outer retina. (F) En face angiogram of the choroid. En face angiograms were produced by maximum flow projections within segmented layers and span a 3×3 mm area. Higher decorrelation value corresponds to higher blood flow velocity.
Figure 2
Figure 2
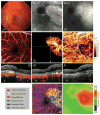
Age-related macular degeneration case 1: type I choroidal neovascularization (CNV). (A) Color fundus photograph showing subretinal hemorrhage. Red square outlines the area shown on angiograms below. (B) Early phase fluorescein angiogram (FA). (C) Late phase FA. (D) En face optical coherence tomography (OCT) angiogram of the inner retina. (E) En face angiogram of the outer retina showing the CNV. The yellow dashed lines indicate the position of OCT cross-section shown in Panel G. Yellow arrows indicate the superior to inferior direction. (F) En face angiogram of the choroid showing patchy flow directly under the CNV (blue dotted outline) and an adjacent area of reduced flow (green dotted outline). (G) Cross-sectional color OCT angiogram showing the CNV (yellow) was predominantly under the retinal pigment epithelium (RPE). The blue arrow shows the location of the subretinal fluid. The green arrow corresponds to the green dashed outline in Panel F showing a focal region of reduced choroidal flow adjacent to the CNV. S: superior; I: inferior. (H) Composite en face OCT angiograms showing most subretinal fluid (dark blue) inferior to the CNV. (I) Retinal thickness deviation map showing retinal thickening over the CNV.
Figure 3
Figure 3
Age-related macular degeneration case 2: type II choroidal neovascularization (CNV). (A) Fundus photography showing subretinal hemorrhage. The red square outlines the area shown on angiograms below. (B) Early phase fluorescein angiogram (FA). (C) Late phase FA. (D) En face optical coherence tomography (OCT) angiogram of the inner retina. (E) En face OCT angiogram of the outer retina showing the CNV. The yellow and green dashed lines indicate the position of OCT cross-section shown in Panels G, H and I. (F) En face angiogram of the choroid showing the patchy reduced flow directly under the CNV (blue dotted outline) and an adjacent area of reduced flow (green dotted outline). (G) Vertical cross-sectional color OCT angiogram showing the CNV (yellow) was predominantly above the retinal pigment epithelium (RPE). The green solid arrow corresponds to the green dotted outline in F showing a focal region of reduced choroidal flow inferonasal to the CNV. The green hollow arrow points out a high choroidal flow signal superior to the CNV. (H) Horizontal cross-sectional color OCT angiogram showing the feeder vessel (yellow dotted circle) that corresponds to the white arrows in Panels E and F. Also note cystic intraretinal fluid above the CNV. (I) Horizontal cross-sectional OCT reflectance image showing the feeder vessel seen as a flow void. (J) Composite en face OCT angiogram showing subretinal fluid (dark blue) at the superonasal corner and intraretinal fluid (light blue) over the CNV. (K) Retinal thickness deviation map showing thickening over the CNV. Fly through movies of 3D color OCT angiograms are available as a supplement (Video 1 and 2).
Figure 4
Figure 4
Age-related macular degeneration case 3: combined type I and type II choroidal neovascularization (CNV). (A) Fundus photography showing subretinal hemorrhage, retinal pigment epithelium (RPE) tear, and geographic atrophy (blue dashed outline). Red square outlines area shown on angiograms below. (B) Early phase fluorescein angiogram (FA). (C) Late phase FA. (D) En face optical coherence tomography (OCT) angiogram of the inner retina. (E) En face angiograms of the outer retina showing the CNV. The yellow dashed lines indicate the position of OCT cross-section shown in Panel G. (F) En face angiogram of the choroid showing diffuse reduction of flow signal under the pigment epithelial detachment and choriocapillaris defect in the area of geographic atrophy (blue dashed outline). (G) Cross-sectional color OCT angiogram showing the CNV both above and below the RPE. The subretinal hemorrhage was over the CNV and overshadowed the CNV at its nasal edge. (H) Composite en face OCT angiograms. (I) Retinal thickness deviation map showing thinning over the CNV and thickening around it.

References

    1. Eye Diseases Prevalence Research Group. Causes and prevalence of visual impairment among adults in the United States. Arch Ophthalmol. 2004;122:477–85. - PubMed
    1. Ferris FL, III, Fine SL, Hyman L. Age-related macular degeneration and blindness due to neovascular maculopathy. Arch Ophthalmol. 1984;102:1640–2. - PubMed
    1. Ambati J, Ambati BK, Yoo SH, et al. Age-related macular degeneration: etiology, pathogenesis, and therapeutic strategies. Surv Ophthalmol. 2003;48:257–93. - PubMed
    1. Stanga PE, Lim JI, Hamilton P. Indocyanine green angiography in chorioretinal diseases: indications and interpretation: an evidence-based update. Ophthalmology. 2003;110:15–21. - PubMed
    1. Lopez-Saez MP, Ordoqui E, Tornero P, et al. Fluorescein-induced allergic reaction. Ann Allergy Asthma Immunol. 1998;81:428–30. - PubMed

Publication types