Review
. 2014 Nov 1;32(6):1133-44.
doi: 10.1016/j.biotechadv.2014.03.004. Epub 2014 Mar 25.

Monitoring Keap1-Nrf2 interactions in single live cells

Affiliations
Review

Monitoring Keap1-Nrf2 interactions in single live cells

Liam Baird et al. Biotechnol Adv. .

Abstract

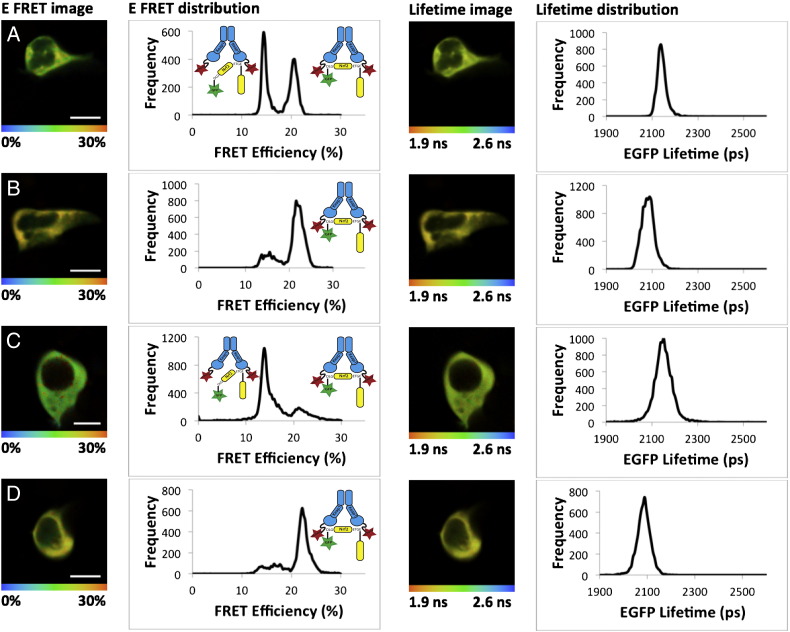
The transcription factor NF-E2 p45-related factor 2 (Nrf2) and its negative regulator Kelch-like ECH associated protein 1 (Keap1) control the expression of nearly 500 genes with diverse cytoprotective functions. Keap1, a substrate adaptor protein for Cullin3/Rbx1 ubiquitin ligase, normally continuously targets Nrf2 for degradation, but loses this ability in response to electrophiles and oxidants (termed inducers). Consequently, Nrf2 accumulates and activates transcription of its downstream target genes. Many inducers are phytochemicals, and cruciferous vegetables represent one of the richest sources of inducer activity among the most commonly used edible plants. Here we summarize the discovery of the isothiocyanate sulforaphane as a potent inducer which reacts with cysteine sensors of Keap1, leading to activation of Nrf2. We then describe the development of a quantitative Förster resonance energy transfer (FRET)-based methodology combined with multiphoton fluorescence lifetime imaging microscopy (FLIM) to investigate the interactions between Keap1 and Nrf2 in single live cells, and the effect of sulforaphane, and other cysteine-reactive inducers, on the dynamics of the Keap1-Nrf2 protein complex. We present the experimental evidence for the "cyclic sequential attachment and regeneration" or "conformation cycling" model of Keap1-mediated Nrf2 degradation. Finally, we discuss the implications of this mode of regulation of Nrf2 for achieving a fine balance under normal physiological conditions, and the consequences and mechanisms of disrupting this balance for tumor biology.

Keywords: Cytoprotective enzymes; FLIM; FRET; Keap1; Nrf2; Sulforaphane.


Figures

Fig. 1
Fig. 1
Domain structure of Nrf2 (A) and Keap1 (B). (A) In Nrf2, the positions of the seven functional domains Neh1-7 are shown. Neh1 contains the DNA binding and heterodimerization domain. The Neh2 domain is the main negative regulatory domain of Nrf2 through which it binds to Keap1 via the DLG and ETGE motifs. The Neh3, Neh4 and Neh5 domains bind to the transcriptional co-activators CHD6 and CBP. The Keap1-independent degradation of Nrf2 is mediated through the Neh6 domain. Nrf2 binds to the retinoid X receptor alpha (RXRα) through the Neh7 domain. (B) In Keap1, five functional domains are shown. Keap1 dimerization and Cul3 binding are mediated by the BTB domain. The intervening region (IVR) contains a number of reactive cysteine residues through which Nrf2 activity is regulated, including C226, C273 and C288. The Kelch domain forms a 6-bladed β-propeller structure through which Keap1 binds to the Neh2 domain of Nrf2, and to the KIR domain of p62, among other proteins.
Fig. 2
Fig. 2
The myrosinase reaction. In the intact plant, the isothiocyanate sulforaphane is present as an inert precursor, the glucosinolate glucoraphanin. The hydrolysis of glucoraphanin is catalyzed by myrosinase which normally is compartmentalized in adjacent plant cells. Enzyme and substrate come in contact upon plant injury. As a result of the myrosinase-catalyzed hydrolysis, an unstable aglucone is formed first, and glucose is liberated. Depending on the reaction conditions, a series of final products can result, and the isothiocyanate sulforaphane represents one major product.
Fig. 3
Fig. 3
Detection of Förster resonance energy transfer (FRET) by fluorescence lifetime imaging microscopy (FLIM) between EGFP–Nrf2 and Keap1–mCherry fusion proteins. (Left) EGFP–Nrf2 and free mCherry fluorescent proteins do not interact (left, top). On absorbing 2-photons excitation light, the donor fluorophore changes from ground state (S0) to the excited state (S2), as illustrated in the simplified Jablonski energy-level diagram (left, bottom). This is followed by emission of a photon (fluorescence) during the next few nanoseconds (τD). (Middle) EGFP–Nrf2 interacts with one monomer of the Keap1–mCherry dimer, and forms a Keap1–Nrf2 complex in an “open conformation” (middle, top). The two fluorescent fusion proteins interact, illustrating the effect of energy transfer on donor fluorescence lifetime. As the Jablonski diagram shows (middle, bottom), deactivation from the donor excited state can occur either by fluorescence (downward-pointing arrow), or through the radiationless transfer of energy to the acceptor by FRET. The occurrence of FRET is detectable by a decrease in the donor fluorescence lifetime (τFRET). (Right) EGFP–Nrf2 interacts with both monomers of the Keap1–mCherry dimer and forms a Keap1–Nrf2 complex in a “closed conformation” (right, top). As illustrated by the thicker black arrow the non-radiative transfer of energy to the acceptor is stronger due to the closer proximity between EGFP–Nrf2 and Keap1–mCherry proteins. Consequently, a more drastic decrease in the donor fluorescence lifetime (τFRET) is measured (right, bottom).
Fig. 4
Fig. 4
Time-correlated single photon counting (TCSPC) FLIM principle. The time-correlated single photon counting (TCSPC) FLIM system is based on the detection of single photons of a periodical light signal, followed by the measurement of the detection times of the individual photons, and the reconstruction of the waveform from the individual time measurements. For each pixel during the scanning acquisition time, when a single photon is detected from the donor EGFP–Nrf2 in the absence or in the presence of the acceptor Keap1–mCherry (A and B, respectively), the time of the corresponding detector pulse is measured. Each detection event is recorded in memory, associated with its specific detection time (left panels). Over time, the waveform of the optical pulse builds up, corresponding to a histogram presenting the number of photons recorded for each detection time interval (right panels). In the absence of FRET (A), a single exponential model is used to fit the experimental donor fluorescence decay. This analysis delivers the lifetime value τD. In a FRET situation (B), a double exponential model can approximate the resulting donor fluorescence decay, with a slow lifetime component τD from the fraction of non-interacting EGFP–Nrf2 donor molecules (blue part of the fit) and a fast component from the fraction of interacting EGFP–Nrf2 donor molecules (red part of the fit). The composition of the donor decay function is written on the right. Double exponential decay analysis delivers the lifetimes, τD and τFRET, and the intensity factors, a and b, of the two decay components. For each condition, a false-color image, displaying the distribution of the fluorescence lifetime for each pixel of the image, is shown.
Fig. 5
Fig. 5
Inducers promote the formation of the closed conformation of the Keap1–Nrf2 complex. HEK293 cells were transfected with EGFP–Nrf2 + Keap1–mCherry and imaged 24 h later. Both the EGFP lifetime and FRET efficiency (E-FRET) were quantified in individual cells which were imaged twice, once in the basal state (A, C) and once again after 1-h treatment with either 5 μM sulforaphane (SFN) (B) or 10 μM STCA (D). The left column shows pictorial representations of the E-FRET where the color of the cell corresponds to the FRET efficiency according to the legend below the image, ranging from 0% to 30%. The second column shows the E-FRET from each pixel of the image plotted on a graph, with E-FRET on the x-axis and frequency on the y-axis. The graphs show that both SFN and STCA alter the FRET efficiency to favor the closed conformation (21% E-FRET population) of the Keap1–Nrf2 complex. This change can also be seen in the images in the first column, as both (B) and (D) contain more yellow and less green than (A) and (C). The third column shows a pictorial representation of the EGFP lifetime data from which the E-FRET data are derived. In these images, the color of the cell corresponds to the lifetime of EGFP, ranging from 1.9 ns to 2.6 ns as indicated on the legend below the image. The right column shows the lifetime data from each pixel of the image plotted on a graph, with lifetime on the x-axis and frequency on the y-axis. The graphs of the lifetime data show that in the presence of either SFN (B) or STCA (D), the lifetime of EGFP is reduced, manifesting as a shift in the EGFP lifetime to the left relative to the basal state shown in (A) and (C). This lifetime reduction is shown pictorially in the third column, where in the presence of either inducer the cells become yellow/orange and less green/yellow. Together these data show that in response to SFN or STCA, the lifetime of EGFP–Nrf2 is reduced, coupled with a change in E-FRET corresponding to an increase in the formation of the closed conformation of the Keap1–Nrf2 complex.
Fig. 6
Fig. 6
Nrf2-dependent regulation of cytoprotective gene expression. (A) The cyclic sequential attachment and regeneration model of Keap1-mediated degradation of Nrf2, with Keap1 in blue and Nrf2 in yellow. (B) Inducers produce a conformational change in Keap1 and thus uncouple the formation of the closed conformation of the complex from Nrf2 ubiquitination. This allows newly-translated Nrf2 to translocate to the nucleus and activate cytoprotective gene expression. (C) The Keap1-dependent cycle of Nrf2 degradation is finely balanced such that any increase in Nrf2 level, through enhanced transcription, or decrease in Keap1 level, by promoter hypermethylation or miRNA activity, leads to the saturation of Keap1 allowing the free Nrf2 to activate target gene expression. (D) When the Keap1–Nrf2 complex is in the open conformation, the Kelch domain of Keap1 and the DLG motif of Nrf2 are exposed and thus can bind to other proteins. This binding inhibits the formation of the closed conformation, and thus Nrf2 ubiquitination, and therefore allows other signaling pathways to regulate Nrf2 activity.

References

    1. Abazeed M.E., Adams D.J., Hurov K.E., Tamayo P., Creighton C.J., Sonkin D., et al. Integrative radiogenomic profiling of squamous cell lung cancer. Cancer Res. 2013;73:6289–6298. - PMC - PubMed
    1. Adam J., Hatipoglu E., O'Flaherty L., Ternette N., Sahgal N., Lockstone H., et al. Renal cyst formation in Fh1-deficient mice is independent of the Hif/Phd pathway: roles for fumarate in KEAP1 succination and Nrf2 signaling. Cancer Cell. 2011;20:524–537. - PMC - PubMed
    1. Ahn Y.H., Hwang Y., Liu H., Wang X.J., Zhang Y., Stephenson K.K., et al. Electrophilic tuning of the chemoprotective natural product sulforaphane. Proc Natl Acad Sci U S A. 2010;107:9590–9595. - PMC - PubMed
    1. Bae S.H., Sung S.H., Oh S.Y., Lim J.M., Lee S.K., Park Y.N., et al. Sestrins activate Nrf2 by promoting p62-dependent autophagic degradation of Keap1 and prevent oxidative liver damage. Cell Metab. 2013;17:73–84. - PubMed
    1. Baird L., Dinkova-Kostova A.T. The cytoprotective role of the Keap1–Nrf2 pathway. Arch Toxicol. 2011;85:241–272. - PubMed

Publication types

Substances

LinkOut - more resources