. 2014 May;15(1):21-30.
doi: 10.1016/j.gep.2014.03.002. Epub 2014 Mar 26.

Expression analysis of Dact1 in mice using a LacZ reporter

Affiliations

Expression analysis of Dact1 in mice using a LacZ reporter

Daisuke Suzuki et al. Gene Expr Patterns. 2014 May.

Abstract

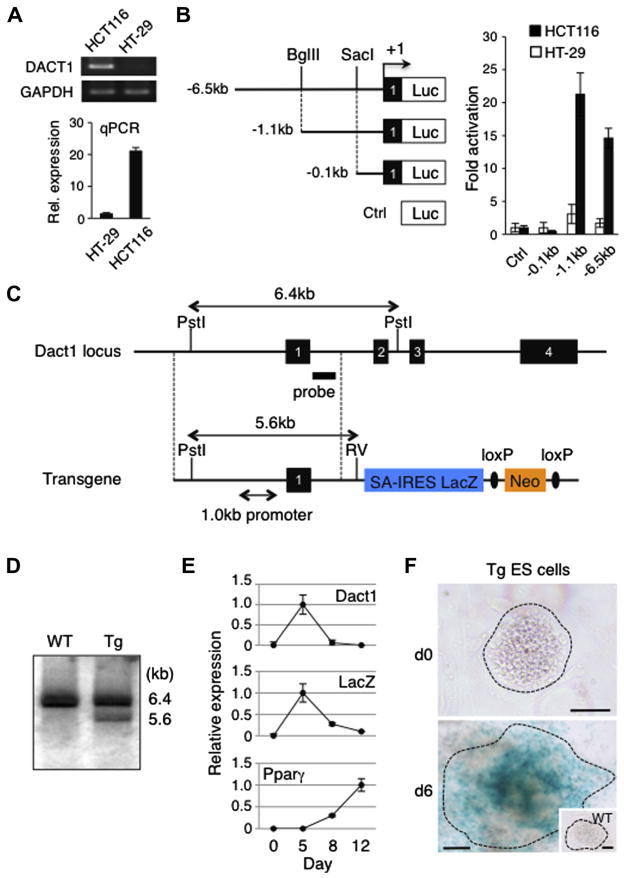
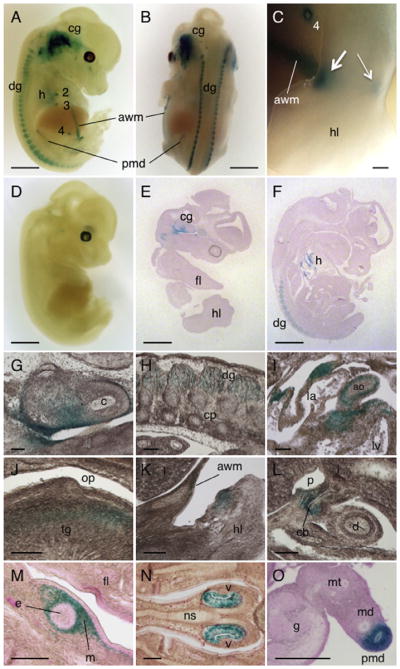
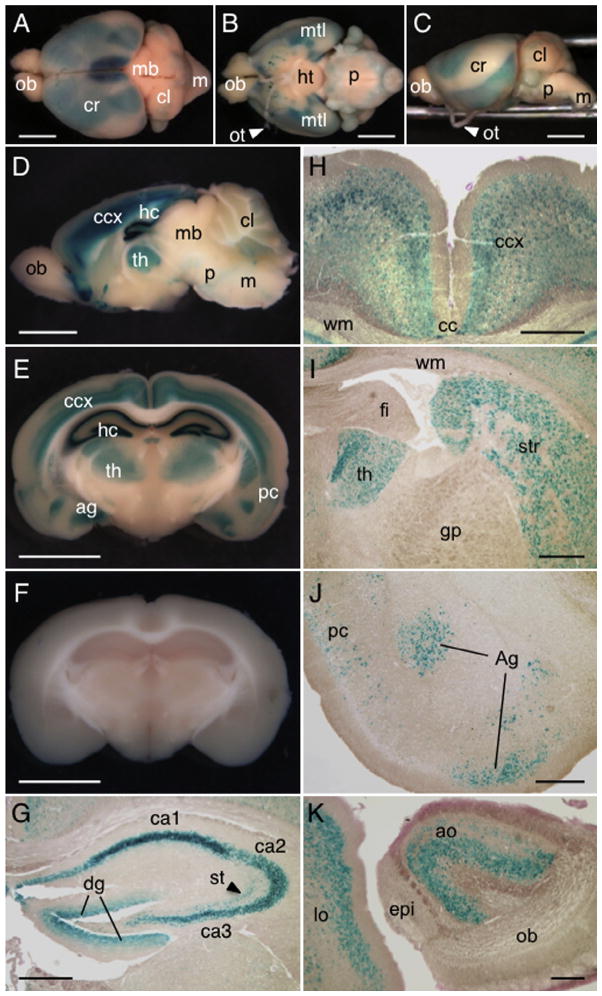
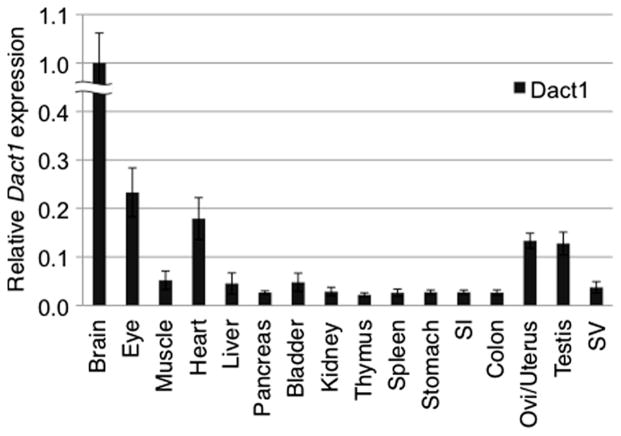
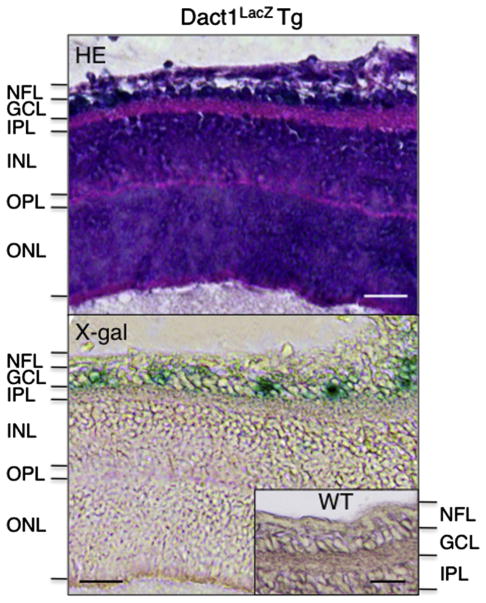
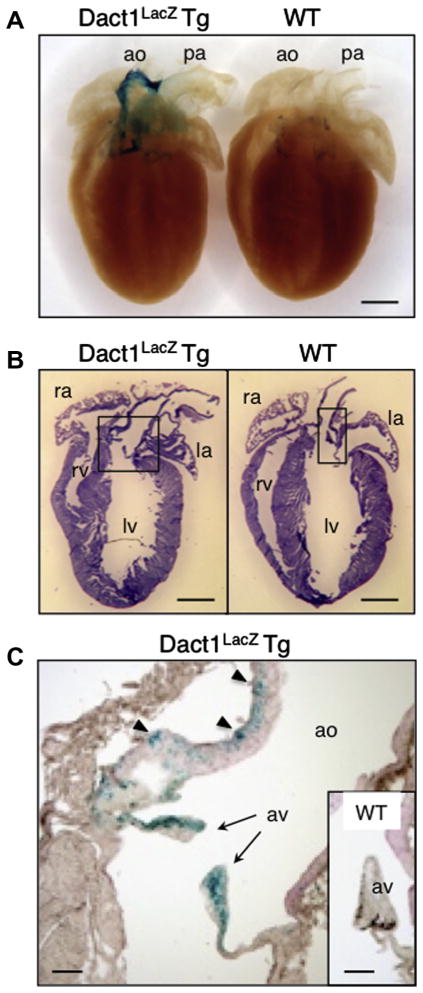
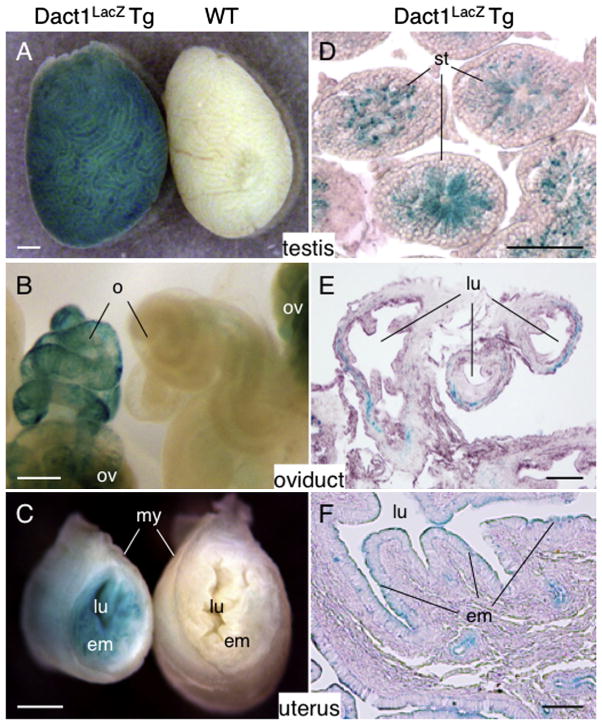
The Wnt signaling pathway is essential for cell fate decisions during embryonic development as well as for homeostasis after birth. Dapper antagonist of catenin-1 (Dact1) plays an important role during embryogenesis by regulating Wnt signaling pathways. Consequently, targeted disruption of the Dact1 gene in mice leads to perinatal lethality due to severe developmental defects involving the central nervous system, genitourinary system and distal digestive tract. However, the expression and potential function of Dact1 in other tissues during development and postnatal life have not been well studied. Here, we have generated reporter mice in which LacZ expression is driven by the Dact1 gene promoter and characterized Dact1-LacZ expression in embryos and adult tissues. Our data show that while Dact1-LacZ is expressed in multiple mesoderm- and neuroectoderm-derived tissues during development, high expression of Dact1-LacZ is restricted to a small subset of adult tissues, including the brain, eye, heart, and some reproductive organs. These results will serve as a basis for future investigation of Dact1 function in Wnt-mediated organogenesis and tissue homeostasis.

Keywords: Dact1; Embryogenesis; Homeostasis; LacZ reporter; Wnt signal.


Figures

Fig. 1
Fig. 1
Characterization of the Dact1 gene promoter and Tg ES cells used for the generation of Dact1LacZ reporter mice. (A) Evaluation of the DACT1 gene expression in two colorectal cancer cell lines. Differential expression of the DACT1 gene in HCT116 and HT-29 cells was determined by semi-quantitative RT-PCR, followed by gel electrophoresis and staining with ethidium bromide (top) and real-time PCR (qPCR), expressed as the mean ± s.d. (bottom). In both RT-PCR and qPCR, expression of GAPDH served as an internal control. (B) Reporter assays with Dact1 gene promoter constructs. A series of Firefly luciferase reporter constructs were co-transfected with a Renilla luciferase control plasmid into HCT116 and HT-29 cells. Forty-eight hours after transfection, luciferase activities were measured and Firefly luciferase activity was normalized to that of Renilla luciferase. Data shown are the mean ± s.d. from three independent experiments. Luc, a promoter-less luciferase cassette; +1, transcription initiation site within exon 1 of the Dact1 gene; Ctrl, control. (C) Endogenous Dact1 allele (top) and a transgenic construct (bottom) used for the generation of Dact1LacZ Tg mice. The transgene contains a 6.0 kb fragment homologous to the endogenous Dact1 locus (indicated by dotted lines) including the 1.0 kb Dact1 promoter region, followed by a reading frame-independent LacZ gene cassette composed of an En2 splice acceptor (SA), internal ribosomal entry site (IRES) and β-galactosidase cDNA with SV40 poly A (LacZ), and a neomycin resistant gene cassette (Neo) flanked by loxP sites (ovals). Dact1LacZ-neo Tg mice were crossed with Actβ-Cre Tg mice to delete the Neo cassette, generating Dact1LacZ Tg mice. Solid boxes with numbers, Dact1 exons 1–4; RV, EcoRV. (D) Southern blot analysis. Genomic DNAs from WT and Tg ES cells were digested with Pst I and EcoRV and hybridized with a DNA probe shown in (C). (E) Real-time PCR analysis of Dact1, Dact1-LacZ and Pparγ expression in Tg ES cells upon differentiation into the adipogenic lineage. Expression of each gene was normalized to Rps18 transcript levels. The highest expression was set at 1.0 and data shown are the mean ± s.d. from three independent experiments. (F) Dact1-LacZ activities as determined by X-gal staining of Tg ES cells before and after differentiation into the adipogenic lineage. WT ES cells were used as a negative control (inset). Data shown are representative of three independent experiments with similar results. Bars = 100 μm.
Fig. 2
Fig. 2
Expression of Dact1-LacZ in embryos. (A–D) E12.5 embryos stained for LacZ activity and photographed as whole mount preparations. (A and B) Dact1LacZ Tg mouse embryos showing strong LacZ signals in the cranial ganglion, dorsal root ganglion, heart, nipples, paramesonephric duct, and abdominal wall mesenchyme. (C) An enlarged view of the hindlimb showing LacZ signals in the ankle with a stronger signal in anterior (thick arrow) than posterior region (thin arrow). (D) WT embryo serving as a negative control. (E and F) Sagittal sections of X-gal-stained E12.5 Dact1LacZ Tg mouse embryos showing strong LacZ signals in the cranial ganglion, heart and dorsal root ganglion. (G–O) Enlarged views of embryonic tissues prepared from E12.5 (G–L) and E14.5 (M–O) Dact1LacZ Tg mouse embryos stained for LacZ activity using X-gal, followed by sectioning. Dact1-LacZ expression was detected in the inner ear (G) and the dorsal root ganglion (H). In the heart, Dact1-LacZ was expressed in the vessel wall and myocardium in the atrioventricular junction (I). Dact1-LacZ was also detected in the intrinsic muscle of the tongue (J) and mesenchyme surrounding some developing structures such as the limb (K), common bile duct (L) and nipple (M). The vomeronasal organ (N) and paramesonephric duct (O) also expressed Dact1-LacZ. cg, cranial ganglion; dg, dorsal root ganglion; h, heart; 2–4, mammary placodes 2–4; awm, abdominal wall mesenchyme; pmd, paramesonephric duct; hl, hindlimb; fl, forelimb; c, cochlea; cp, cartilage primordium; ao, aorta; la, left atrium; lv, left ventricle; op, oropharynx; tg, tongue; l, liver; cb, common bile duct; p, portal vein; d, duodenum; e, epithelial component of mammary placode; m, mesenchymal component of mammary placode; v, vomeronasal organ; ns, nasal septum; md, mesonephric duct; mt, mesonephric tubule; g, gonad (ovary). Scale bars = 1 mm (A, B and D–F), 0.1 mm (C) and 100 μm (G–O).
Fig. 3
Fig. 3
Expression of Dact1-LacZ in adult brain. (A–C) The brains from 8 week-old Dact1LacZ Tg mice were stained for LacZ activity using X-gal and photographed as whole mount preparations. Shown are dorsal (A), ventral (B) and lateral (C) views of the brain. (D–F) The brains from Dact1LacZ Tg mice (D and E) and WT littermates (F) were sliced sagittally along the midline (D) or coronally in the central region of the cerebrum (E and F) and stained for LacZ activity using X-gal. The strongest LacZ signals were detected in the hippocampus, followed by cerebral cortex, ventral forebrain, thalamus and the medial temporal lobes. Weak signals were also noted in the cerebellum, pons and medulla. (G) Within the hippocampus, Dact1-LacZ was detected in the pyramidal neurons in the cornu ammonis regions, granular cells in the dentate gyrus and some interneurons in the stratum radiatum. (H–J) Expression of Dact1-LacZ in other regions of the cerebrum including the cerebral cortex (H), thalamus and striatum (I), amygdaloid nucleus and piriform cortex (J). (K) Expression of Dact1-LacZ in anterior olfactory nucleus and lateral orbital cortex in the ventral forebrain. We analyzed the brains from postnatal day 7 (P7) to 36-week old mice and found similar results. ob, olfactory bulb; cr, cerebrum; mb, midbrain; cl, cerebellum; m, medulla; ht, hypothalamus; p, pons; mtl, medial temporal lobe; ot, optic tract; ccx, cerebral cortex; hc, hippocampus; th, thalamus; ag, amygdaloid nucleus; pc, piriform cortex; ca1–3, cornu ammonis areas 1–3; dg, dentate gyrus; st, stratum radiatum; cc, central canal; wm, white matter; fi, fimbria of hippocampus; gp, external globus pallidus; str, striatum; ao, anterior olfactory nucleus; lo, lateral orbital cortex; epi, accessory olfactory bulb. Scale bars = 3 mm (A–F) and 500 μm (G–K).
Fig. 4
Fig. 4
Expression of Dact1 in adult mouse tissues. Real-time PCR was performed using cDNA prepared from 4-week old WT adult mouse tissues. Dact1 was highly expressed in the brain, followed by the eye, heart, oviduct/uterus and testis. The expression level of Dact1 was normalized to the expression of a housekeeping gene Rps18. Data shown are representative of two independent experiments with similar results and expressed as the mean ± s.d. SI, small intestine; Ovi, oviduct; SV, seminal vesicle.
Fig. 5
Fig. 5
Expression of Dact1-LacZ in adult eye. The eyes from 8 week-old Dact1LacZ Tg mice were stained for LacZ activity and cut into serial sections, followed by staining with hematoxylin and eosin (HE, top) or eosin alone (bottom). Inset in the lower panel indicates the retina from a WT littermate serving as a negative control. We analyzed the eyes from P1 to 15-week old mice and found similar results. NFL, optic nerve fiber layer; GCL, ganglion cell layer; IPL, inner plexiform layer; INL, inner nuclear layer; OPL, outer plexiform layer; ONL, outer nuclear layer. Scale bars = 25 μm.
Fig. 6
Fig. 6
Expression of Dact1-LacZ in adult heart. (A and B) The hearts from 8 week-old Dact1LacZ Tg mice and WT littermates were stained for LacZ activity and photographed as whole mount preparations (A) or cut into sections, followed by hematoxylin and eosin (HE) staining (B). (C) An enlarged view of the conotruncal region in the Dact1LacZ Tg mouse heart showing LacZ staining in the connective tissue of the aortic valve (arrows) and the muscle between elastic fibers in aorta (arrow heads). Inset in (C) shows the aortic valve in a WT littermate mouse serving as a negative control. We analyzed the hearts from P0 to 35-week old mice and found similar results. ao, aorta; pa, pulmonary artery; ra, right atrium; la, left atrium; rv, right ventricle; lv, left ventricle; av, aortic valve. Scale bars = 1 mm (A and B) and 200 μm (C).
Fig. 7
Fig. 7
Expression of Dact1-LacZ in adult reproductive organs. (A–F) The testis, oviduct and uterus from 8 week-old Dact1LacZ Tg mice and WT littermates were stained for LacZ activity and photographed as whole mount preparations (A–C) or cut into sections, followed by counterstaining with eosin (D–F). Dact1-LacZ was expressed in the late spermatids (D), the connective tissue in the outer wall of the oviduct (E) and the uterine endometrium (F). Note that the ovary shows non-specific LacZ signals (B). We analyzed the tissues from P1 to 35-week old mice and found similar results except for the testes that were negative for LacZ activity before 3 weeks of age. st, seminiferous tubule; o, oviduct; ov, ovary; lu, lumen; em, endometrium; my, myometrial layer. Scale bars = 0.5 mm (A–C), 50 μm (D) and 100 μm (E and F).

References

    1. Angers S, Moon RT. Proximal events in Wnt signal transduction. Nat Rev Mol Cell Biol. 2009;10:468–477. - PubMed
    1. Arguello A, Yang X, Vogt D, Stanco A, Rubenstein JL, Cheyette BN. Dapper antagonist of catenin-1 cooperates with Dishevelled-1 during postsynaptic development in mouse forebrain GABAergic interneurons. PLoS One. 2013;8:e67679. - PMC - PubMed
    1. Chen SY, Cheng HJ. Functions of axon guidance molecules in synapse formation. Curr Opin Neurobiol. 2009;19:471–478. - PMC - PubMed
    1. Cheyette BN, Waxman JS, Miller JR, Takemaru K, Sheldahl LC, Khlebtsova N, Fox EP, Earnest T, Moon RT. Dapper, a Dishevelled-associated antagonist of beta-catenin and JNK signaling, is required for notochord formation. Dev Cell. 2002;2:449–461. - PubMed
    1. Chien KR. Myocyte survival pathways and cardiomyopathy: implications for trastuzumab cardiotoxicity. Semin Oncol. 2000;27:9–14. - PubMed

Publication types

Substances

LinkOut - more resources